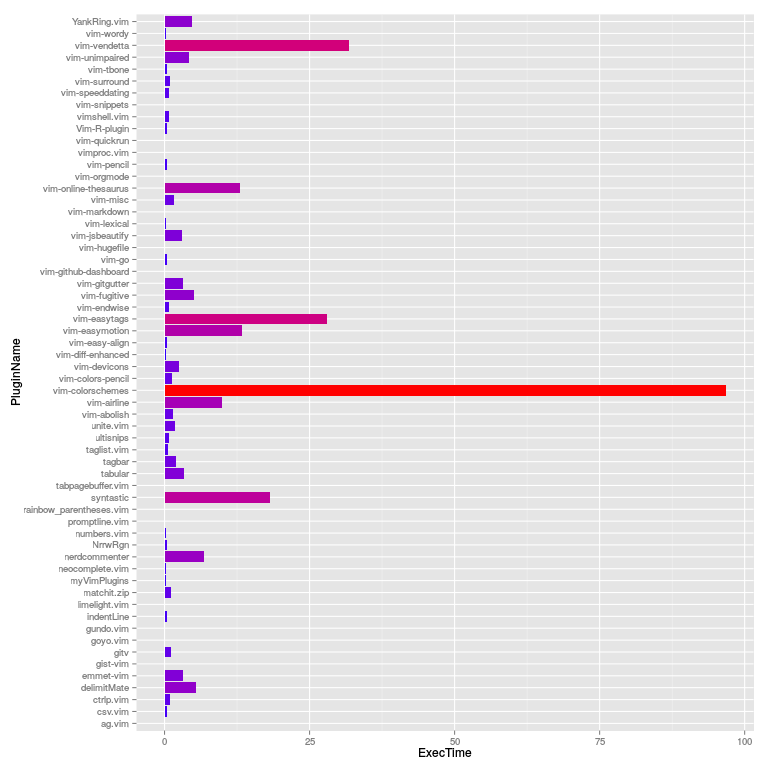
Here is a screenshot to have a quick look at what this is all about.
Here is a peek at the profiling result for my plugins:
Generating vim startup profile...
Parsing vim startup profile...
Crunching data and generating profile plot ...

Your plugins startup profile graph is saved
as `profile.png` under current directory.

==========================================
Top 10 Plugins That Slows Down Vim Startup
==========================================
   1	105.13	"vim-colorschemes"
   2	42.661	"vim-easytags"
   3	31.173	"vim-vendetta"
   4	22.02	"syntastic"
   5	13.362	"vim-online-thesaurus"
   6	7.888	"vim-easymotion"
   7	6.931	"vim-airline"
   8	6.608	"YankRing.vim"
   9	5.266	"nerdcommenter"
  10	5.017	"delimitMate"
==========================================
Done!
If you use vim-plug (or other amazing plugin manager of your choice) to install your vim (gvim or macvim) plugins, then chances are high that it gets addictive. You will find yourself with several dozens of useful plugins.
vim-plug (and NeoBundle) offers you to load your plugins on-demand (lazy-loading). But
which needs fine tuning? Well, using vim's built-in profiling vim --startuptime you can get a timing for all function calls during
startup. However, the data is for each functions. You will have to
figure out the math, and make sure those functions calls are form the
same plugins. Even some sorting might help, but sorting the timing for
each functions does not really make sense because it is really time of the
plugins (but not the functions) that you really care about.
I am poor at doing mental math, even for simple sums. However, with the power of a simple bash script and R, we can get all we want.
Here is the list of supported managers. Hopefully, your favourite plugin manager is among the list. If not, or if you prefer to manage your own plguins (using symlinks, of course), we could still adjust the code.
This is NOT a vim plugin! This is simply a profiler for your vim plugins that are installed through various plugin managers such as vim-plug.
Download the .zip here and then simply run the bash script:
sh ./vim-plugins-profile.sh

# Alternatively use Ruby powers! Less dependency, graph with ASCII art
ruby ./vim-plugins-profile.rb

# To use an alternative executable such as neovim, pass it as the first argument.
ruby ./vim-plugins-profile.rb nvim
Then open the profile.png file for the result! It is that simple.
You will need to install several tools before you can run this. Chances are that you already have them. The script prompts whether it should install the R:ggplot2 package if you already have R. Here are the list of dependencies:
Alternatively, you could use Ruby for the same analysis. It does not depend on extra libraries, but will not produce eye-candy graphs either.
- Maybe optionally use
gnuplotormatplotlibinstead ofR:ggplot2if any of the other two are installed already.
