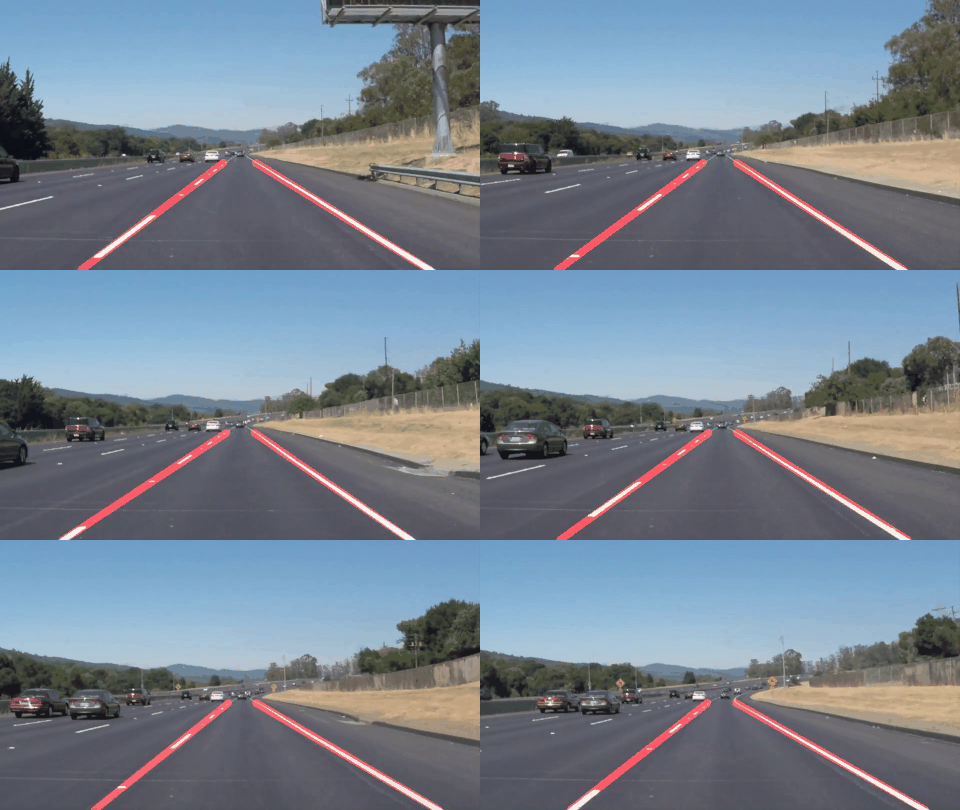
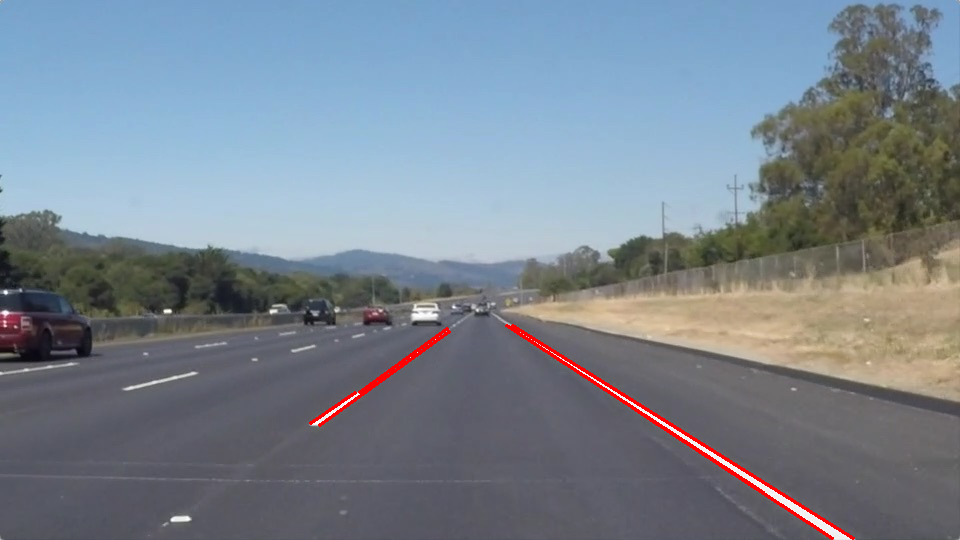
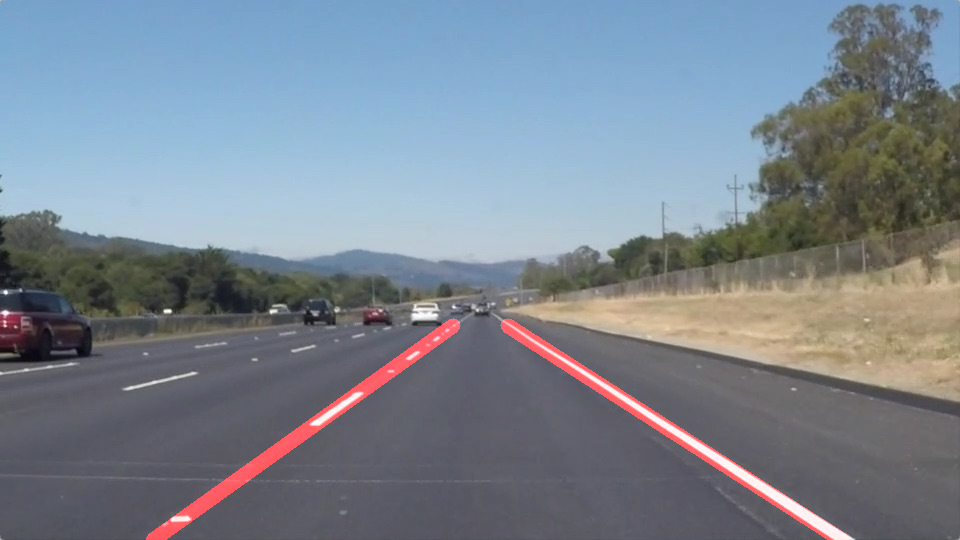
With the implemented pipeline, the lanes in the two provided clips have been reliably detected.
My pipeline consists of the following steps:
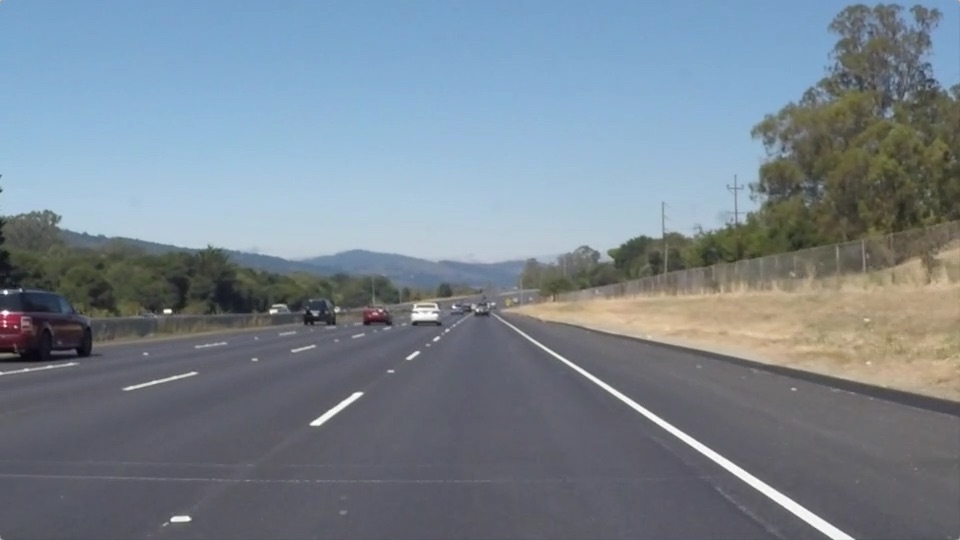
- Step 1 - Load color image
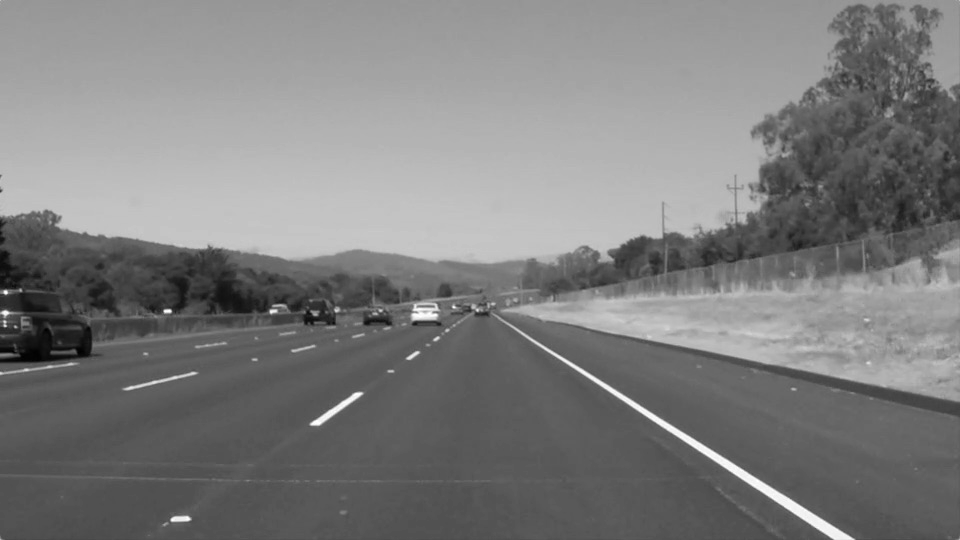
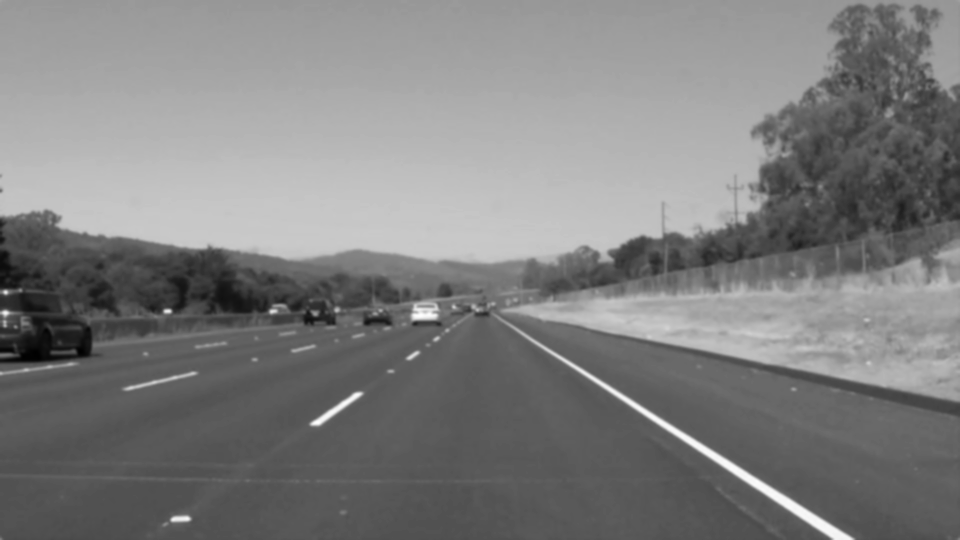
- Step 2 - Convert into grayscale image
- Step 3 - Apply blur filter
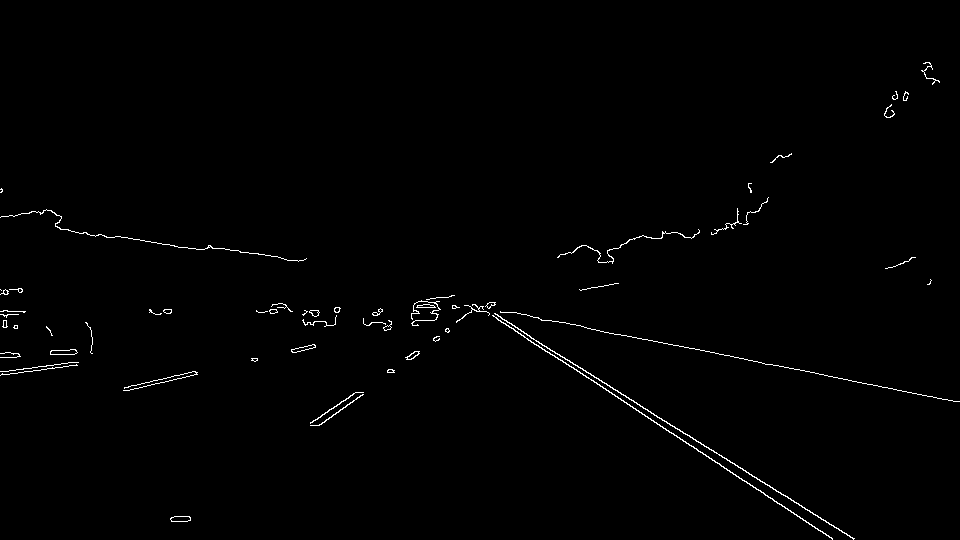
- Step 4 - Apply canny edge detection
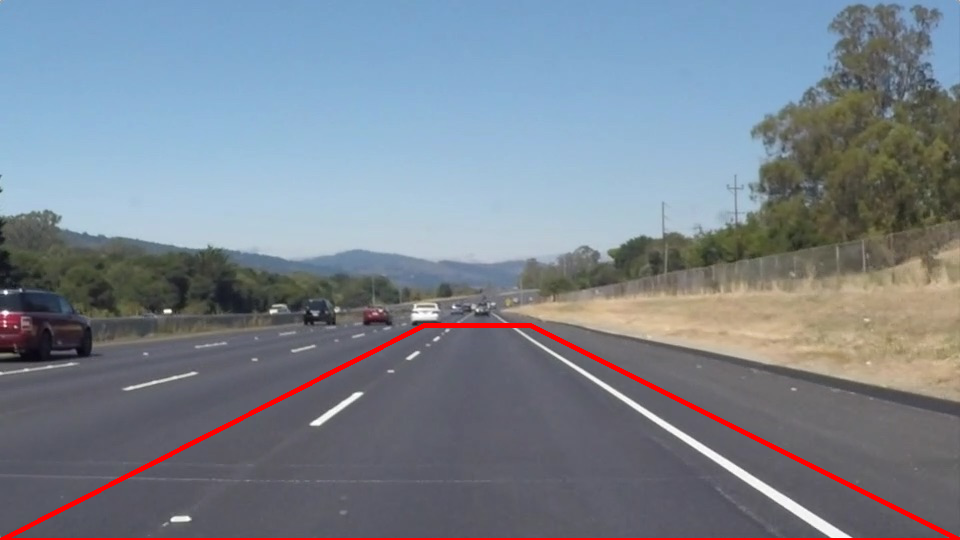
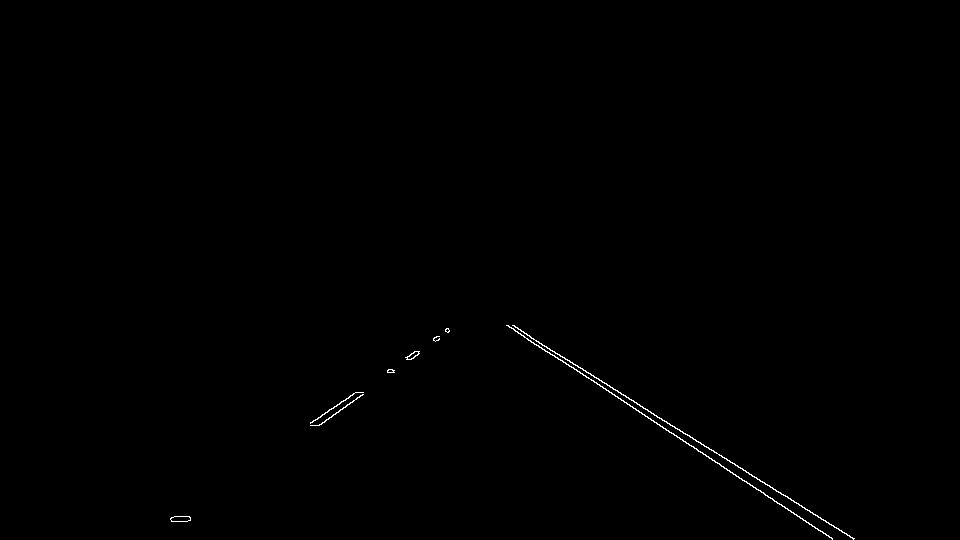
- Step 5 - Select region of interest
- Step 6 - Find lines using hough transform
- Step 7 - Separate lines into left and right, average and extrapolate them
First, the image is read with the mpimg.imread() function.
The original image is converted into grayscale with the cv2.cvtColor(img, cv2.COLOR_RGB2GRAY) function.
The image is blurred with the cv2.GaussianBlur(img, (kernel_size, kernel_size), 0) function to remove noise for a better canny edge performance.
For canny edge detection the cv2.Canny(img, low_threshold, high_threshold) function is applied. The threshold values are determined according to the recommendation in the lecture (low:high threshold ratio of 1:2 or 1:3 in range of tens to hundreds).
The region of interest is determined by the shape of the lanes in the images. The function cv2.fillPoly(mask, vertices, ignore_mask_color) sets the color in the region of interest to white. Finally the mask is used by cv2.bitwise_and(img, mask) to keep only the specified region of the image.
For finding lines, the probabilistic hough transform function cv2.HoughLinesP(img, rho, theta, threshold, np.array([]), minLineLength=min_line_len, maxLineGap=max_line_gap) is used. This function returns the extremes of the detected lines (instead of cv2.HoughLines())[OpenCV Documentation]. The relevant parameters are set by trial and error.
The function avg_extrapol(lines) draws one single line on the left and one on the right lane. It works as follows:
- Left and right lines are separated by their slope
- Slopes and offsets are averaged respectively
- The extremes of the two resulting lines are returned
import matplotlib.pyplot as plt
import matplotlib.image as mpimg
import numpy as np
import cv2
import os
from moviepy.editor import VideoFileClip
from IPython.display import HTML
- Only straight lines are detected with the applied hough transform -> curved lanes cannot be detected as curves
- Only intensity is considered using grayscale images -> colored lines are not detected under challenging light conditions
- Lines are jittering (not smooth over time)
- Use of higher degree polynomials for lane fitting to detect curves
- Use of a different color space for better performance (e.g. better detection of yellow lines)
- Use of lane history for smoother lanes and avoidance of frames without detected lines
- Improved parametrization (with a GUI for example)
