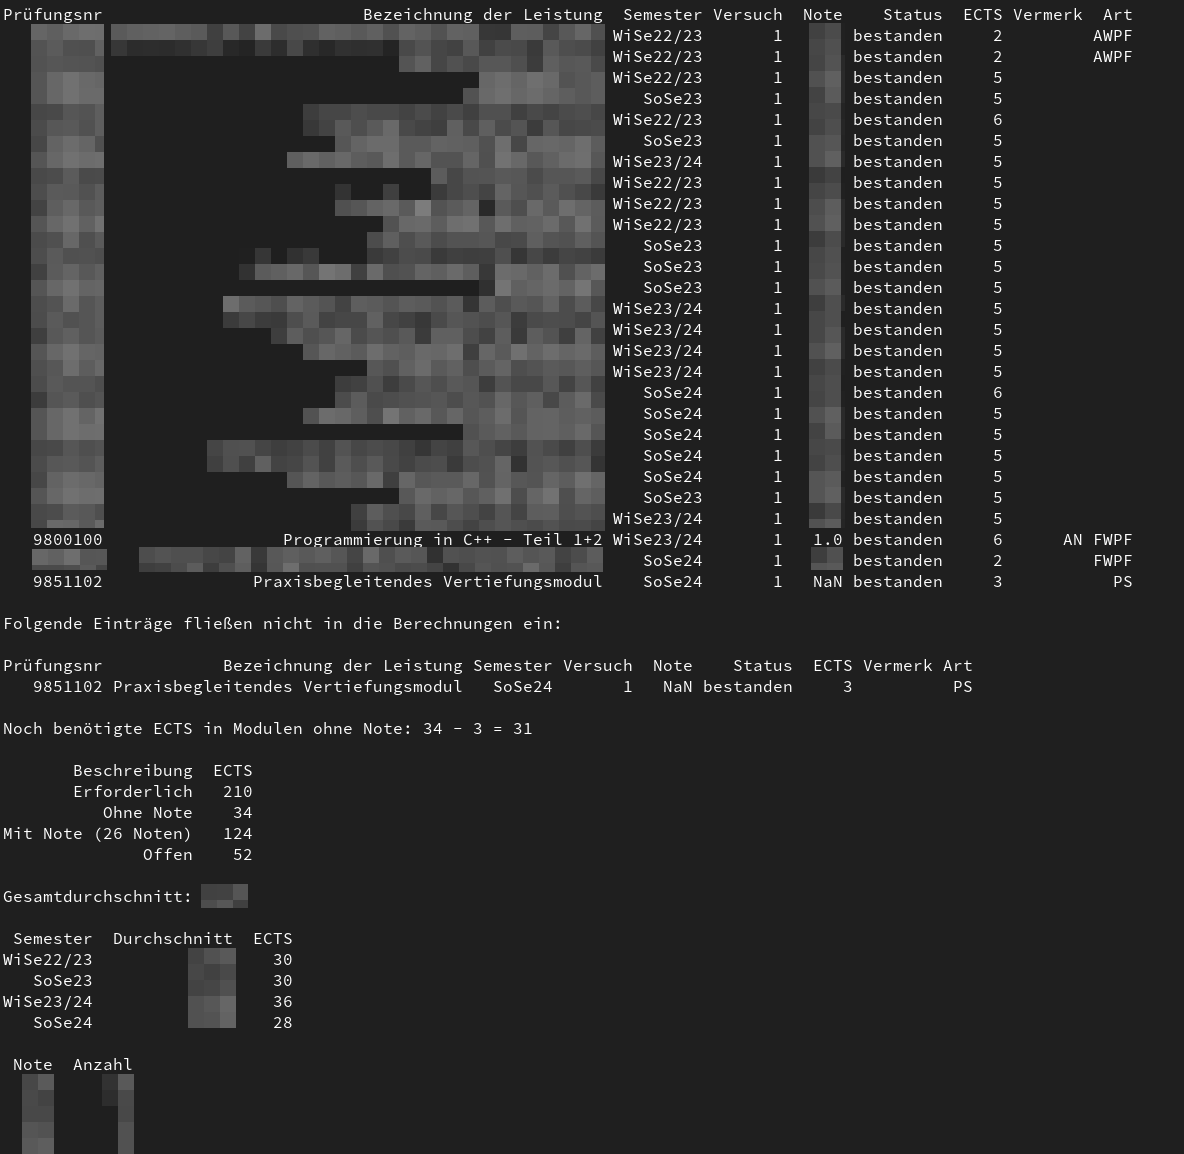
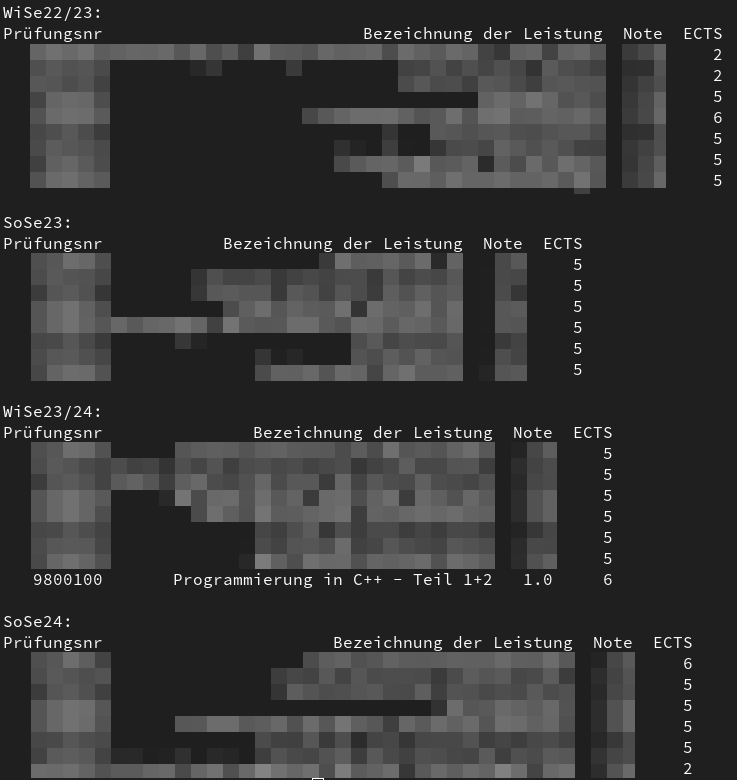
You don't feel like typing out your grades every time and analysing them in EXCEL? Then you've come to the right place.
Simple Python3 script, which provides information about the grade overview in the study programme.
Currently only the following PDF export is reliably supported:
Berichte als pdf-Files zum Download->Gesamtübersicht (ohne Bonuskonto)->Deutsch
The use of a PDF file or the processing of a CSV is supported. They only need to be structured as follows and must be in the folder of the Python script.
If you have any bugs, suggestions or feedback, feel free to create an issue describing what you'd like to see or create a Pull Request.
Must contain
abschlussin the file name!
The structure of the table in the PDF file must be as follows:
Please note that it will probably only work if it is a product of "HIS eG". You will find a note in the footer of the website:
Must be:
grades.csv
The structure must be as follows:
Prüfungsnr,Bezeichnung der Leistung,Semester,Versuch,Note,Status,ECTS,Vermerk,Art
9800100,Programmierung in C++ - Teil 1+2,WiSe23/24,1,1.0,bestanden,6,AN,FWPF
It works very reliably under Linux. I can't say for Windows. Python3 must be installed?
Clone the repository or download the corresponding release.
Install packages:
pip install pandas
pip install pdfplumberpython3 studi-grades.py -husage: studi-grades.py [-h] [--lang {de,en}] [--csv] [--pdf]
Process studi-grades from CSV or PDF files. The script must be executed in the folder in which the CSV or PDF is located!
options:
-h, --help show this help message and exit
--lang {de,en} Select language: 'de' for German, 'en' for English
--csv Use CSV file
--pdf Use PDF fileIf you execute the following, de is used as the default language and a PDF is read from the current directory.
python3 studi-grades.pyA suitable CSV file is automatically created that you can reuse.
When a PDF file is read in, you get an overview of all this at the very beginning. This is not the case when using a CSV file.
There are a few TODOs in the code that would certainly be good to implement.
It would also be really cool to maybe create graphs or something?


