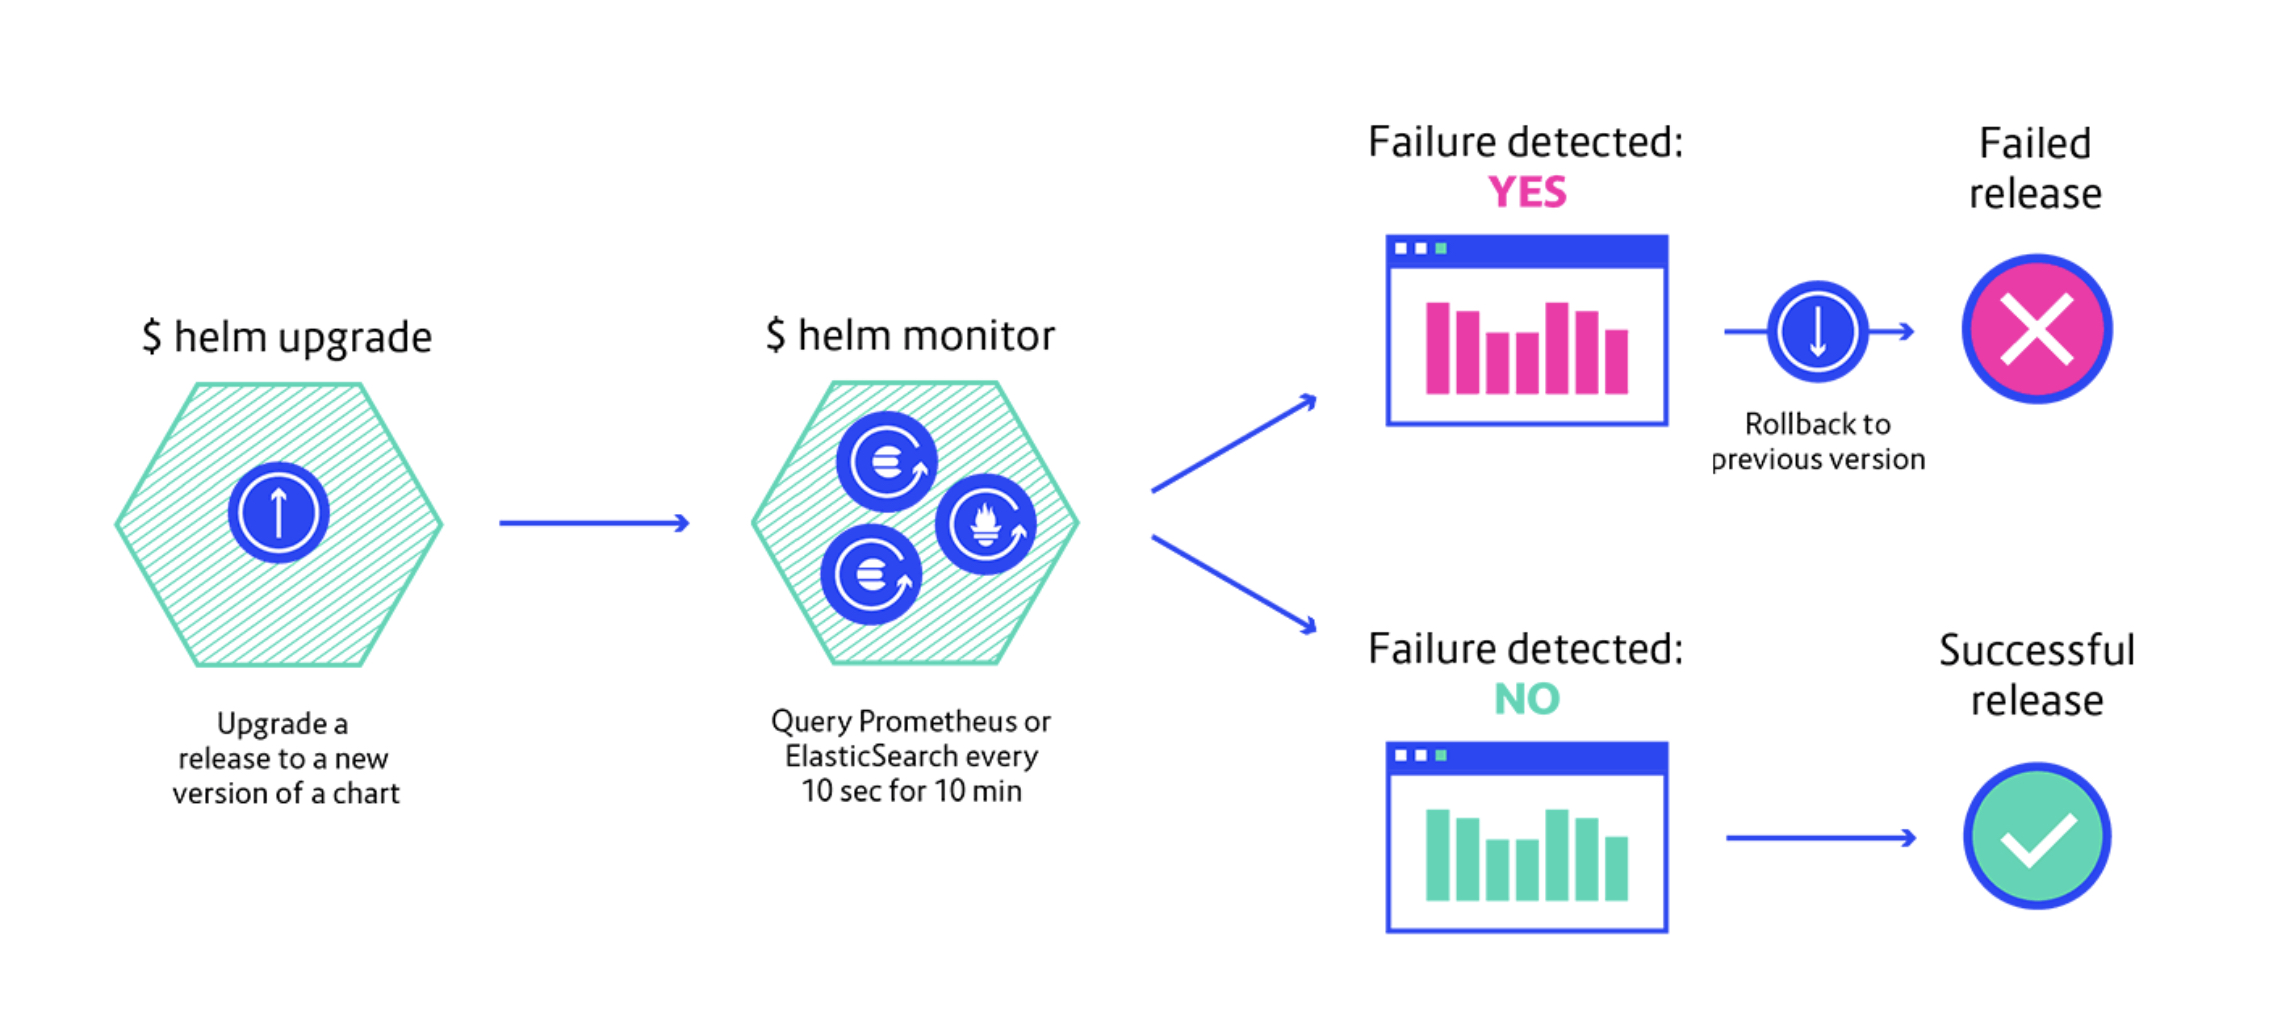
Monitor a release, rollback to a previous version depending on the result of a PromQL (Prometheus), events (Sentry), Lucene or DSL query (Elasticsearch).
$ helm plugin install https://github.com/ContainerSolutions/helm-monitorA rollback happen only if the number of result from the query is greater than 0.
You can find a step-by-step example in the ./examples directory.
Monitor the peeking-bunny release against a Prometheus server, a rollback is initiated if the 5xx error rate is over 0 as measured over the last 5 minutes.
$ helm monitor prometheus peeking-bunny 'rate(http_requests_total{code=~"^5.*$"}[5m]) > 0'You can connect to a given Prometheus instance, by default it will connect to http://localhost:9090.
$ helm monitor prometheus --prometheus=http://prometheus:9090 \
    peeking-bunny \
'rate(http_requests_total{code=~"^5.*$"}[5m]) > 0'Monitor the peeking-bunny release against an Elasticsearch server, a rollback is initiated if the 5xx error rate is over 0 for the last minute.
Using a Lucene query:
$ helm monitor elasticsearch peeking-bunny 'status:500 AND kubernetes.labels.app:app AND version:2.0.0'Using a query DSL file:
$ helm monitor elasticsearch peeking-bunny ./query.jsonYou can connect to a given Elasticsearch instance, by default it will connect to http://localhost:9200.
$ helm monitor elasticsearch --elasticsearch=http://elasticsearch:9200 \
    peeking-bunny \
'status:500 AND kubernetes.labels.app:app AND version:2.0.0'Monitor the peeking-bunny release against a Sentry server, a rollback is initiated if the number of events is over 0 for the release 2.0.0:
$ helm monitor sentry my-app \
    --api-key <SENTRY_API_KEY> \
    --organization sentry \
    --project my-project \
    --sentry http://sentry:9000 \
    --tag release=2.0.0 \
    --regexp
'Error with database connection.*'You can also use the Helm monitor backed Docker image to monitor:
$ docker run -ti -v $HOME/.kube:/root/.kube containersol/helm-monitor \
    monitor prometheus --prometheus=http://prometheus:9090 my-release \
'rate(http_requests_total{code=~"^5.*$"}[5m]) > 0'Require Go >= 1.11.
# Clone the repo, then add a symlink to the Helm plugin directory:
$ ln -s $GOPATH/src/github.com/ContainerSolutions/helm-monitor ~/.helm/plugins/helm-monitor

# Build:
$ GOPATH="" GO111MODULE=on go build -o helm-monitor ./cmd/...

# Run:
$ helm monitor elasticsearch my-release ./examples/elasticsearch-query.json- Kuberbs - Kubernetes Automatic Rollback System

