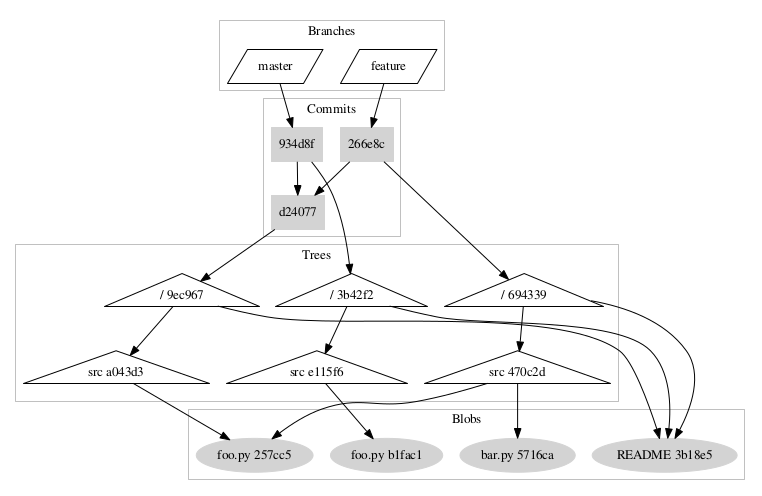
This tool is used to generate the object graph of a Git repository. It can help Git learners better understand the Git data model through visualization. You can experiment with various git operations (e.g., add/delete/edit files or directories, merge branches, etc), commit, then run this tool to see what happened to the data in the .git directory under the hood.
Requirements: Python 3.5+, graphviz (OS package and Python package)
Usage: python3.5 git-graph.py [git-repo-path]
Sample output:
References on Git internals: