Note
This integration only provides data for locations in the United States.
-
Navigate to the HACS add-on. Go to "Integrations", if HACS has separate pages for Integrations and Frontend.
-
Via the "..." menu at the top right, select "Custom repositories" and add https://github.com/davidn/epa_uvindex as type "Integration".
-
If there is a "Explore & download respositories" button, click on and find the "EPA UV Index" integration. If you directly see a list of integrations, find the "EPA UV Index" integration (you may need to clear filters to see integrations that haven't been downloaded). Click on the integration and then click "Download".
-
Restart Home Assitant.
-
Go to Settings > Devices & Services, and on the Integration tab click "Add Integration". Select "EPA UV Index"
-
Enter the nearest city and state.
You will now have a sensor that provides the UV Index in that city.
-
Copy all files to
config/custom_components. -
Restart Home Assistant.
-
Go to Settings > Devices & Services, and on the Integration tab click "Add Integration". Select "EPA UV Index"
-
Enter the nearest city and state.
You will now have a sensor that provides the UV Index in that city.
The gauge screenshot above is from the following dashboard card:
type: gauge
    entity: sensor.uv_index
    segments:
      - from: 0
        color: '#299501'
      - from: 3
        color: '#f7e401'
      - from: 6
        color: '#f95901'
      - from: 8
        color: '#d90011'
      - from: 11
        color: '#6c49C9'
    min: 1
    max: 12
    needle: true
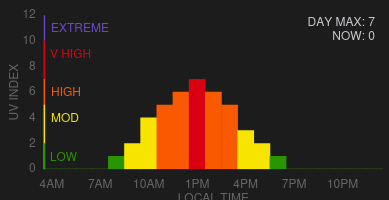
The hourly card is can be found at https://github.com/davidn/uvindex-hourly.
This integration provides a single sensor called sensor.uv_index. The value of the sensor is the max UV index for the current day. The sensor also has a forecast attribute that provides hourly UV index predictions. This attribute is an array of dicts, each dict having a datetime and a uv_index entry with the time and UV index for that prediction. This comes directly from the EPA source, which currently provides a prediction for a sensible range of hours, on the hour, but could potentially change.
If you want a separate sensor with the current UV index, create a template sensor using the following template:
{% for forecast in state_attr("sensor.uv_index", "forecast") %}
  {% if forecast.datetime | as_local >= now() %}
    {{ forecast.uv_index }}
    {% break %}
  {% endif %}
{% endfor %}

