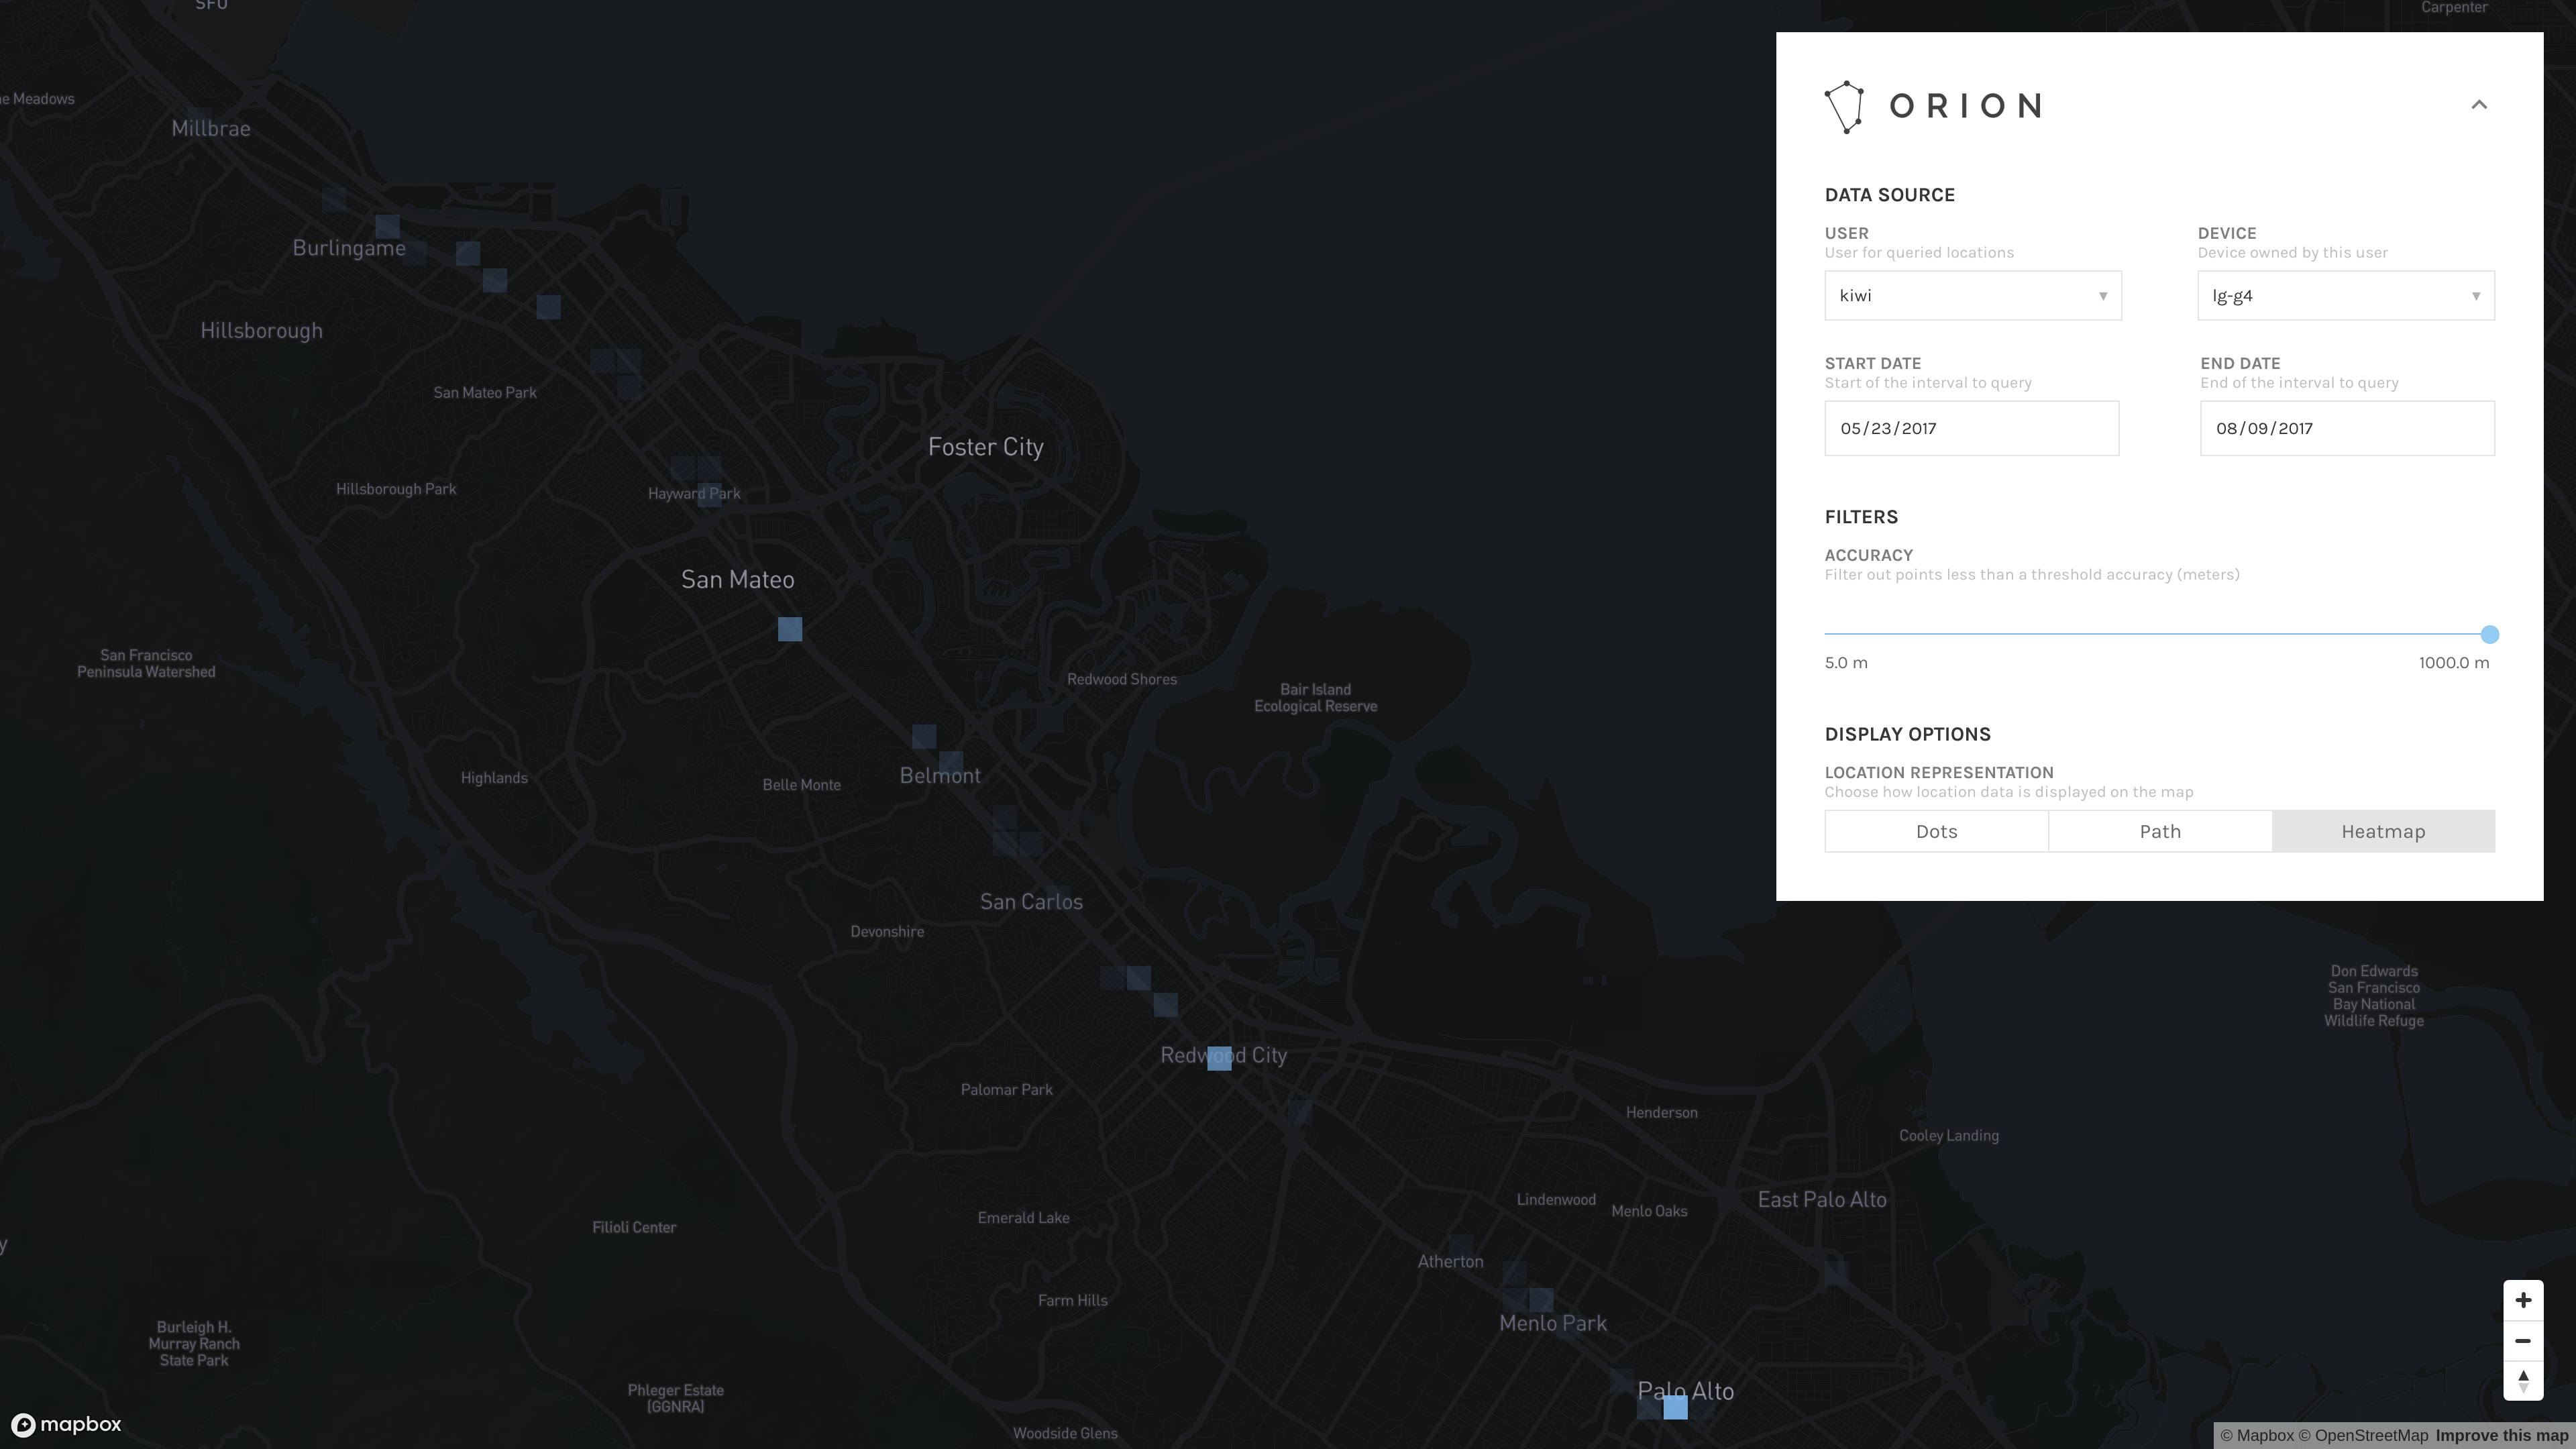
orion-web is a web visualization frontend designed to accompany orion-server.
Live demo using sample location data
The Orion platform consists of orion-server and orion-web. The former is a server-side application for recording location events reported by OwnTracks mobile clients. The latter is a web application for visualizing data collected by orion-server.
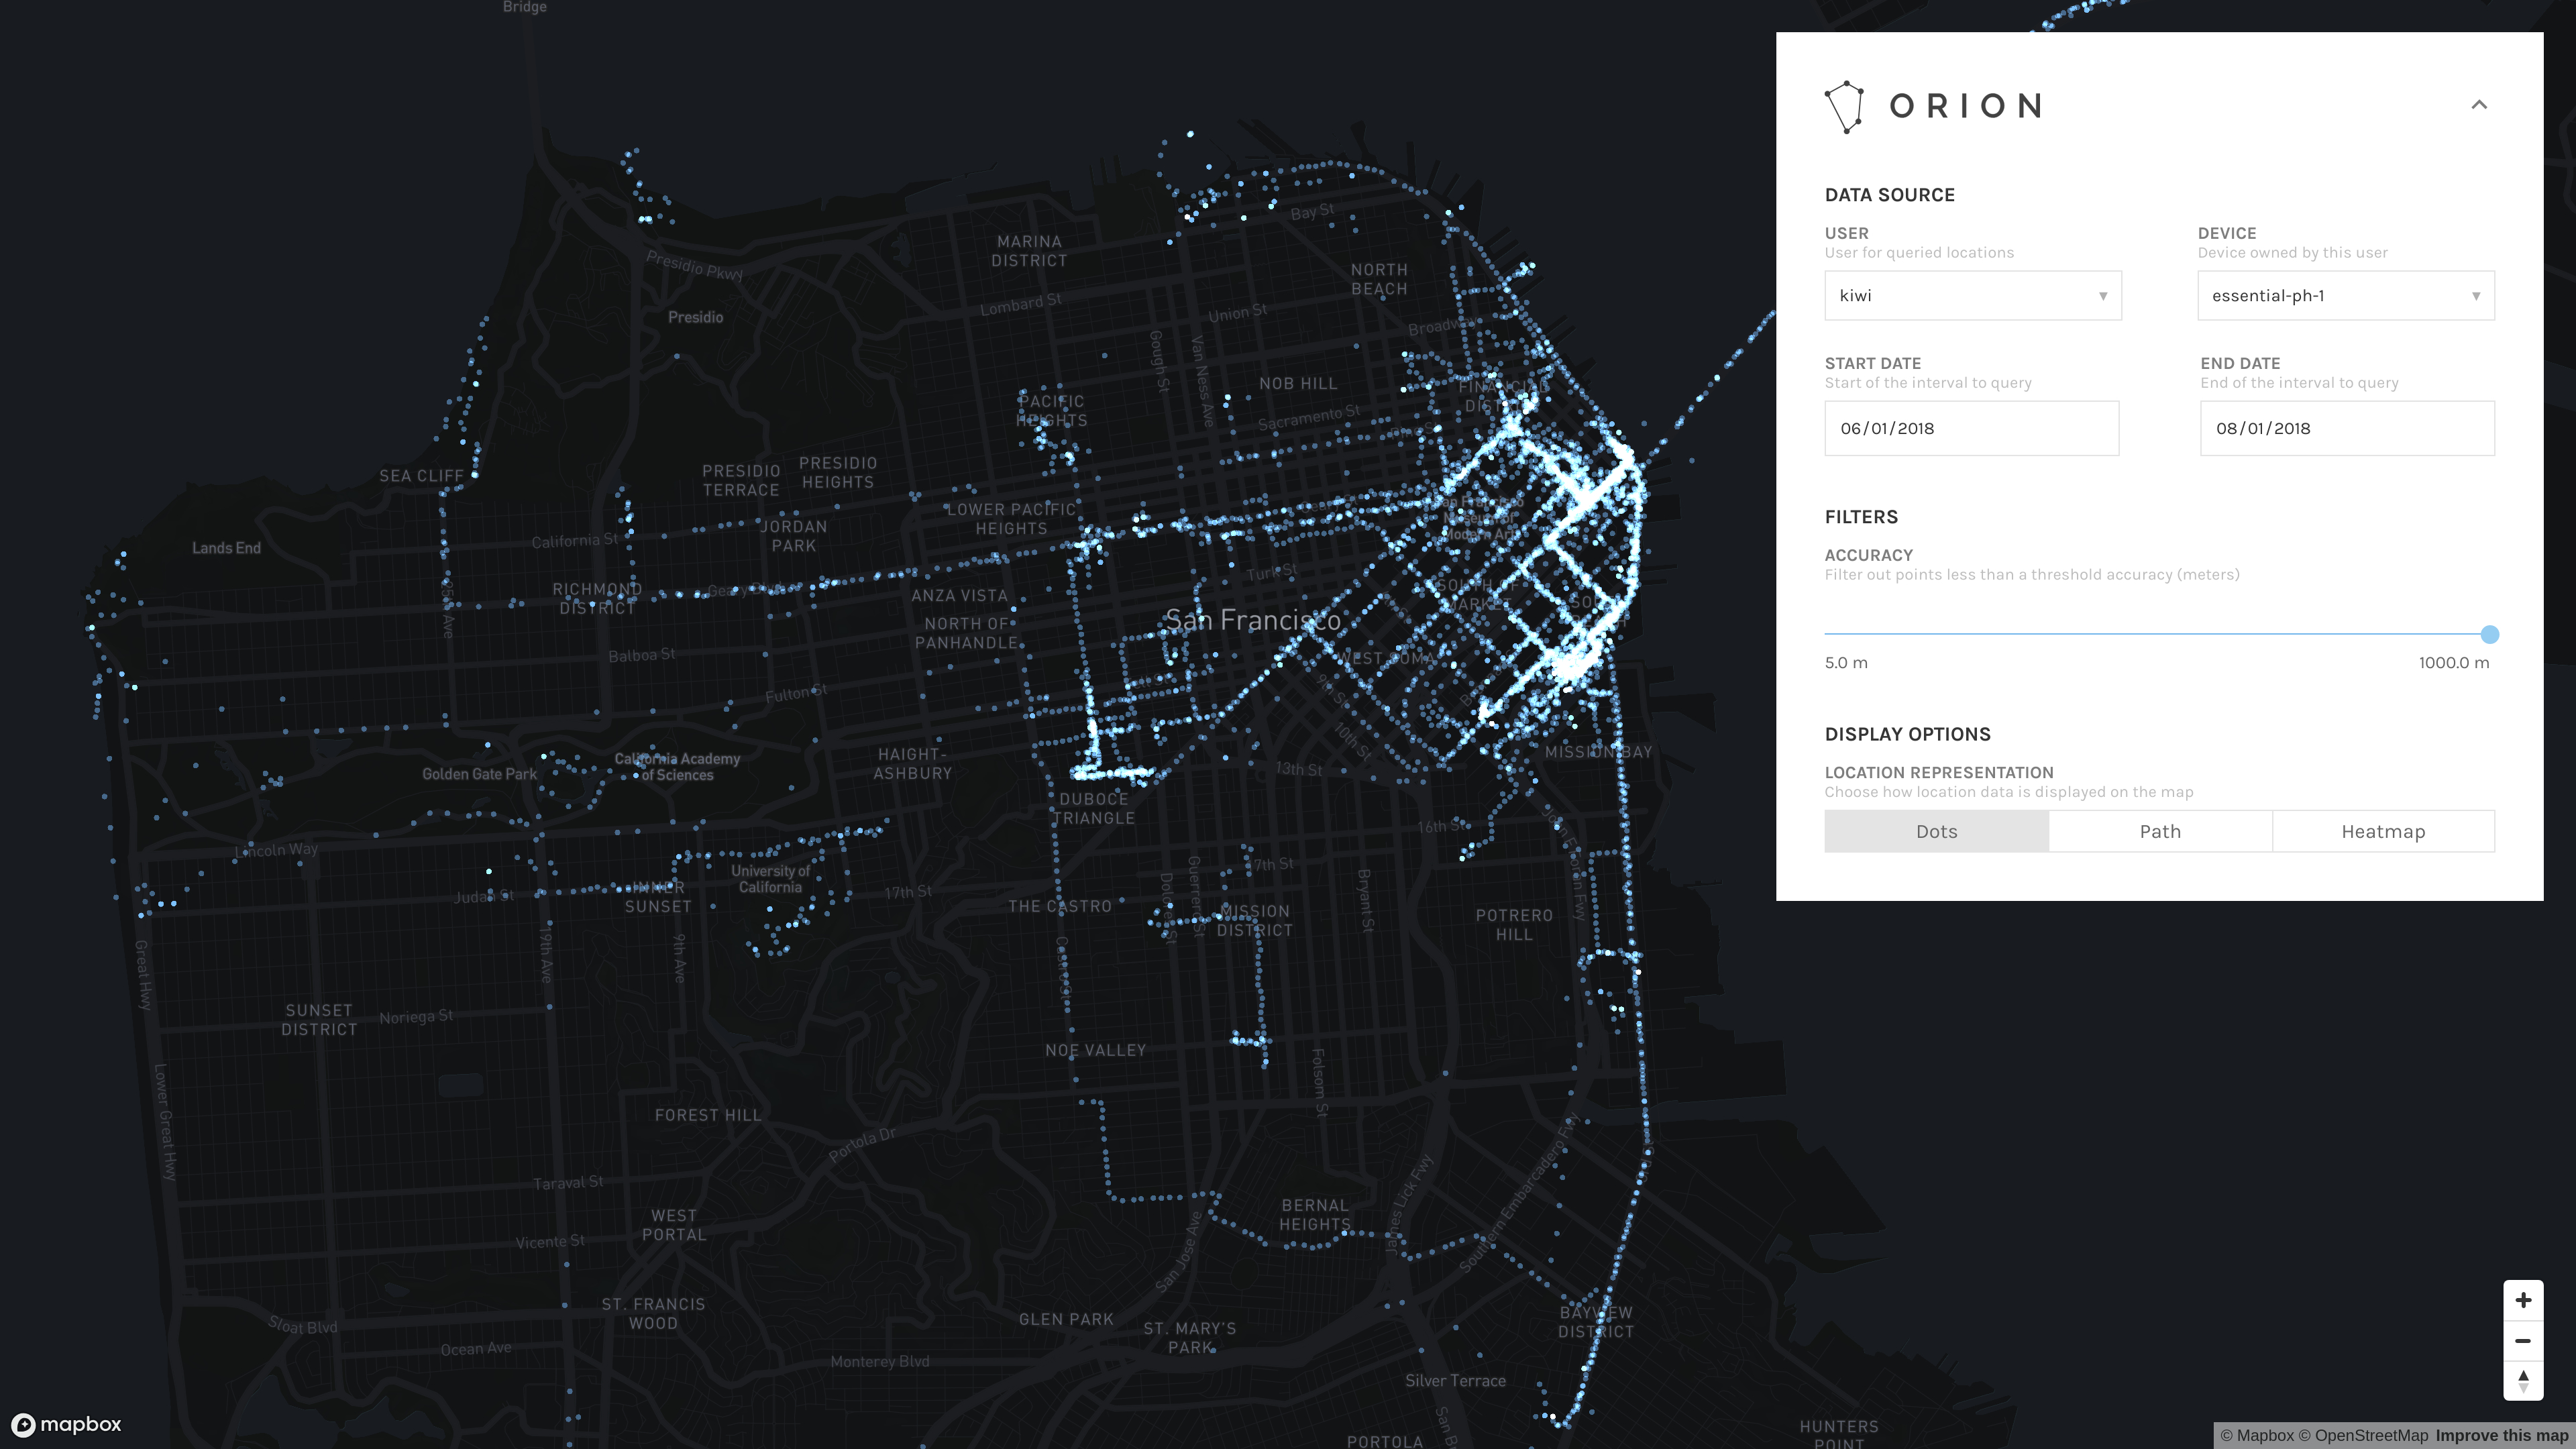
The web interface builds on the functionality provided by the official OwnTracks Recorder, providing more control over how data points are visualized on a map.
- View data recorded for any user/device combination
- Filter points based on a time interval
- Filter points below an interactively specified accuracy
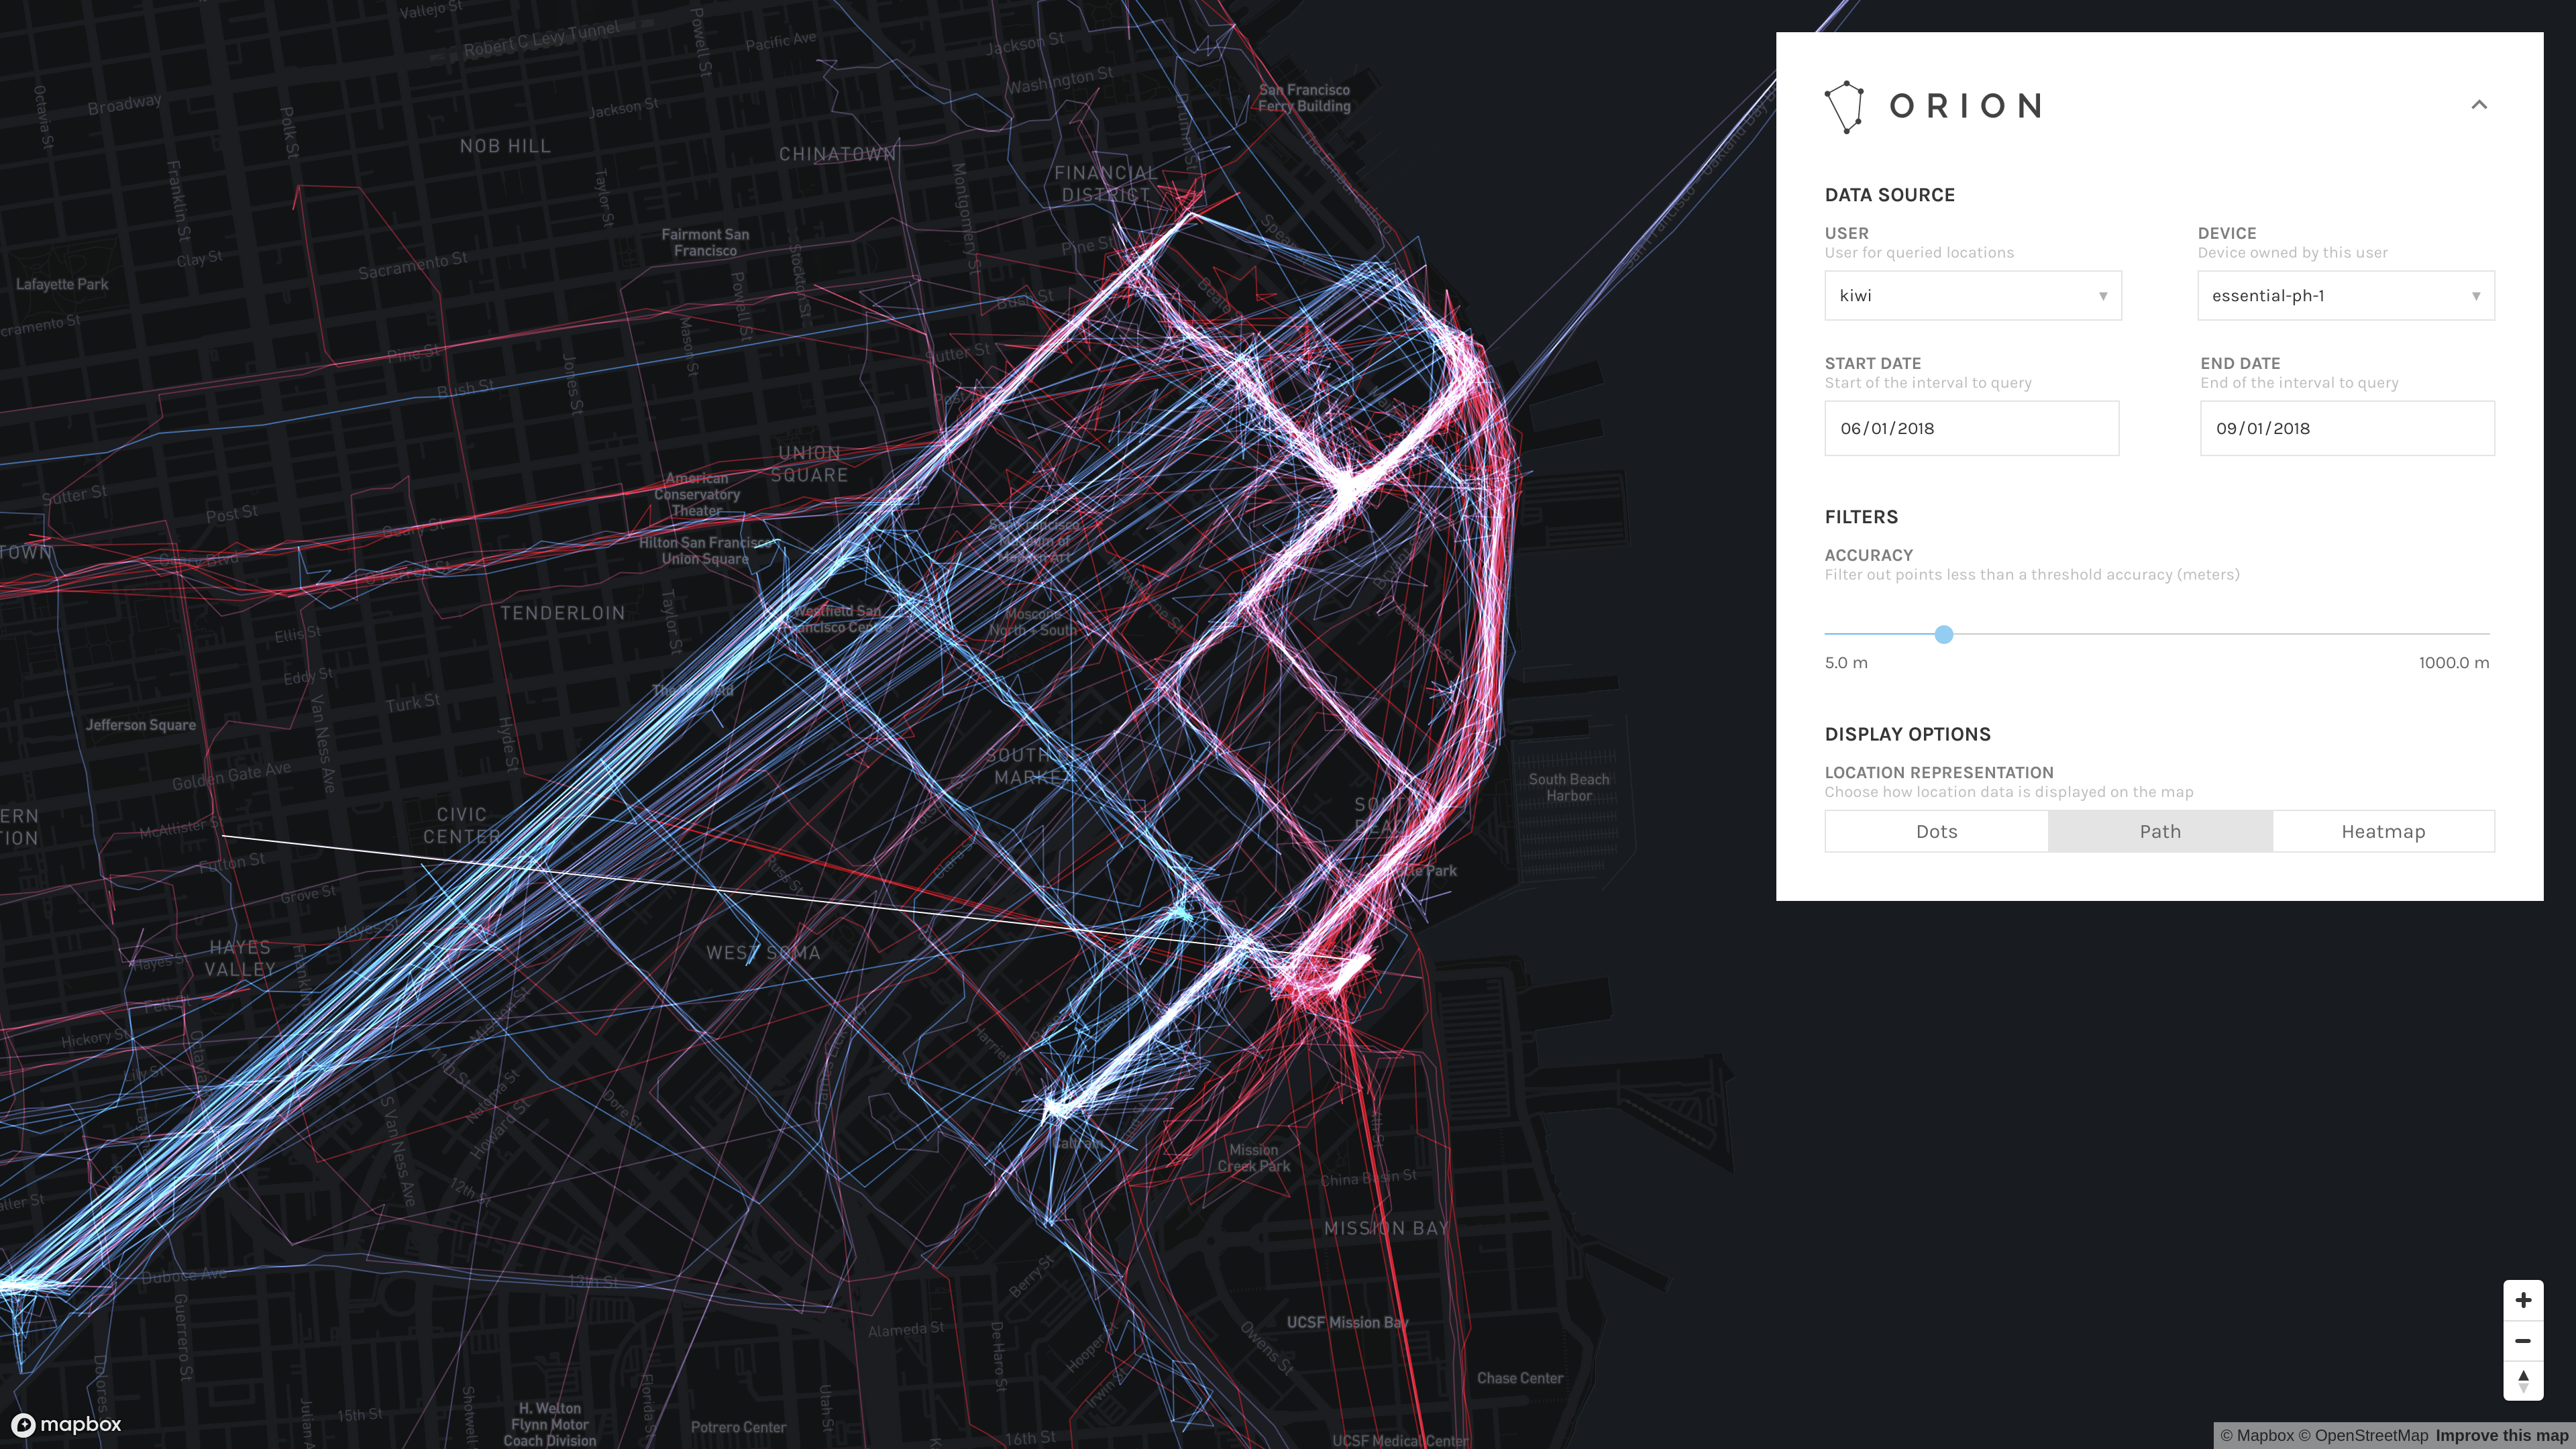
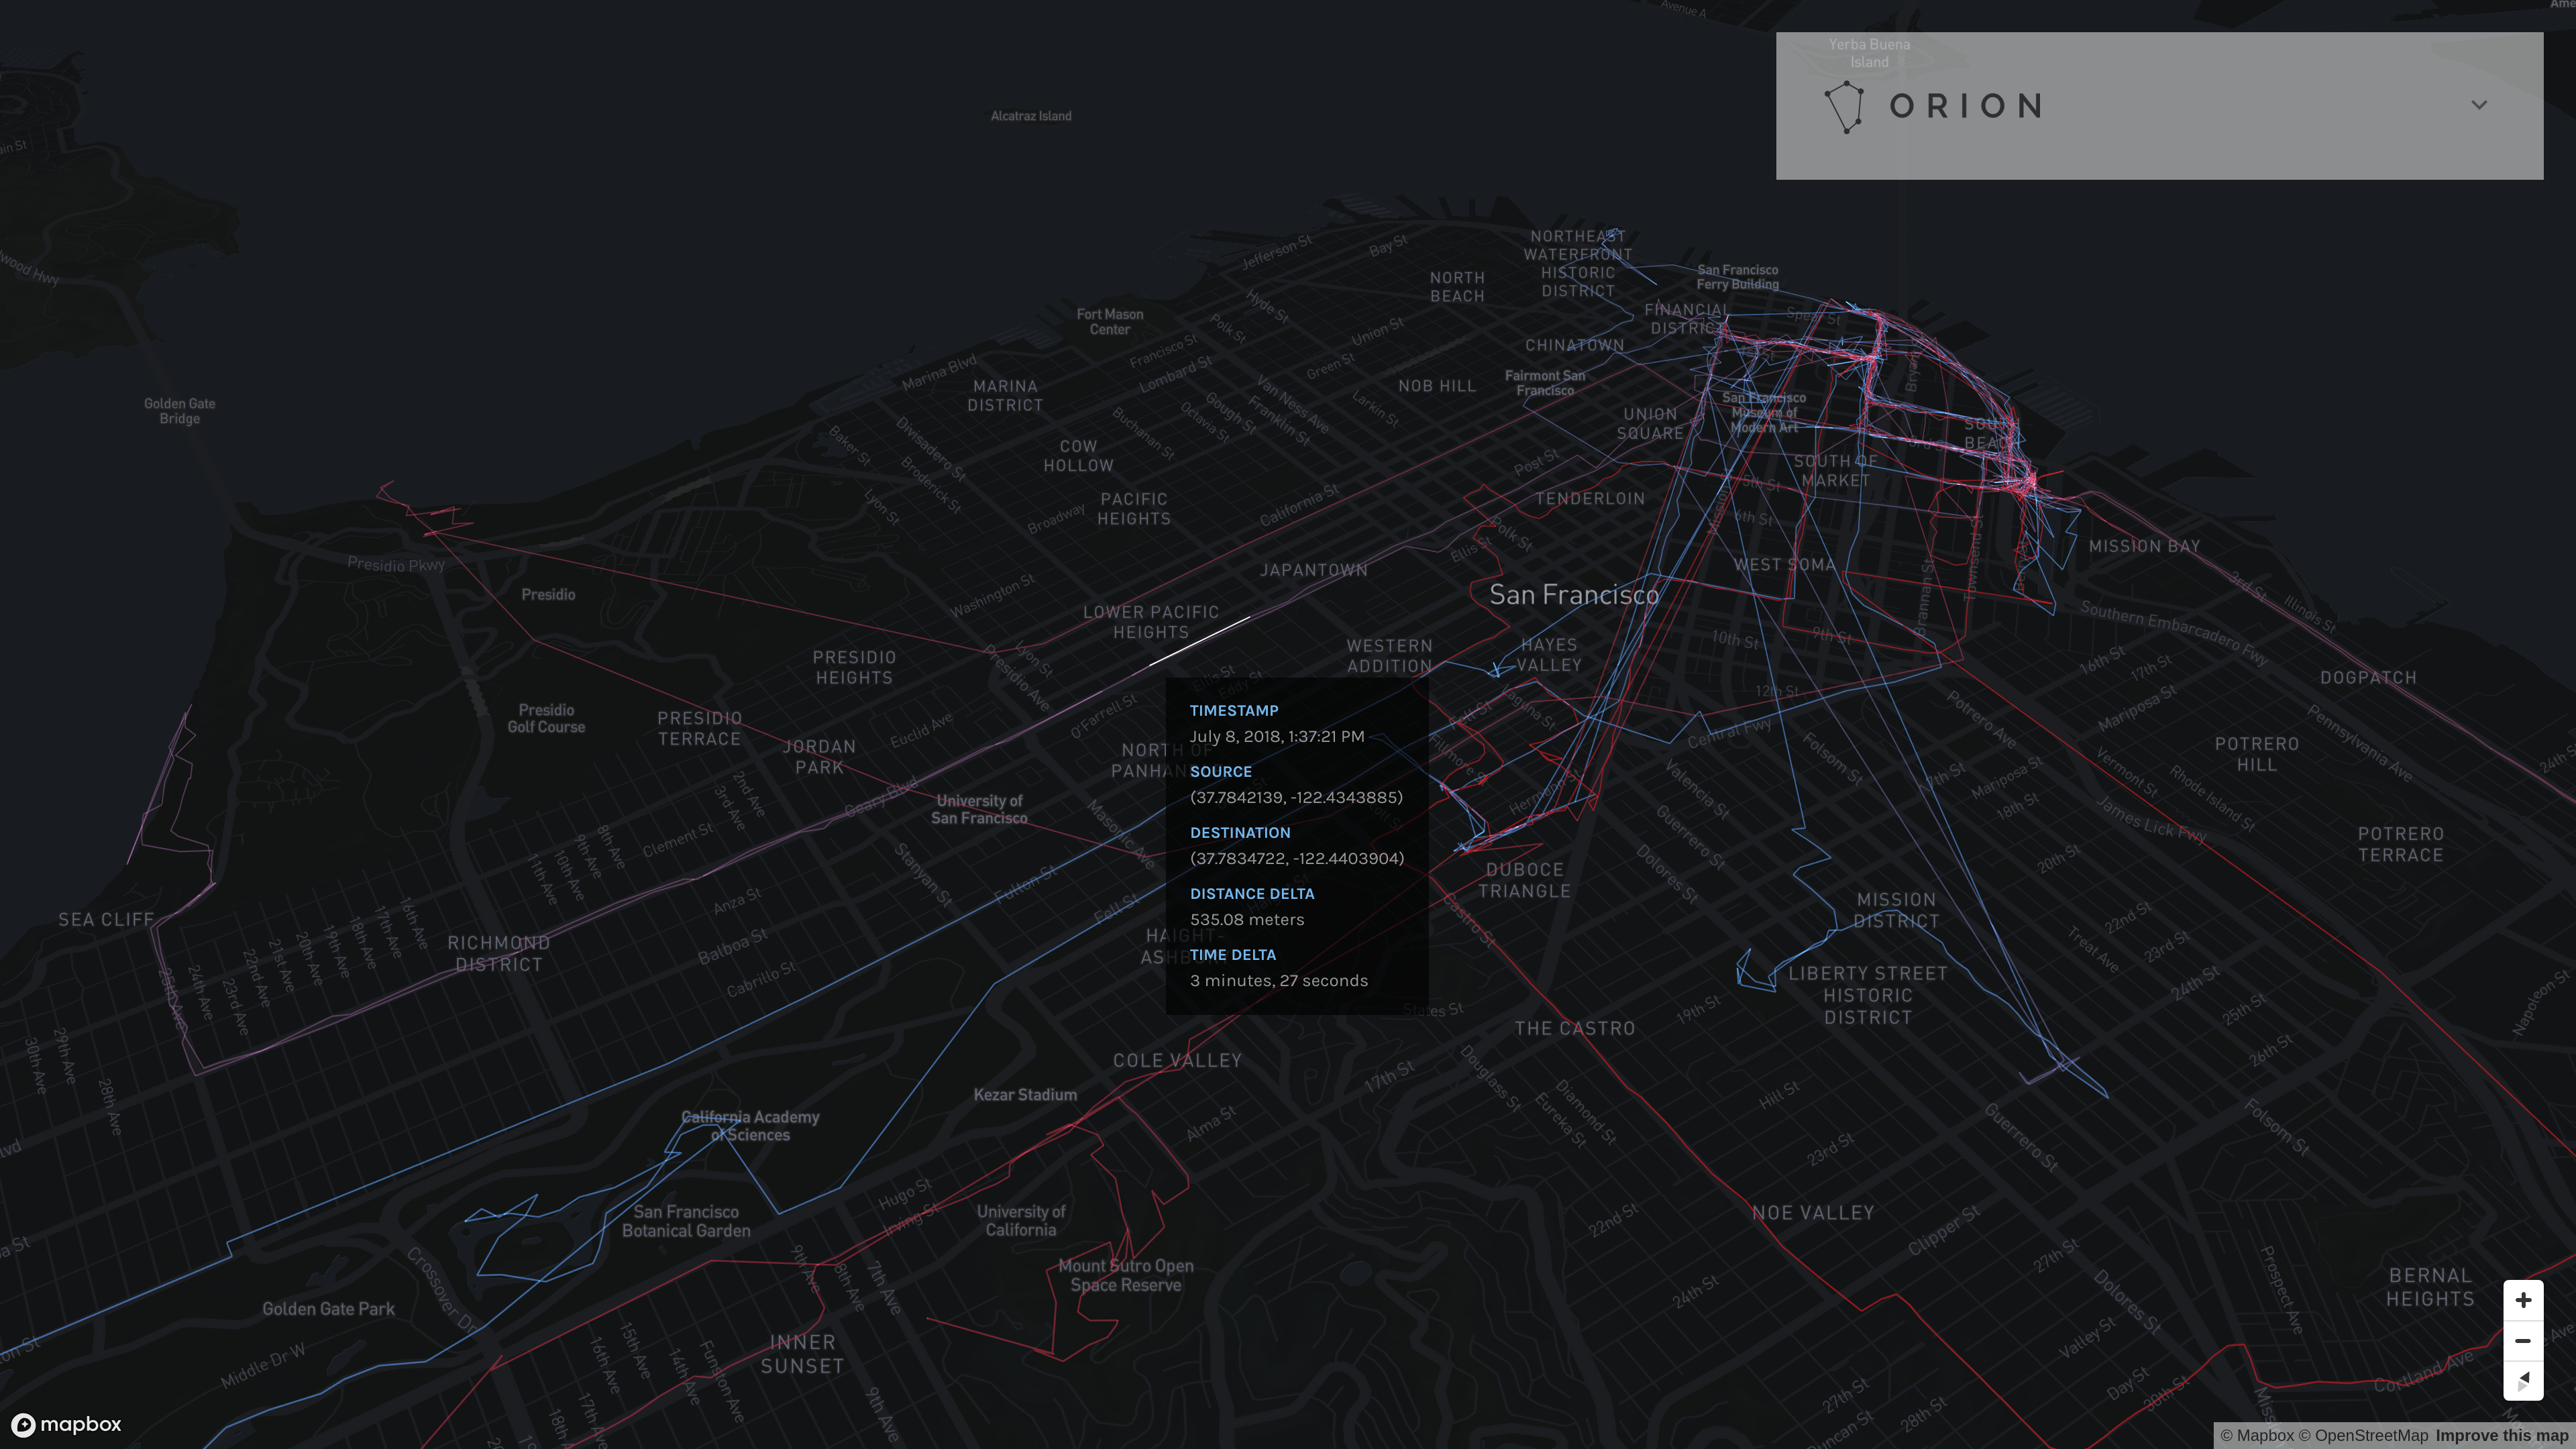
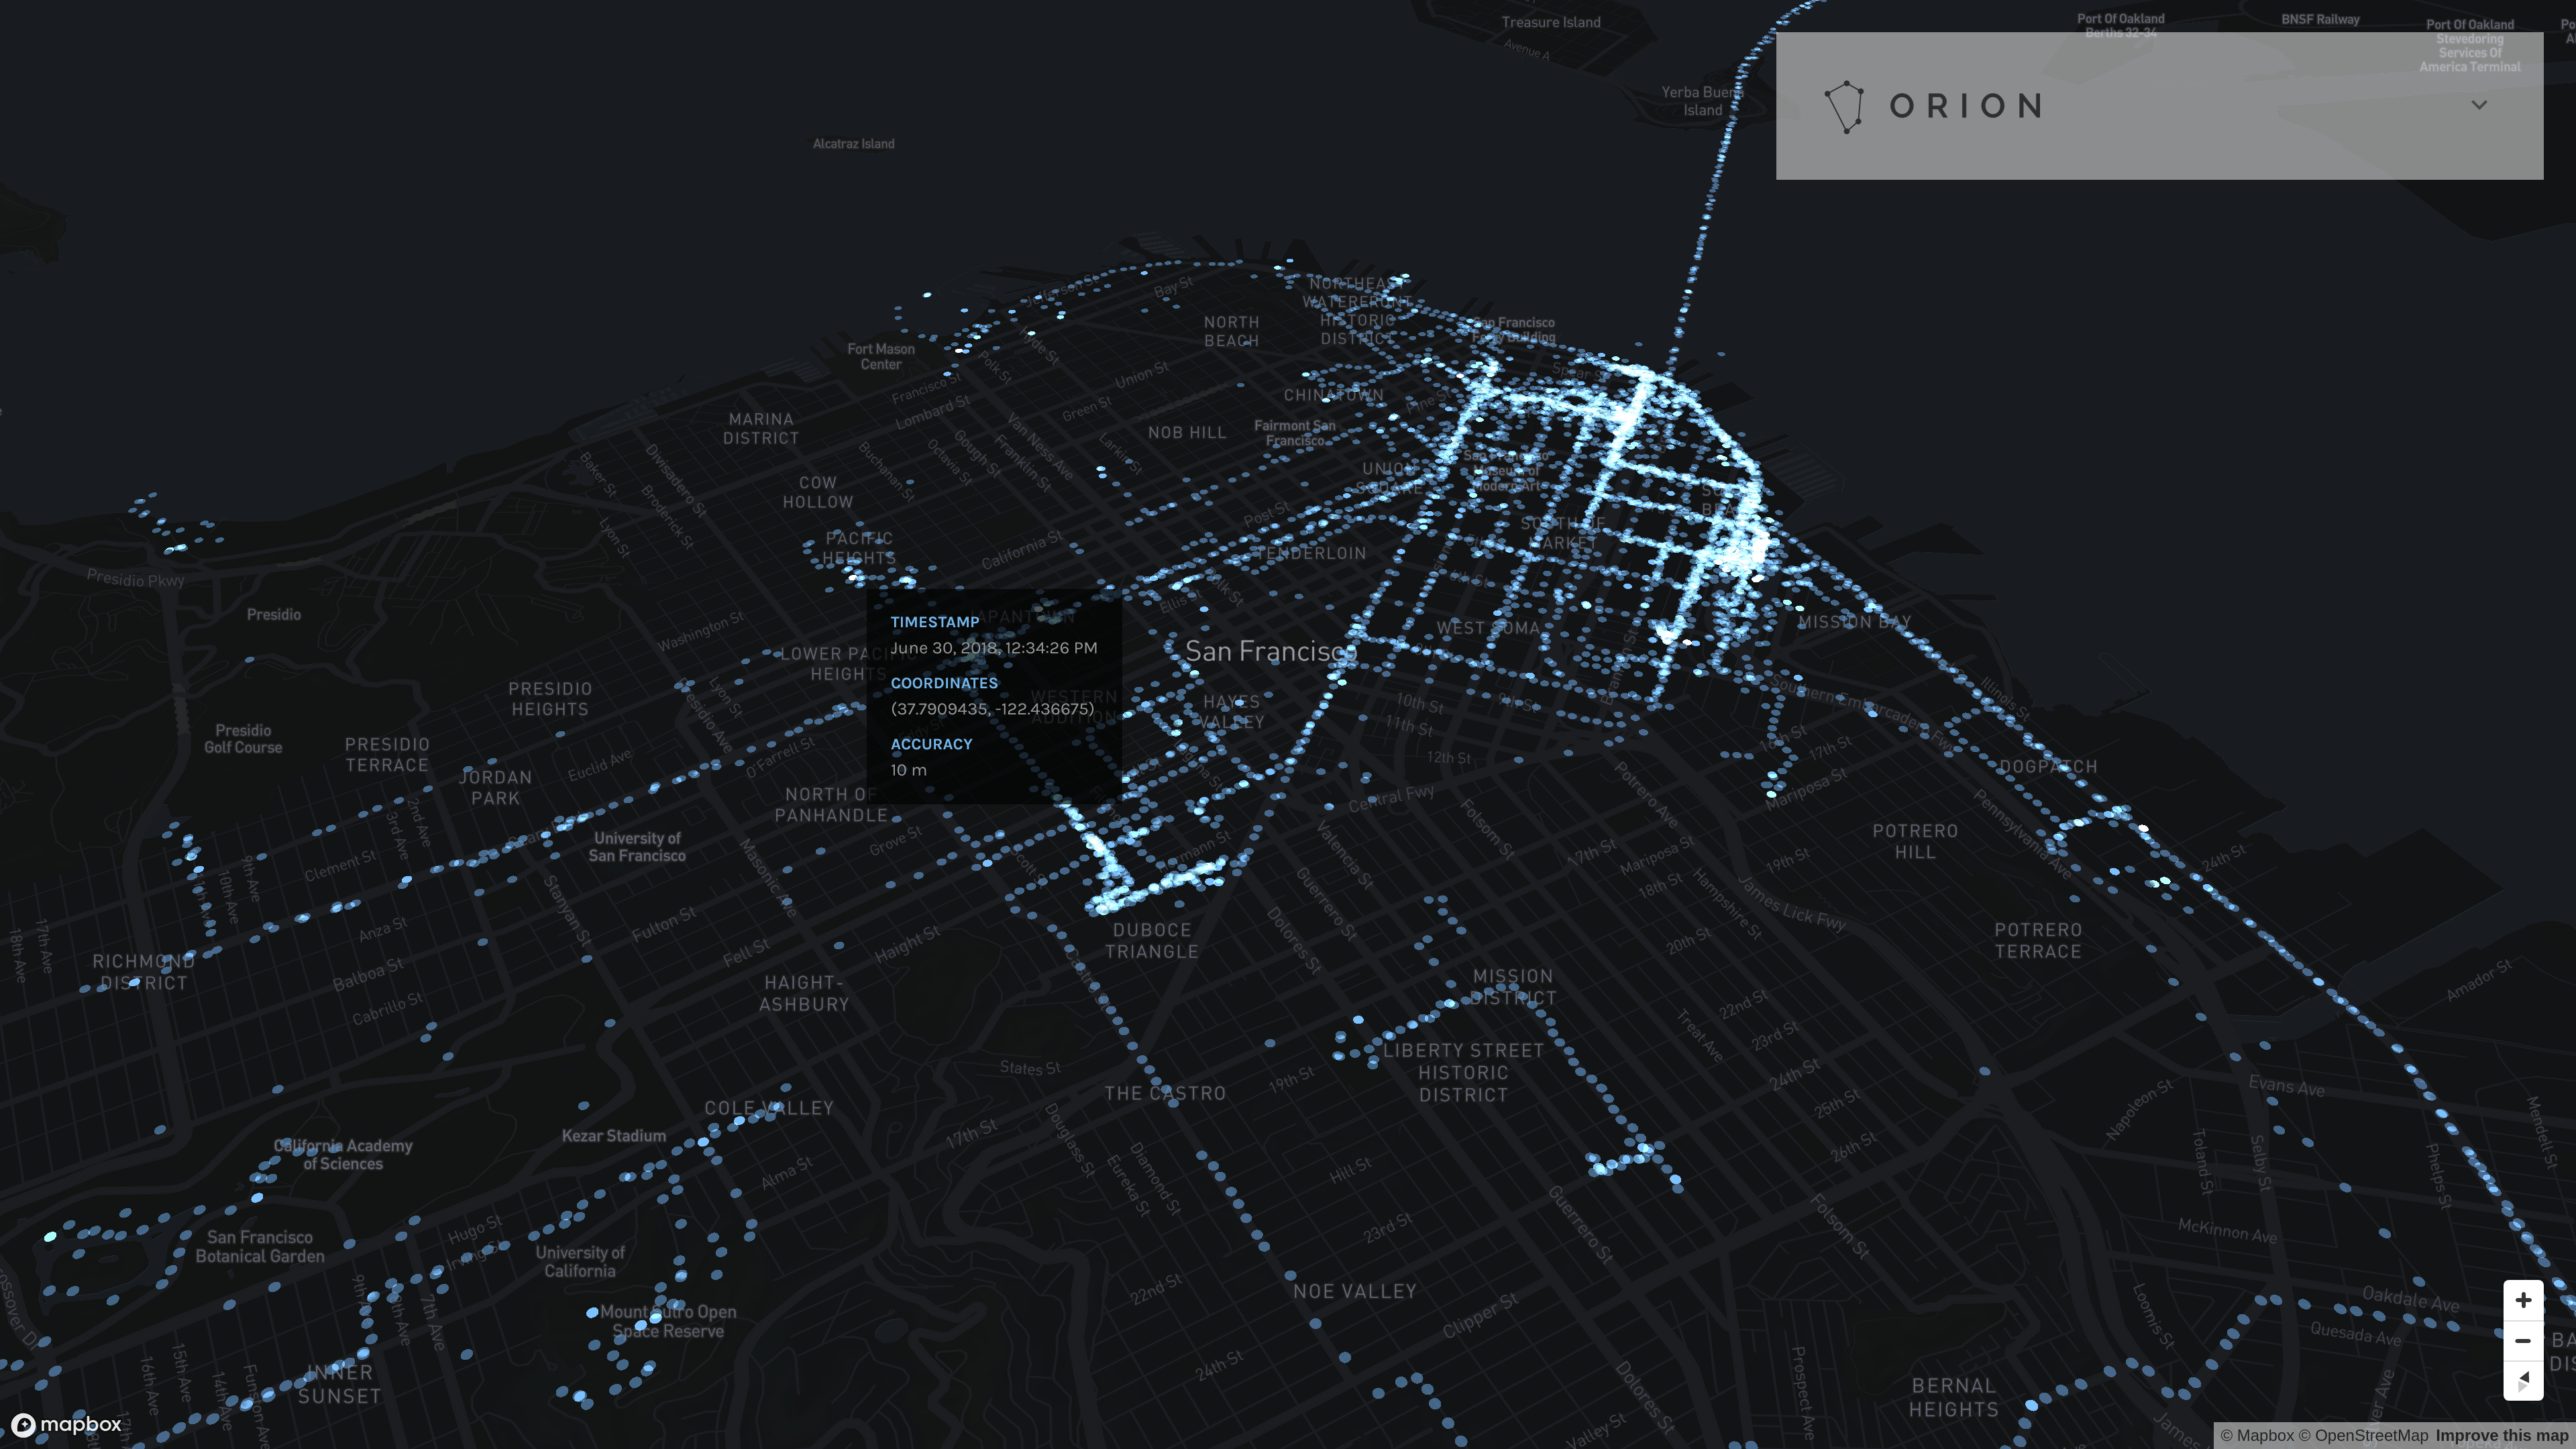
- Display points as dots (raw reported locations), a path (time-weighted travel path between location reports), or a heatmap (spatially-weighted density of location reports)
You'll need a node runtime, npm, and a working deployment of orion-server. Follow the instructions at the Node.js website on how to get the first two set up for your platform.
First and foremost, create a Mapbox API token for your deployment.* This is used to render the interactive map.
Get the source code and bootstrap the application:
$ git clone https://github.com/LINKIWI/orion-web.git
$ cd orion-web
$ npm install
Build the frontend. If orion-web will run at the same URL as orion-server, you should omit ORION_SERVER_URL. Otherwise, set ORION_SERVER_URL to the base URL where orion-server is running (e.g. http://orion.example.com).
$ NODE_ENV=production MAPBOX_API_TOKEN=<your Mapbox API token> ORION_SERVER_URL=<base URL where the server is hosted> npm run buildThat's it! This produces a completely self-contained static frontend file at dist/index.html. You can deploy this however you see fit. For example, if you followed the deployment instructions in the README for orion-server, you can use an Alias directive to map all non-API routes for the Orion virtual host to this static file.
* While I am not in any position to provide official legal advice, you should review and agree to the terms of service set forth by Mapbox before creating and using an API key.
Dots mode displays all reported locations matching the filtering criteria as constant-sized dots on the map.
Path mode displays a time-sequential travel path from point to point, connecting points if one follows directly after the other in time.
The path colors are time-weighted on a gradient between 100% red and 100% blue based on all location data points selected given the current filter options (namely, the time interval and accuracy filter). The earliest points (by timestamp) are red. The latest points (by timestamp) are blue. Intermediary points are a combination of red and blue based on the ratio of the distance to the earliest timestamp to the total number of seconds contained within the time interval of eligible data points.
Heatmap mode displays locations as a 2D histogram. Areas containing a high density of points are colored with the most opaqueness; areas containing the lowest density of points are colored with the least opaqueness (as far as fully transparent if no locations are reported in that area).
The range of opacity is scaled based on the points that are currently visible in the viewport. If you spend a lot of time in a single area, you might only see a single, opaque square. You might be able to see a greater diversity of opacities if you move the map such that that single location is outside of the viewport.

