PulSync: The Heart Rate Variability as a Unique Fingerprint for the Alignment of Sensor Data Across Multiple Wearable Devices
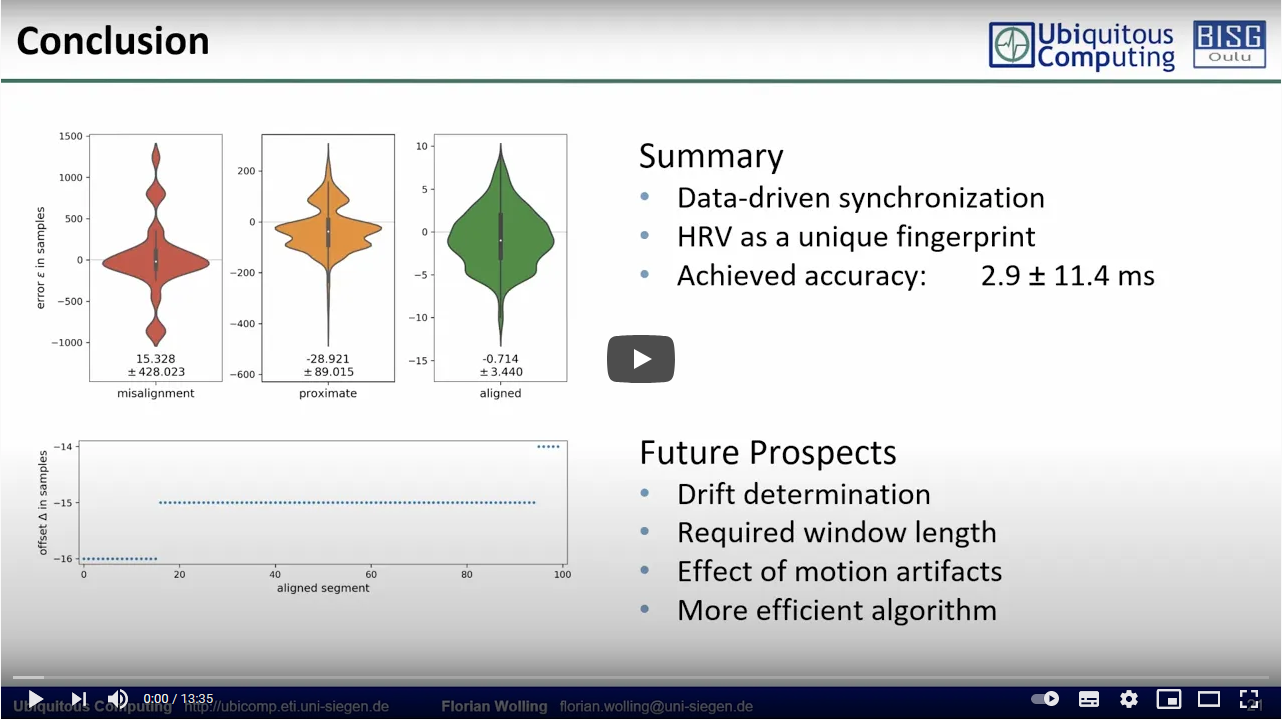
In this GitHub repository, we present PulSync, a tool for the data-driven offline alignment of sensor data across multiple devices utilizing the unique fingerprint-like character of the heart rate variability (HRV) interval function. The accuracy of the novel method has been evaluated on a dataset from 25 subjects [1] and demonstrated the reliable alignment of independent electrocardiography (ECG) recordings with a mean accuracy of -0.71 ± 3.44 samples, respectively -2.86 ± 11.43 ms at 250 Hz sampling rate. The implemented Python tool is available for download, to support the reproducibility as well as the alignment of datasets from unsynchronized in-the-wild recordings. The Jupyter notebook demonstrates the use of the PulSync Python tool on the example of the ECG recordings and R peak labels from subject 23, exemplarily prepared as a Pickle file.
"PulSync: The Heart Rate Variability as a Unique Fingerprint for the Alignment of Sensor Data Across Multiple Wearable Devices", Florian Wolling, Kristof Van Laerhoven, Pekka Siirtola, and Juha Röning. In PerHealth 2021: 5th IEEE PerCom Workshop on Pervasive Health Technologies (PerHealth 2021), Virtual Event, IEEE, March 2021.
You may use the source code of the developed synchronization tool PulSync for scientific, non-commercial purposes, provided that you give credit to the owners when publishing any work based on it. We would also be very interested to hear back from you if you use our tool or alignment method in any way and are happy to answer any questions or address any remarks related to it.
The 1-minute teaser for the PerHealth'21 workshop can be found on YouTube.
The full 15-minute presentation for the PerHealth'21 workshop can be found on YouTube, as well.
The PulSync processing pipeline has been evaluated using the dataset 716 of Howell and Porr from the University of Glasgow [1]. It contains ECG measurements from 25 subjects, recorded with two independent, pretended synchronous sensing devices in Einthoven II and resembled V2-V1 lead configurations. The "sitting" subset contains manually annotated peak labels with a precision of ±1 sample. Those were used to generate the heart rate variability (HRV) interval functions that are utilized to align the recordings.
The evaluation of the data-driven alignment method PulSync resulted in a promising accuracy of -0.71 ± 3.44 samples, respectively -2.86 ± 11.43 ms at a sampling rate of 250 Hz and with the HRV interval functions resampled at 25 Hz. The initial misalignment of the original recordings was determined with a mean of 15.328 ± 428.023 samples, 0.061 ± 1.712 s respectively. The smallest initial misalignment was present in the recordings of subject 5 with 0.038 s, while subject 19 showed the largest offset of even 4.969 s.
| alignment error ε | |||
|---|---|---|---|
| subject | original misalignment Δ | mean | std |
| 01 | 600.164 ms | -3.856 ms | ±23.287 ms |
| 02 | -51.084 ms | -7.082 ms | ±23.449 ms |
| 03 | 452.556 ms | -3.460 ms | ±11.195 ms |
| 04 | -362.652 ms | 5.360 ms | ±14.265 ms |
| 05 | 38.488 ms | 2.487 ms | ±17.075 ms |
| 06 | -167.911 ms | -7.906 ms | ±8.902 ms |
| 07 | -375.427 ms | -7.414 ms | ±7.361 ms |
| 08 | 327.127 ms | 7.117 ms | ±13.002 ms |
| 09 | -3393.174 ms | 6.939 ms | ±9.879 ms |
| 10 | -3492.561 ms | -12.445 ms | ±10.223 ms |
| 11 | -401.634 ms | -1.621 ms | ±3.728 ms |
| 12 | -491.203 ms | -11.187 ms | ±5.550 ms |
| 13 | 1401.131 ms | -2.915 ms | ±10.560 ms |
| 14 | 3215.762 ms | 3.654 ms | ±7.893 ms |
| 15 | -396.886 ms | 3.127 ms | ±16.765 ms |
| 16 | 196.308 ms | -3.698 ms | ±14.890 ms |
| 17 | 510.017 ms | -10.000 ms | ±5.586 ms |
| 18 | -82.679 ms | -2.676 ms | ±5.521 ms |
| 19 | 4969.422 ms | 9.257 ms | ±6.627 ms |
| 20 | 3186.051 ms | 1.945 ms | ±8.233 ms |
| 21 | -60.189 ms | -20.188 ms | ±1.720 ms |
| 22 | -163.334 ms | -3.329 ms | ±6.952 ms |
| 23 | -974.843 ms | -14.811 ms | ±6.698 ms |
| 24 | -1833.231 ms | 6.830 ms | ±3.206 ms |
| 25 | -553.026 ms | 2.993 ms | ±8.011 ms |
[1]: "High precision ECG Database with annotated R peaks, recorded and filmed under realistic conditions", Luis Howell and Bernd Porr. University of Glasgow, 2018. http://dx.doi.org/10.5525/gla.researchdata.716

