- Viz of the Week
- Usage
- Visuals
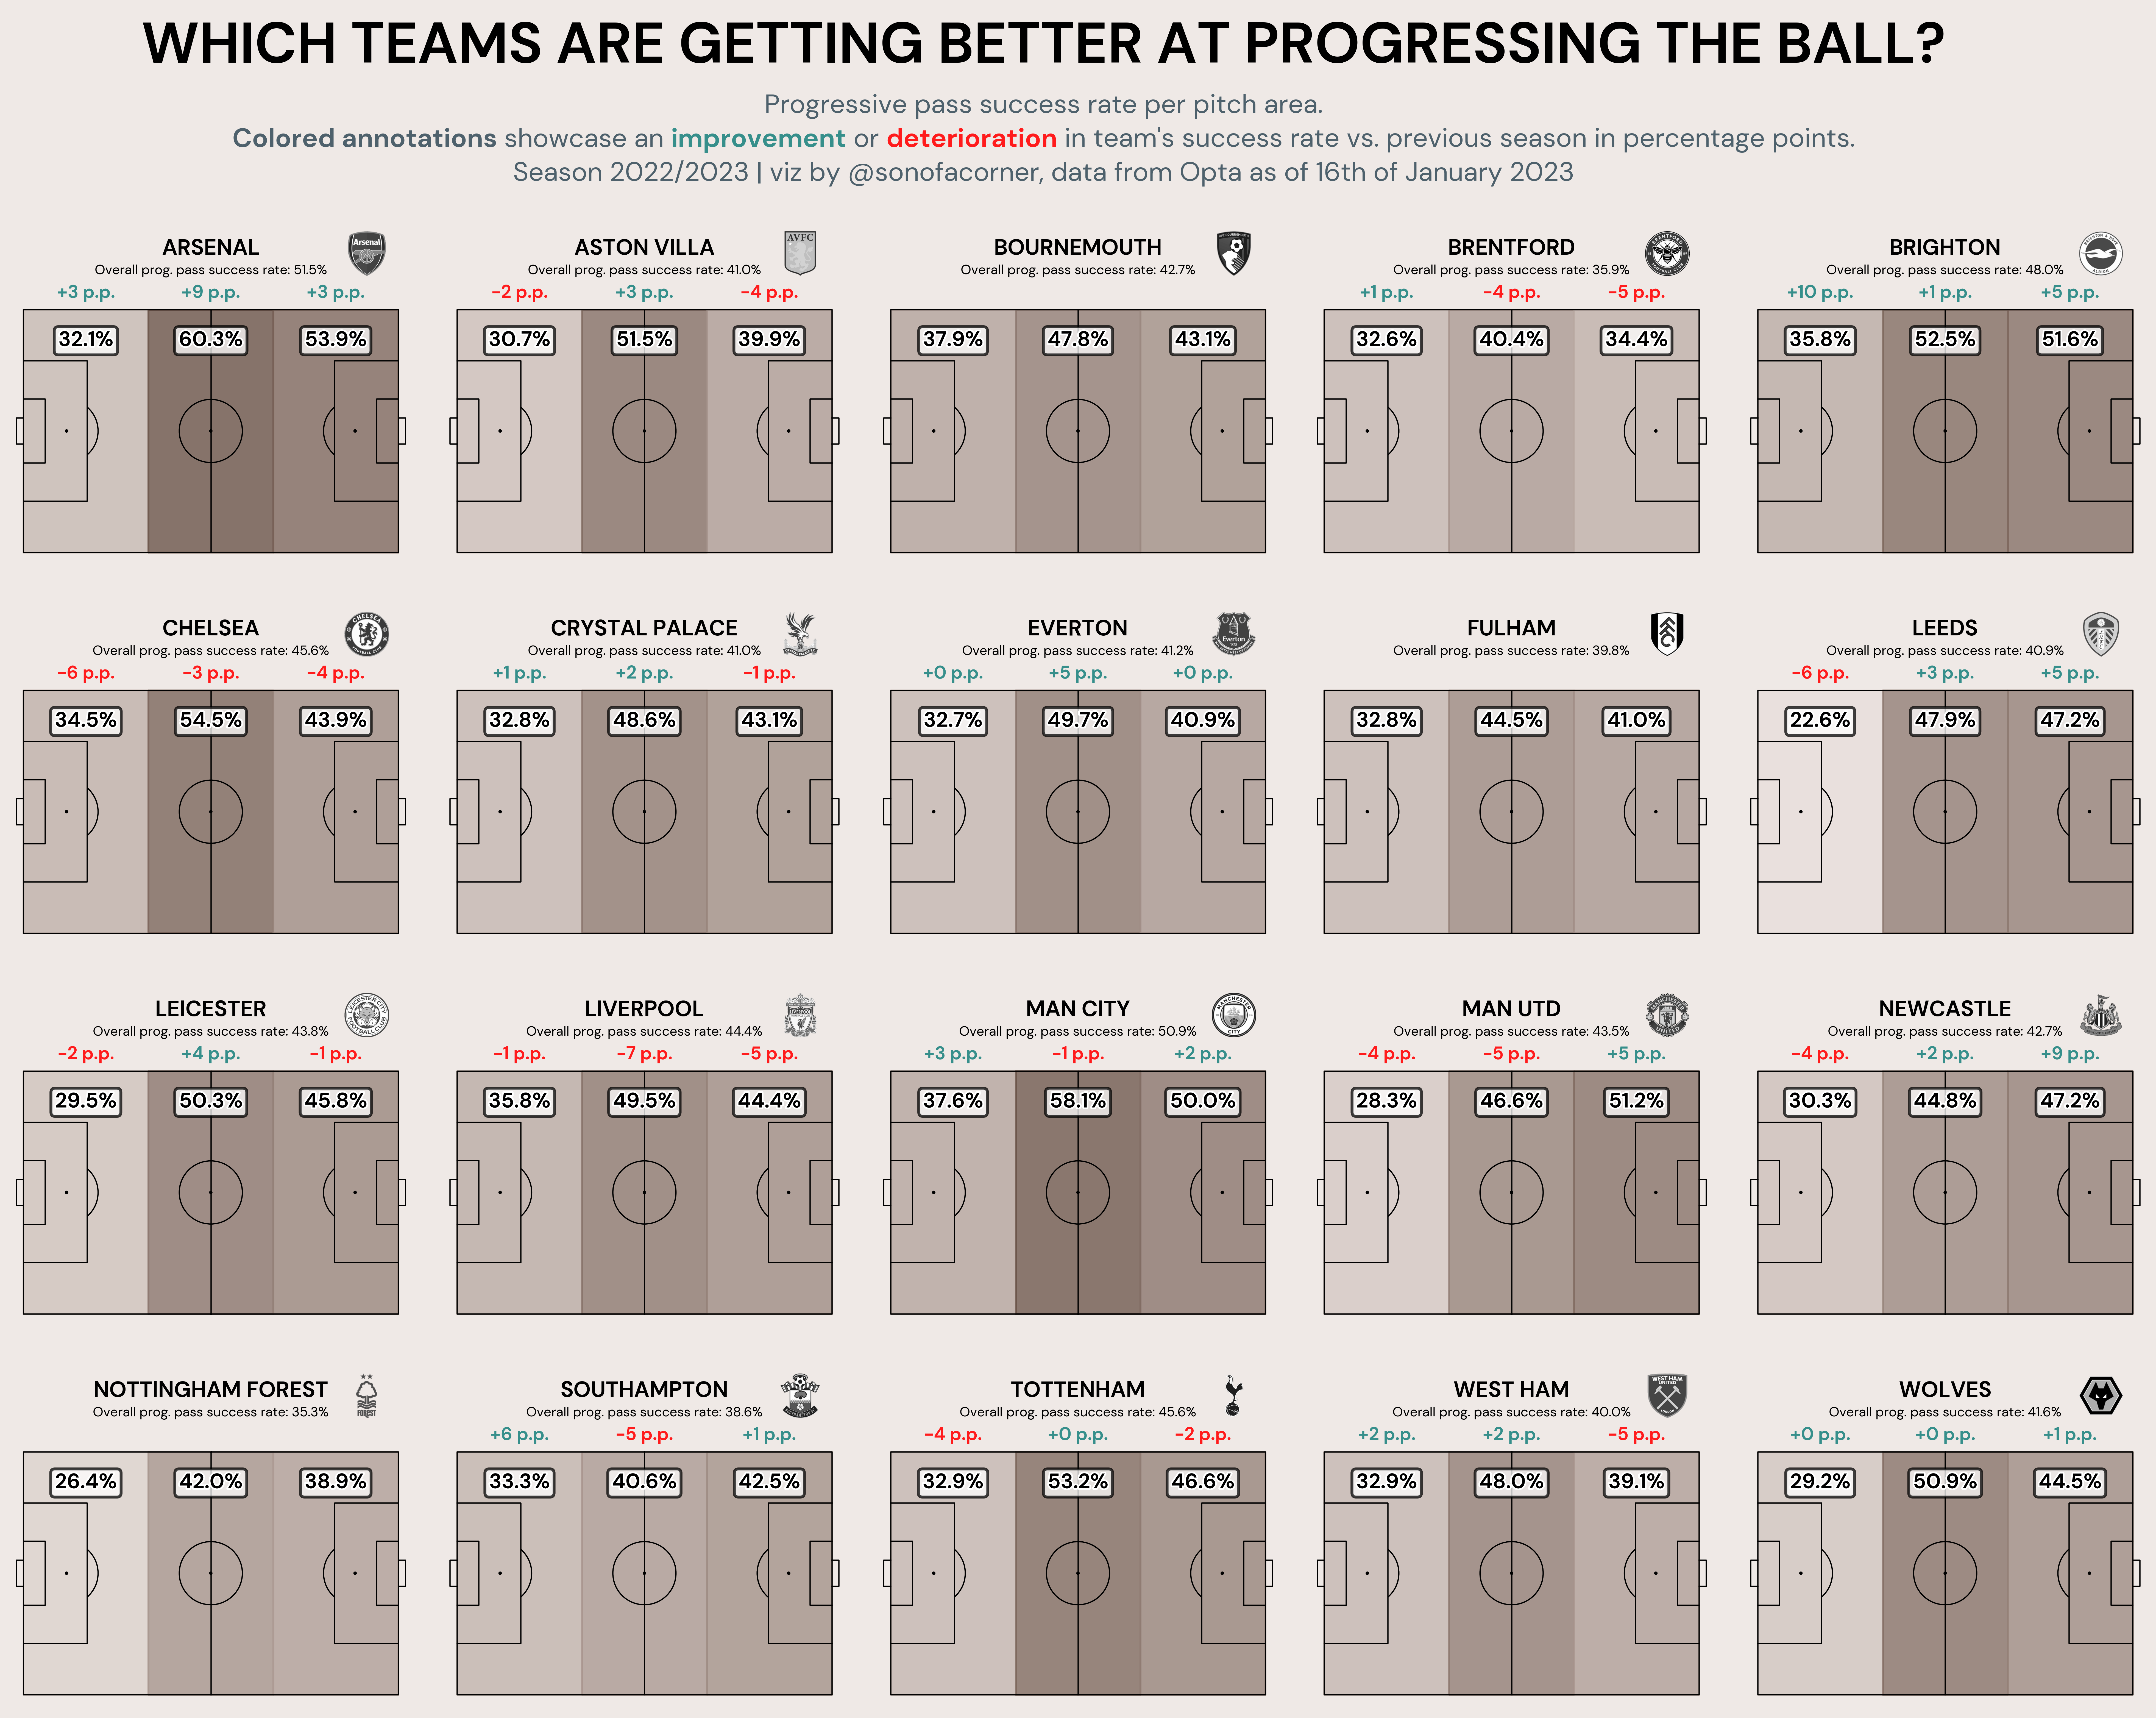
- Which EPL teams are getting better at progressive passes?(01172023)
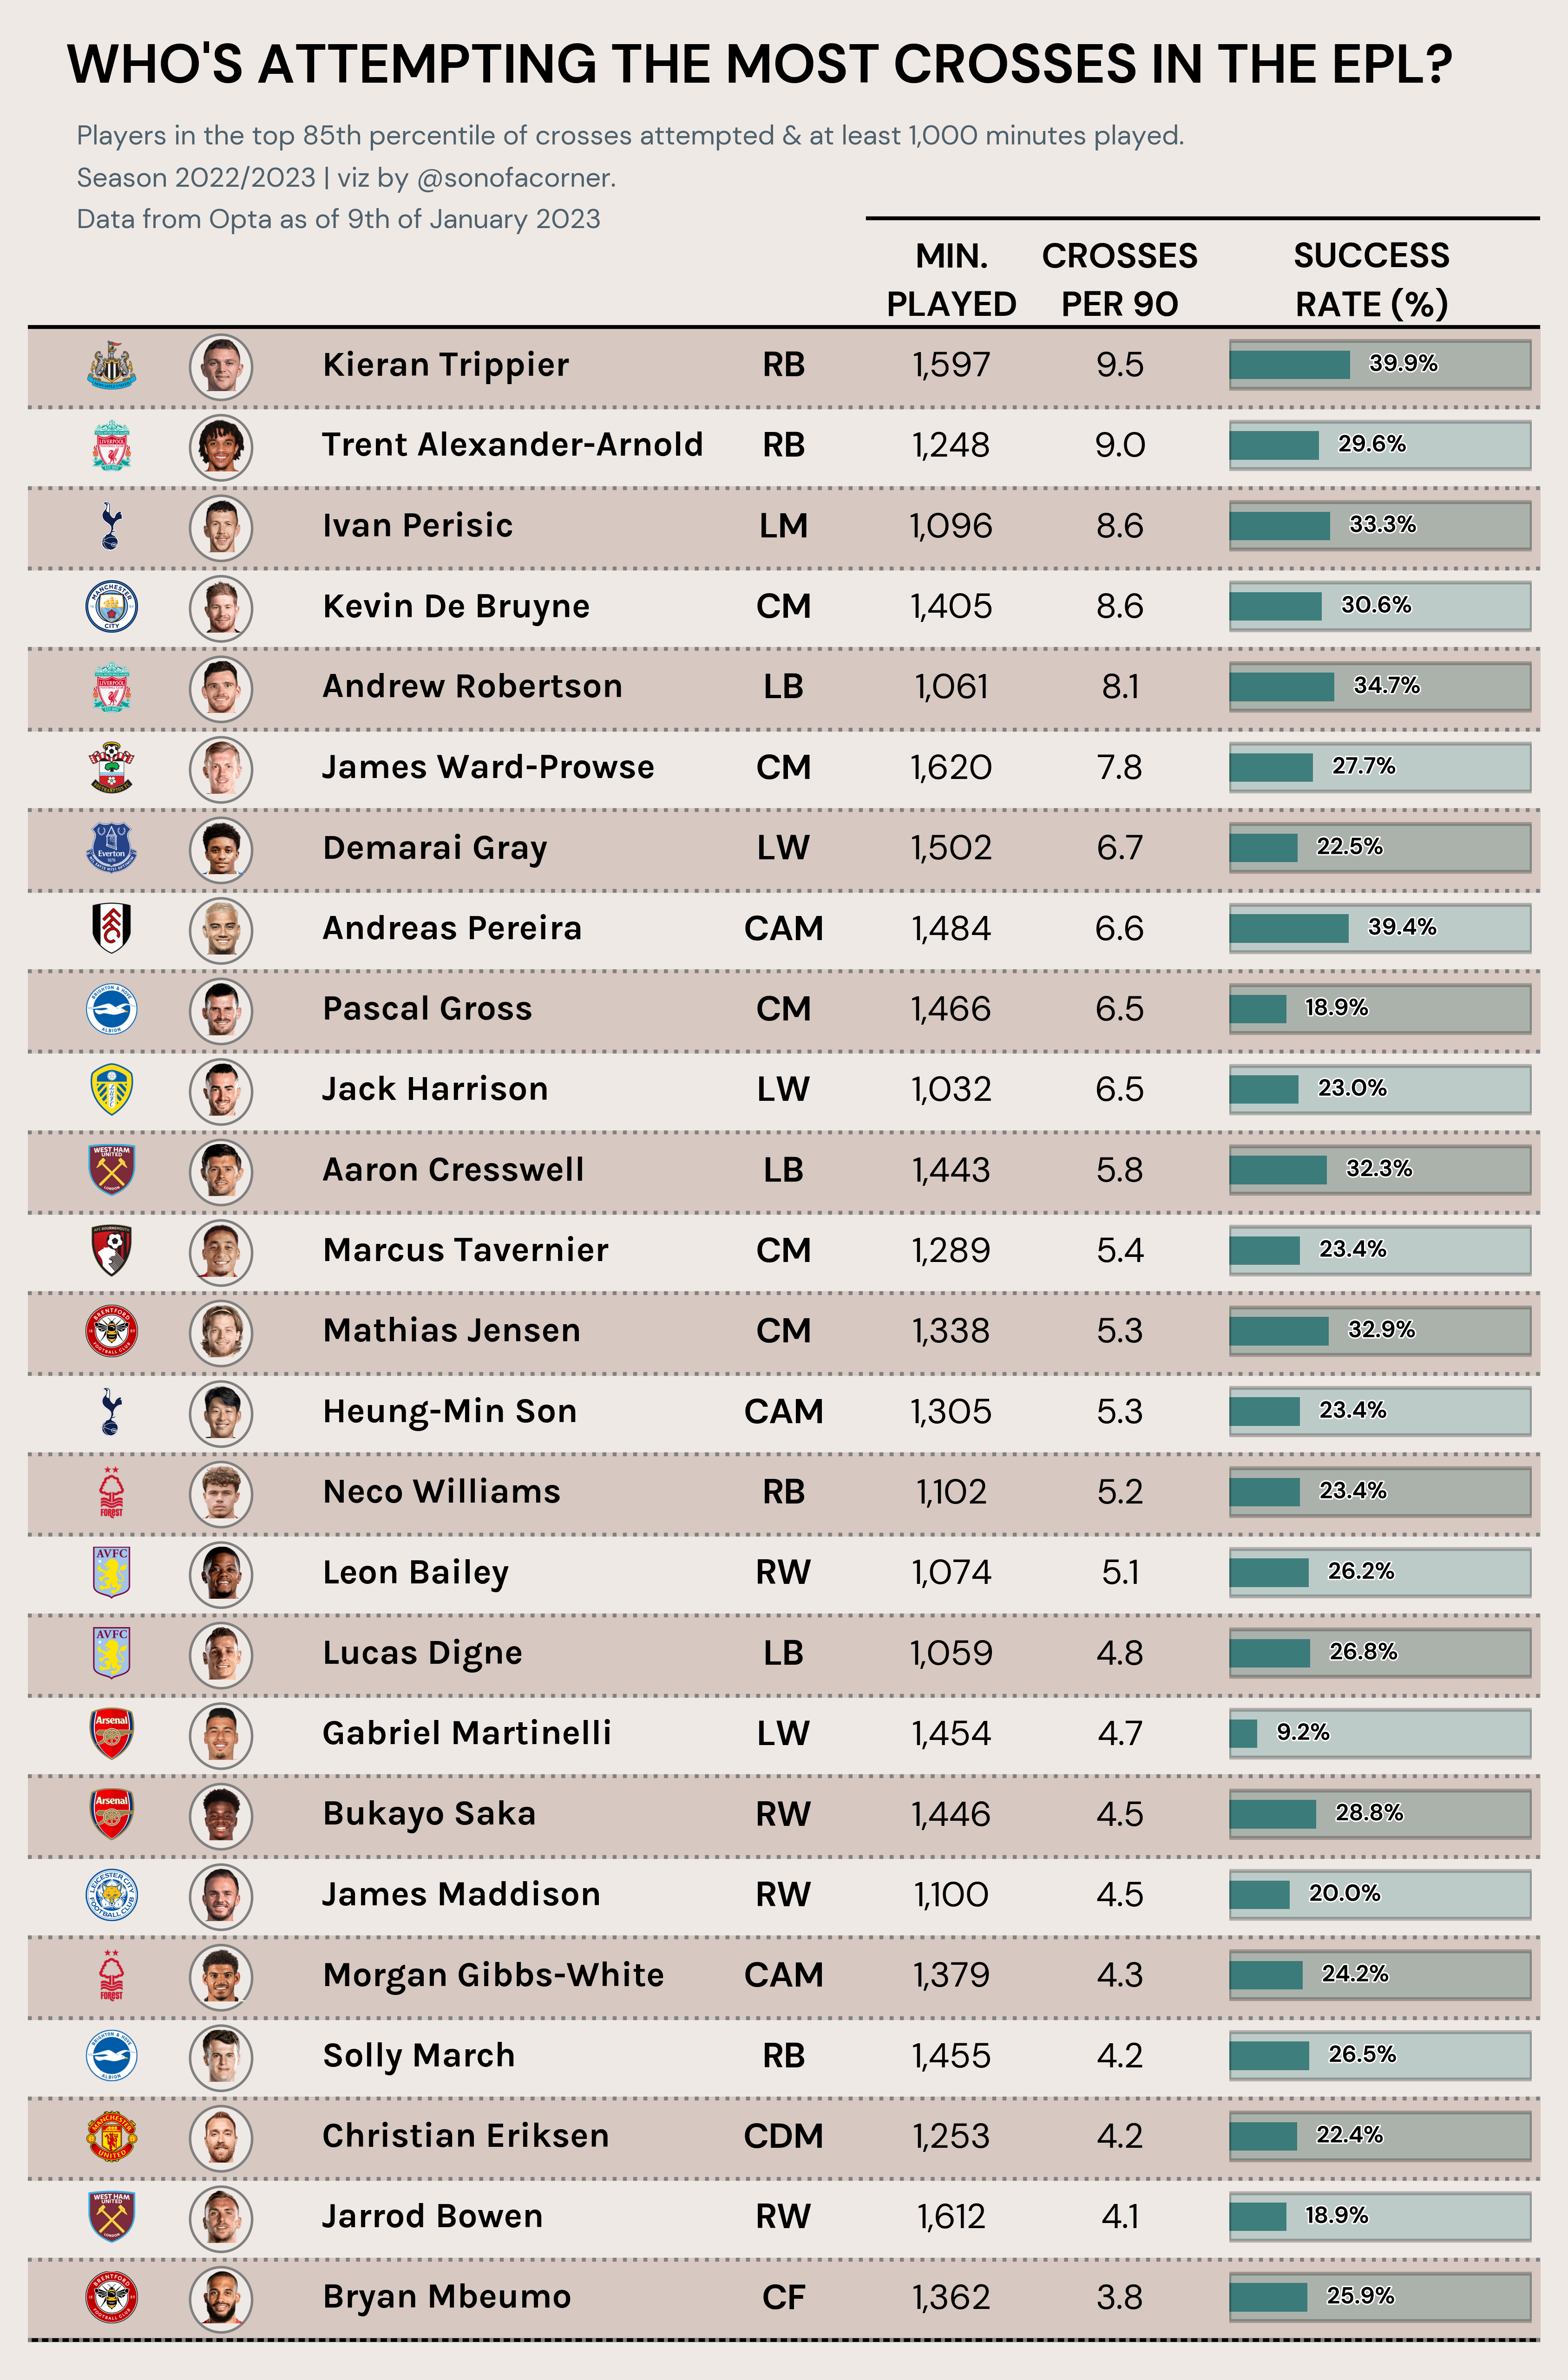
- Crossing Accuracy in the Premier League (01092023)
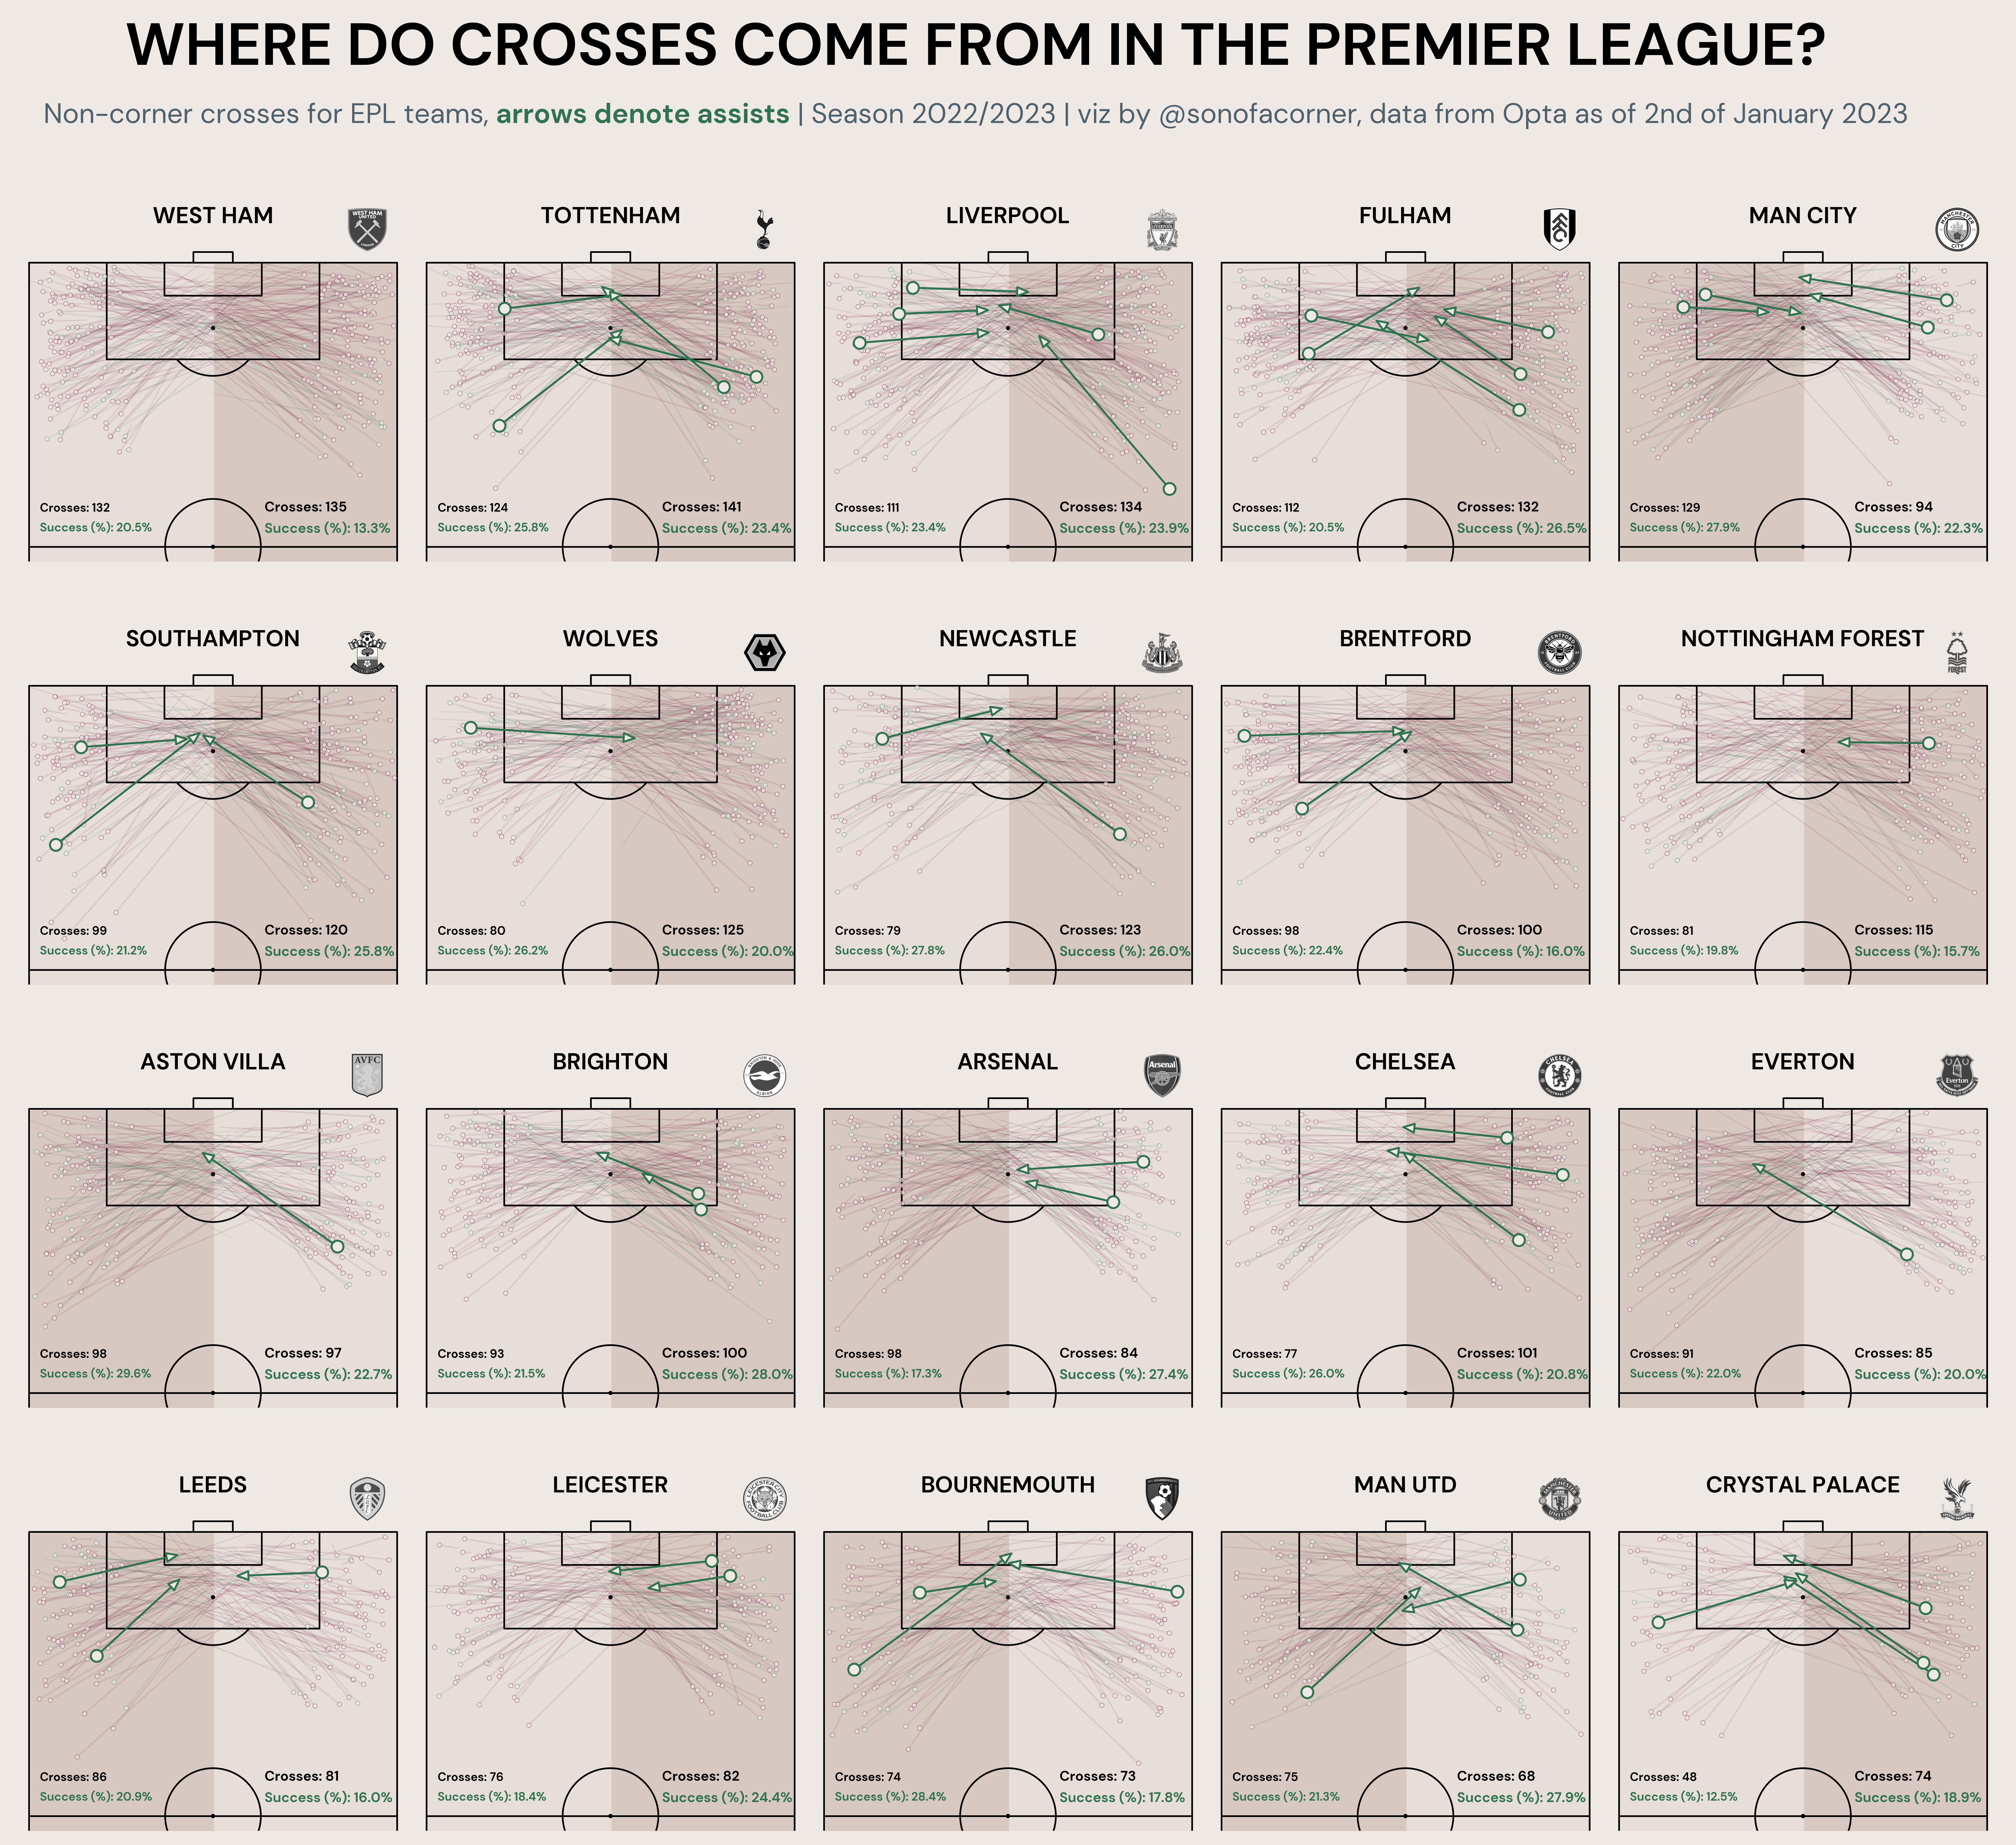
- Where do Crosses Come From in the Premier League?(01022023)
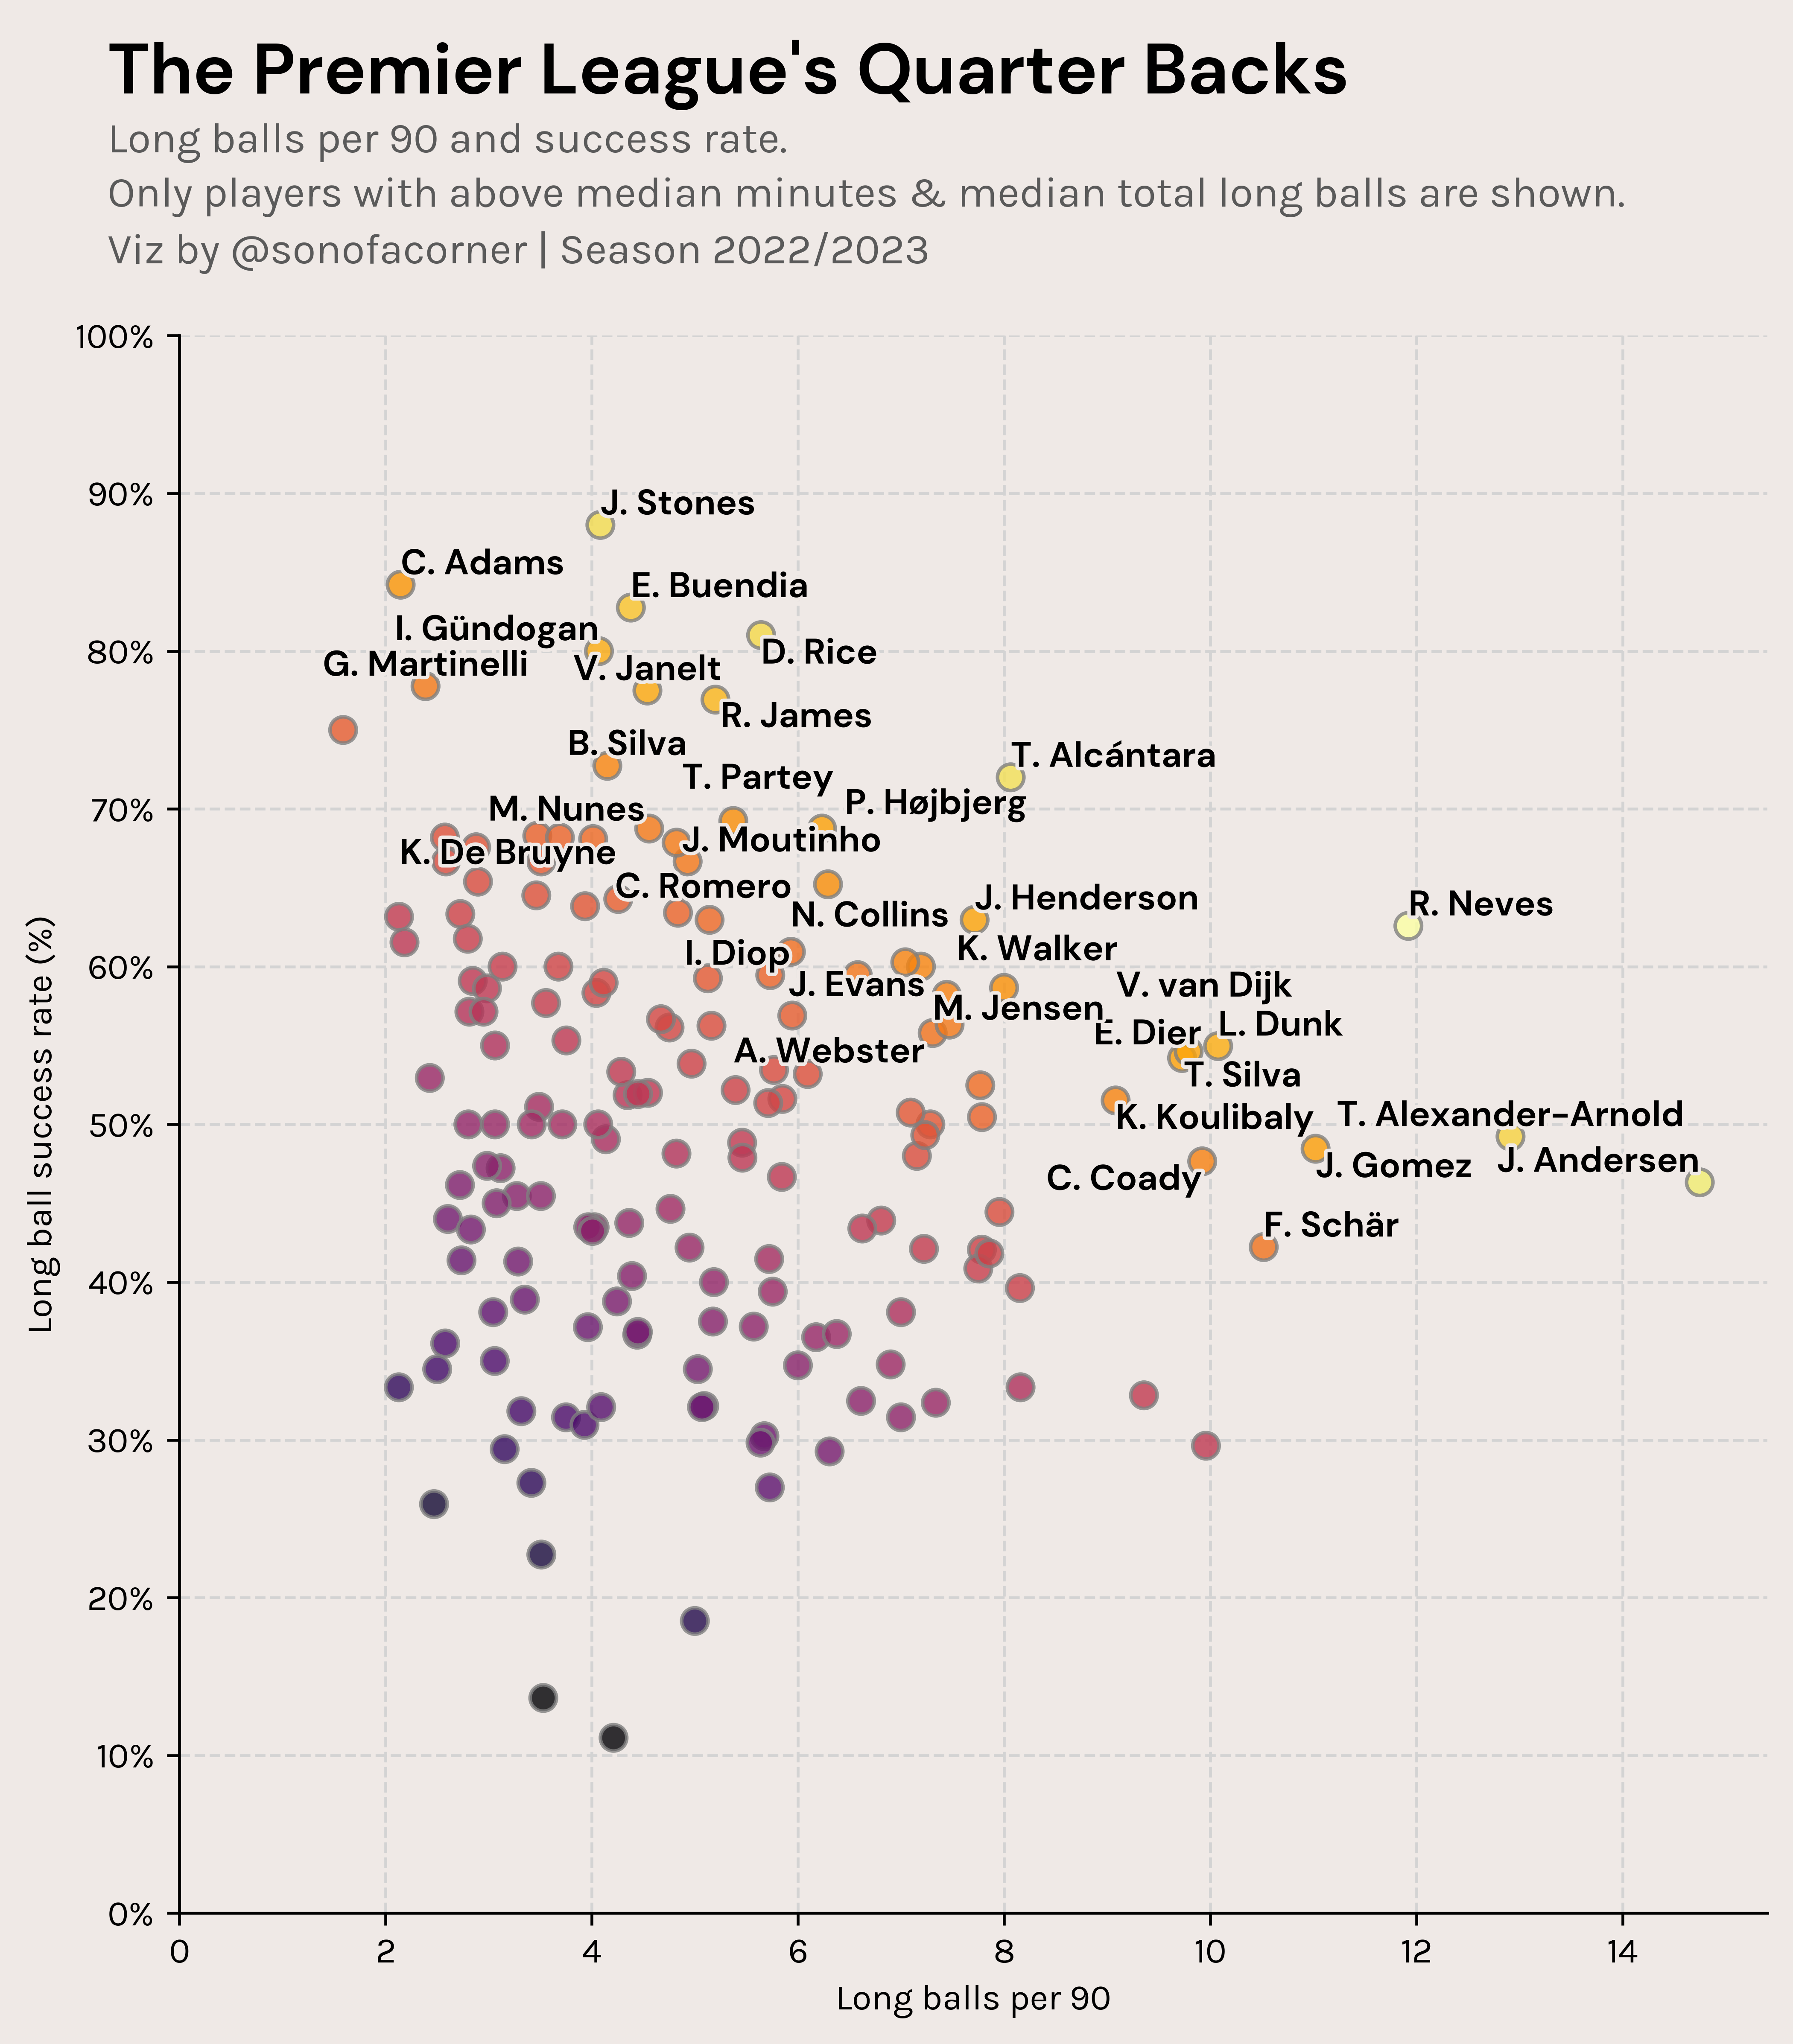
- Premier League Quarter Backs(11072022)
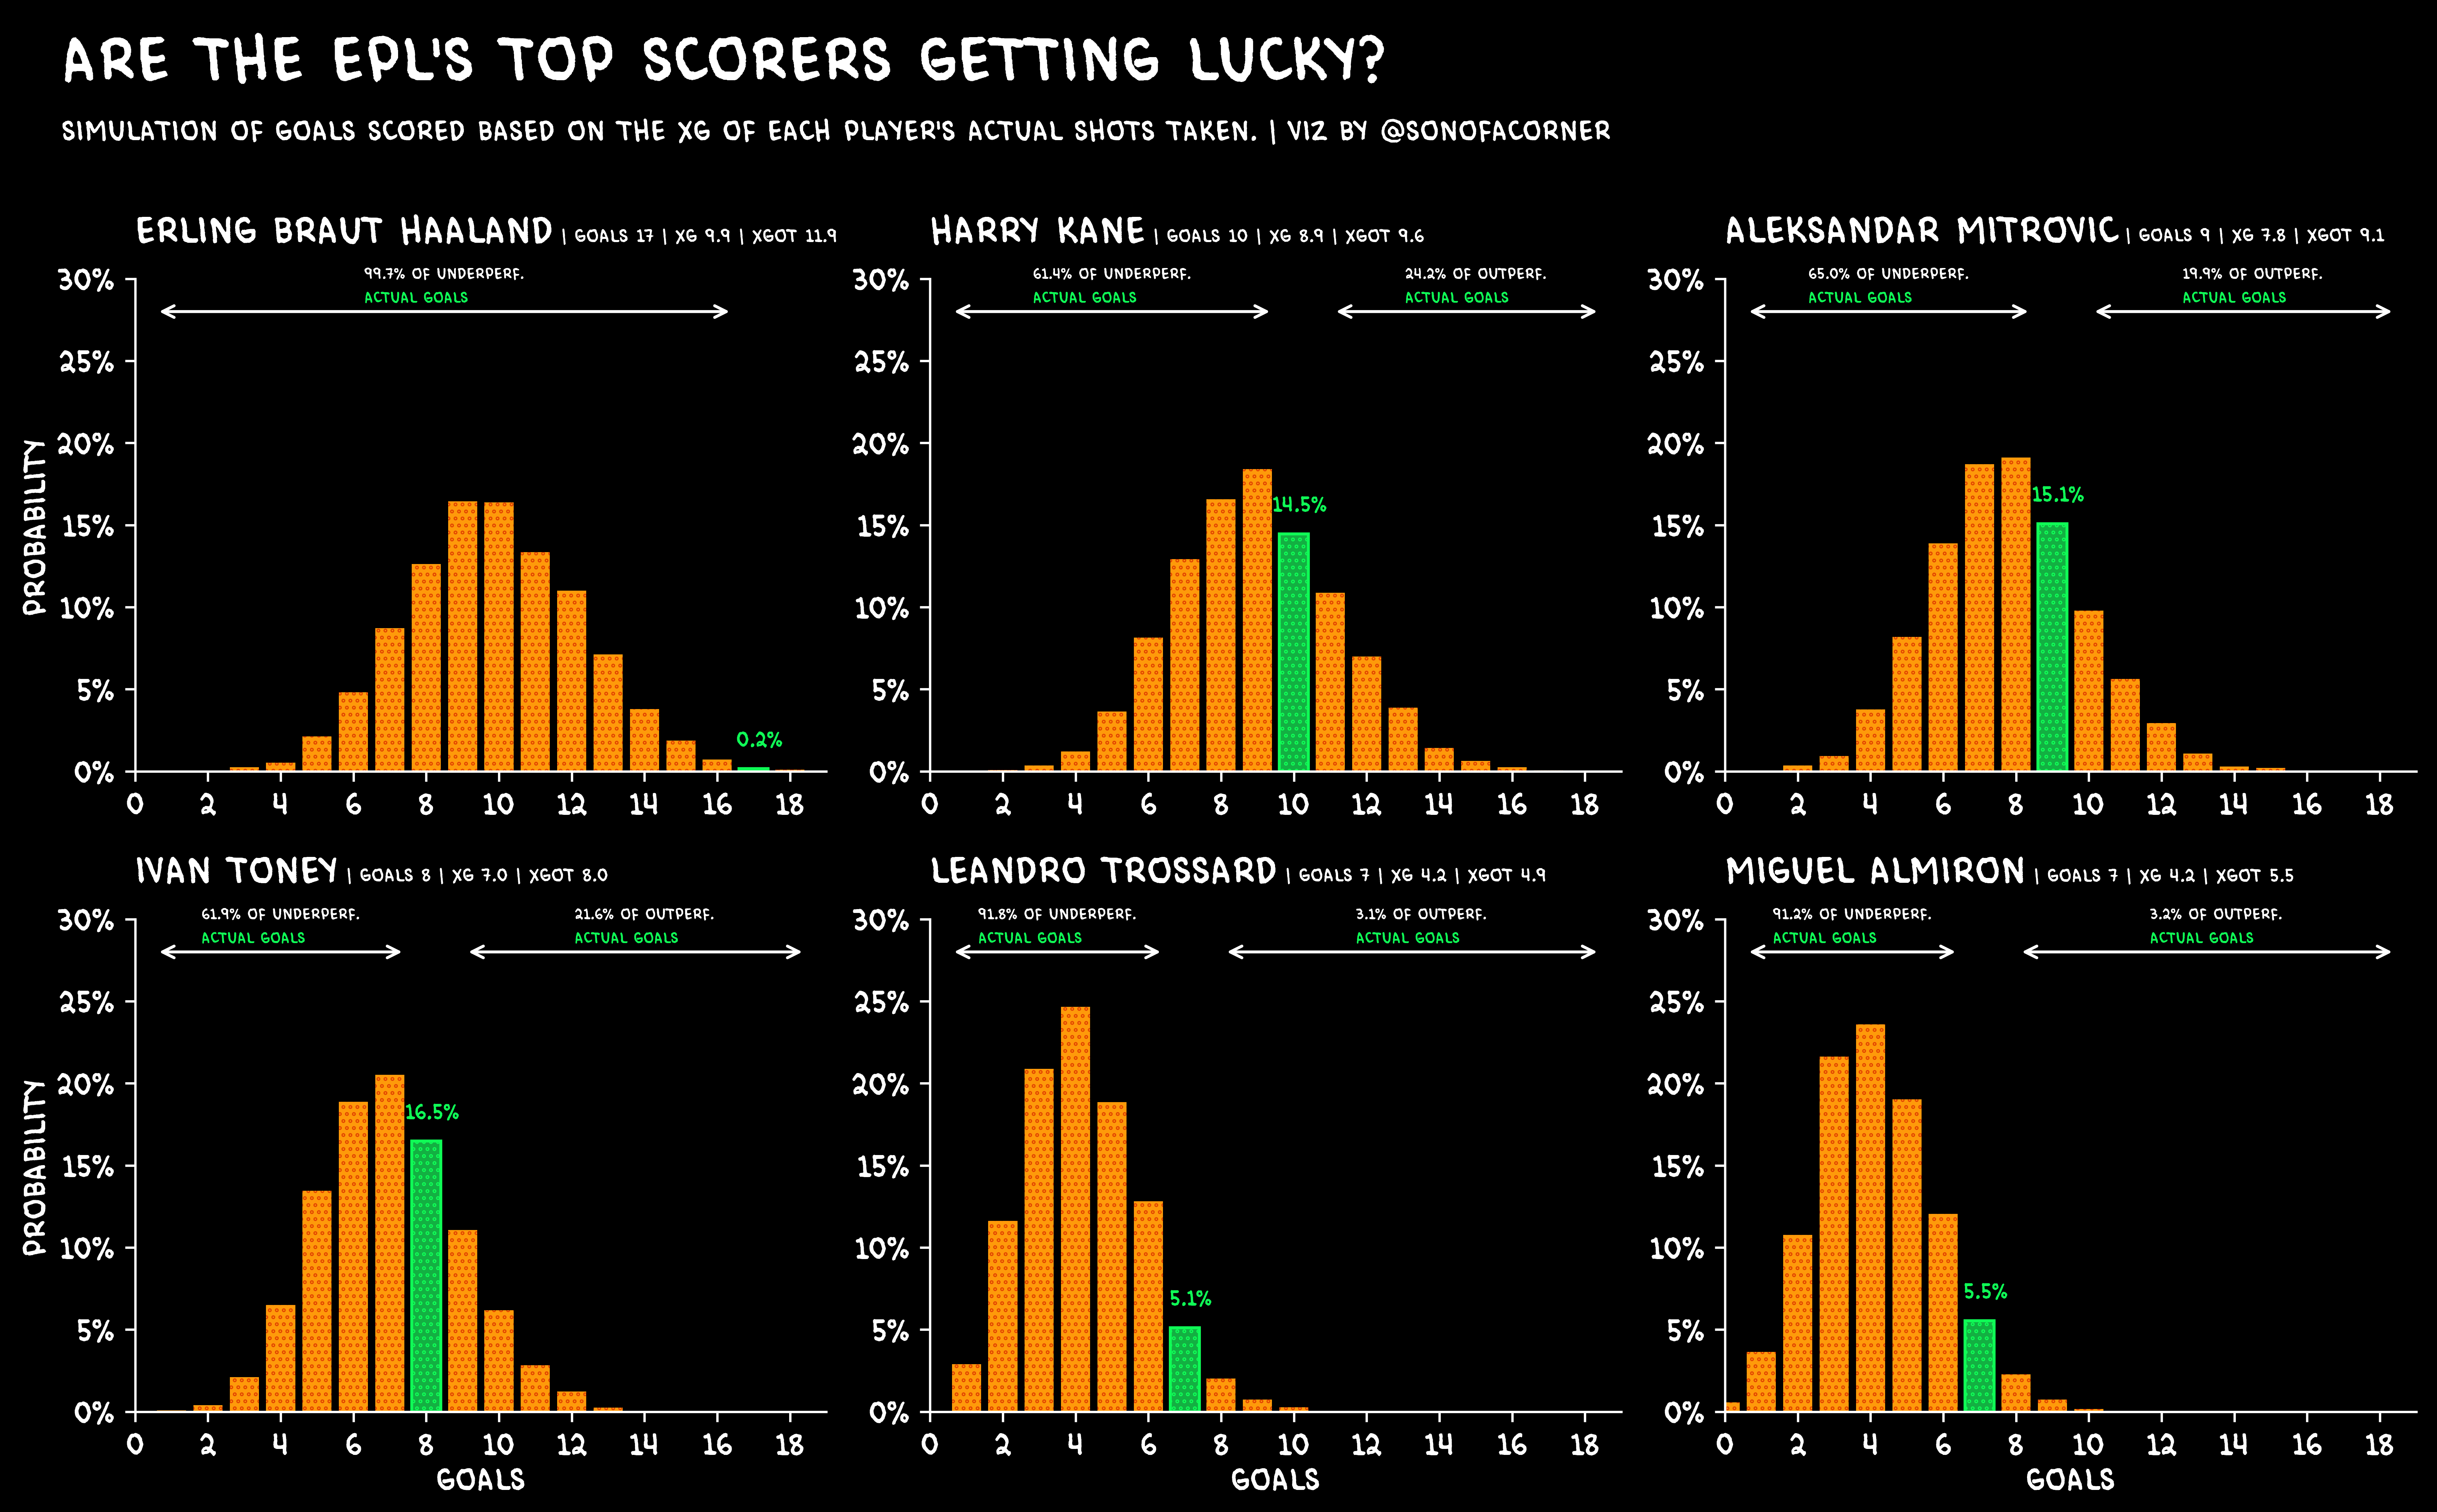
- Premier League Shot Simulation (10312022)
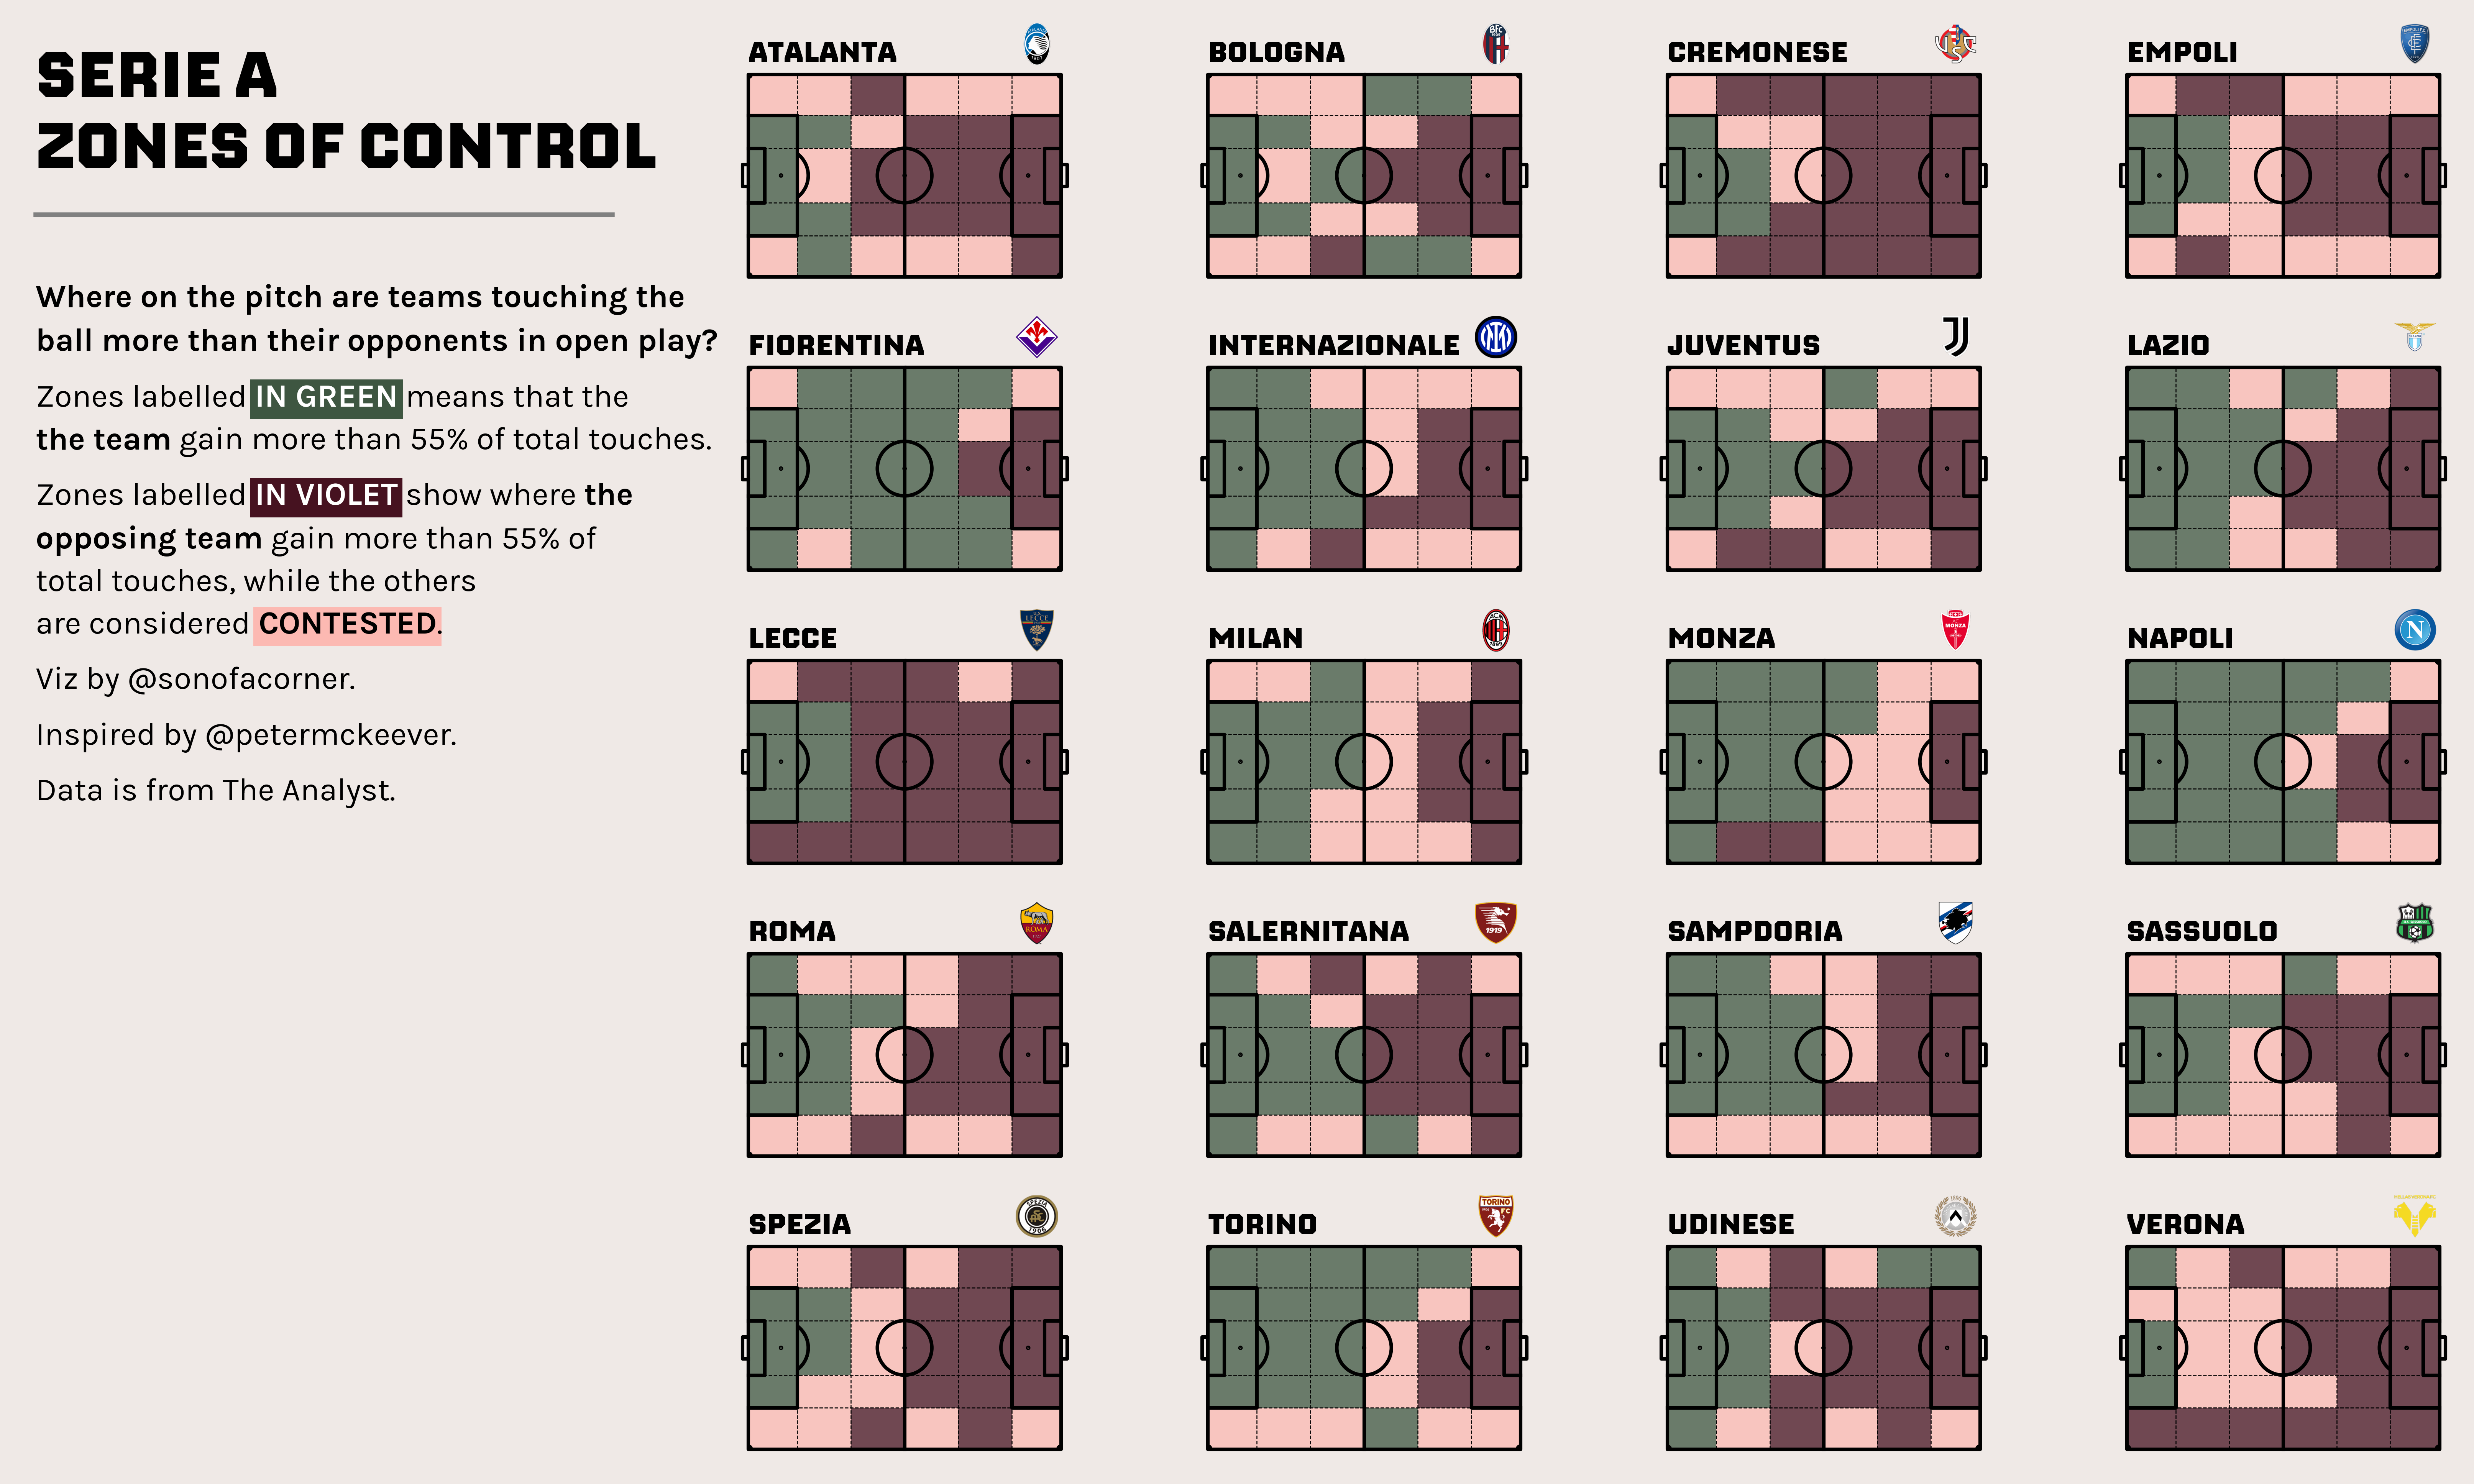
- Contested Zones in Serie A (10242022)
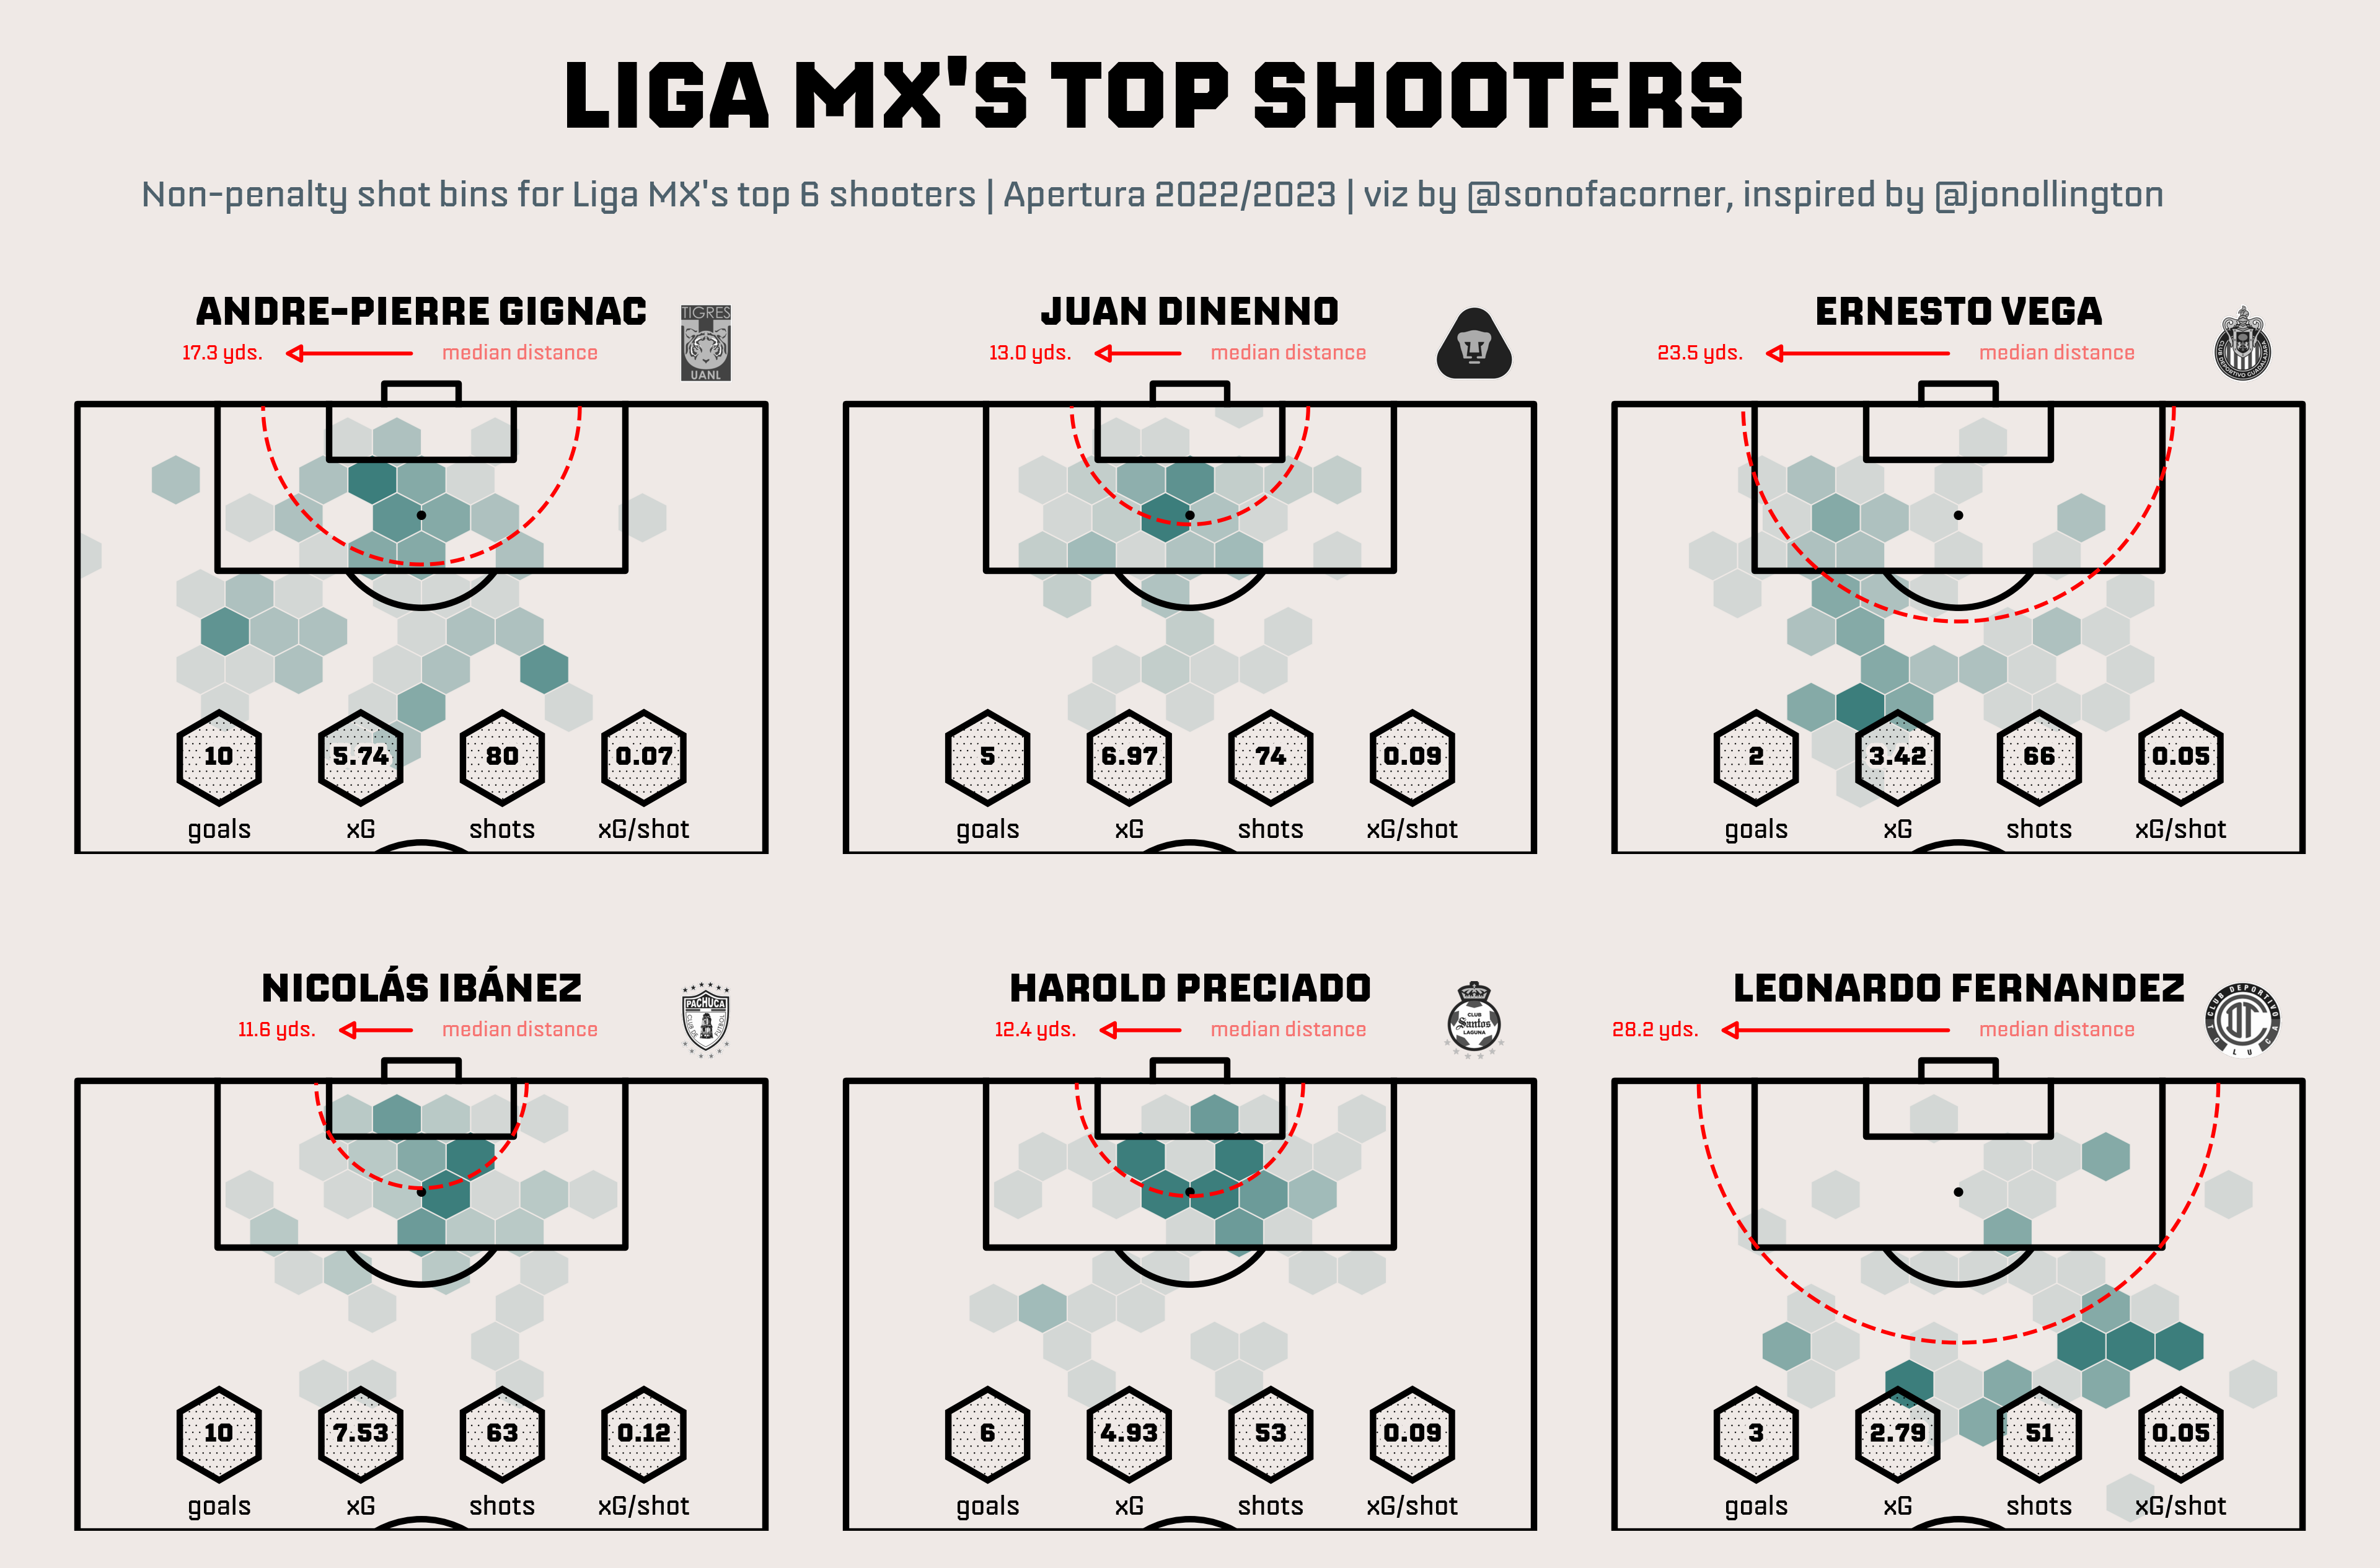
- Liga MX's Top Shooters (10172022)
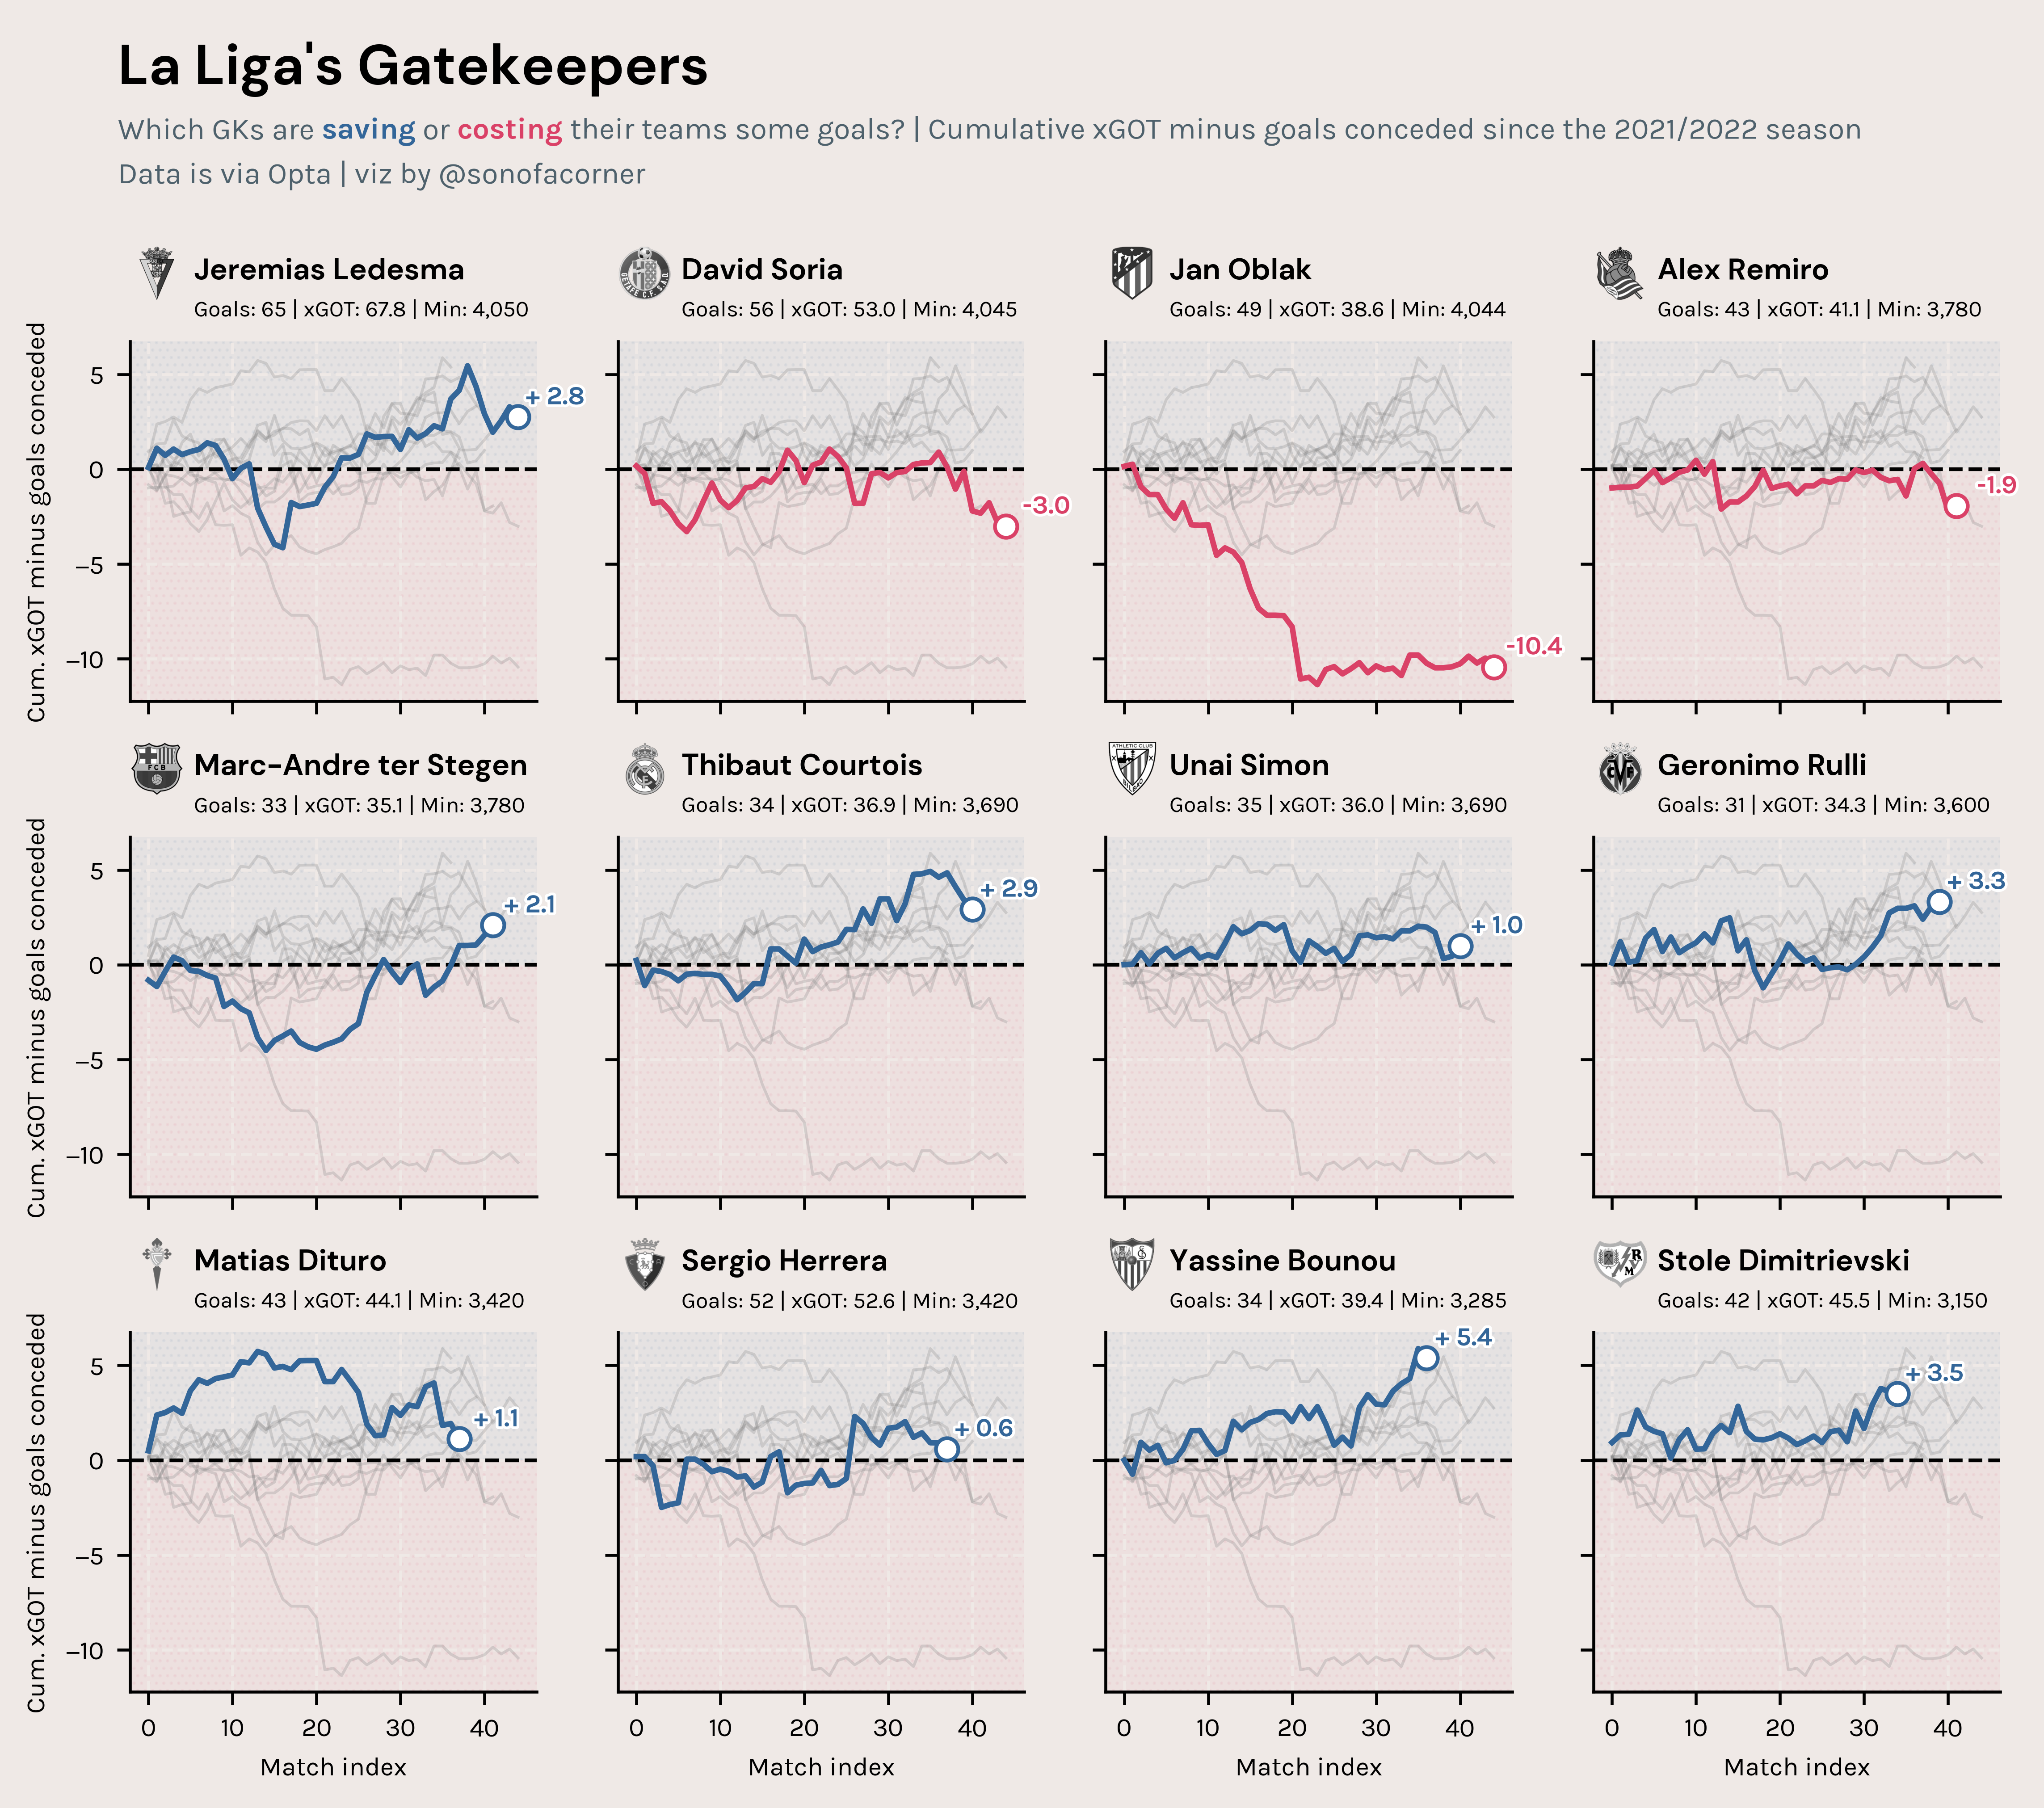
- La Liga's Gatekeepers (10102022)
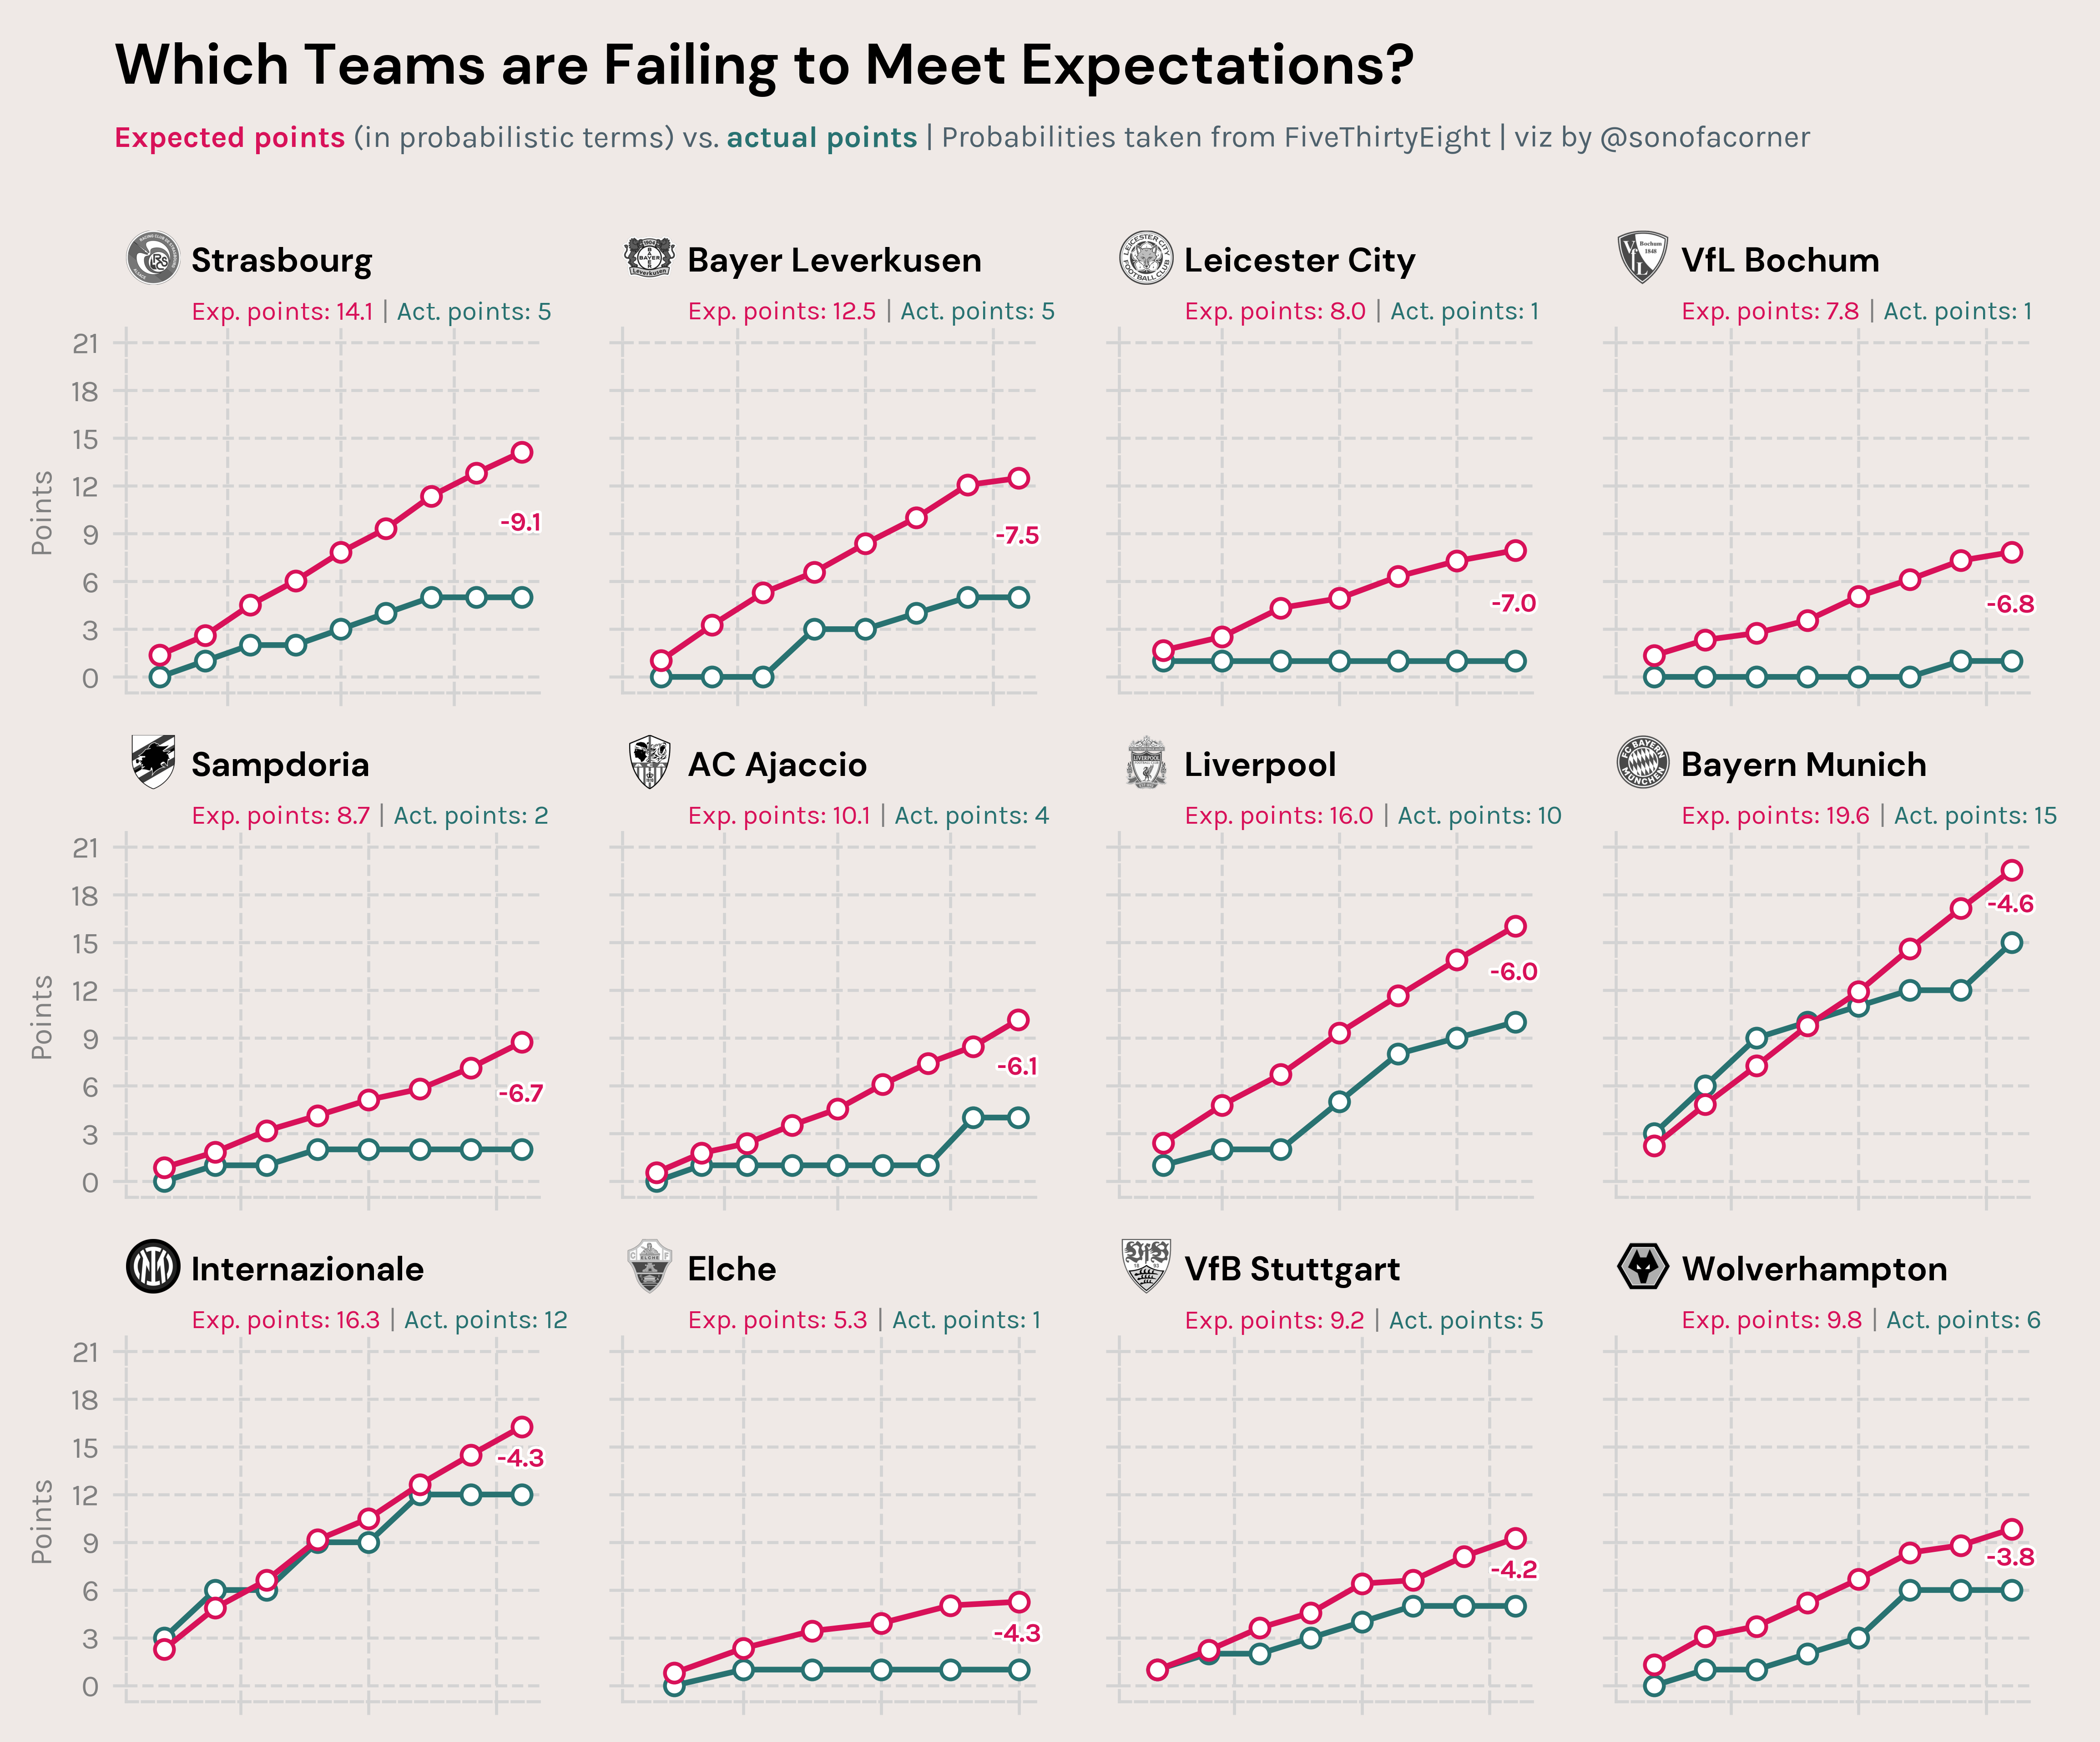
- Which Teams are Failing to Meet Expectations (10032022)
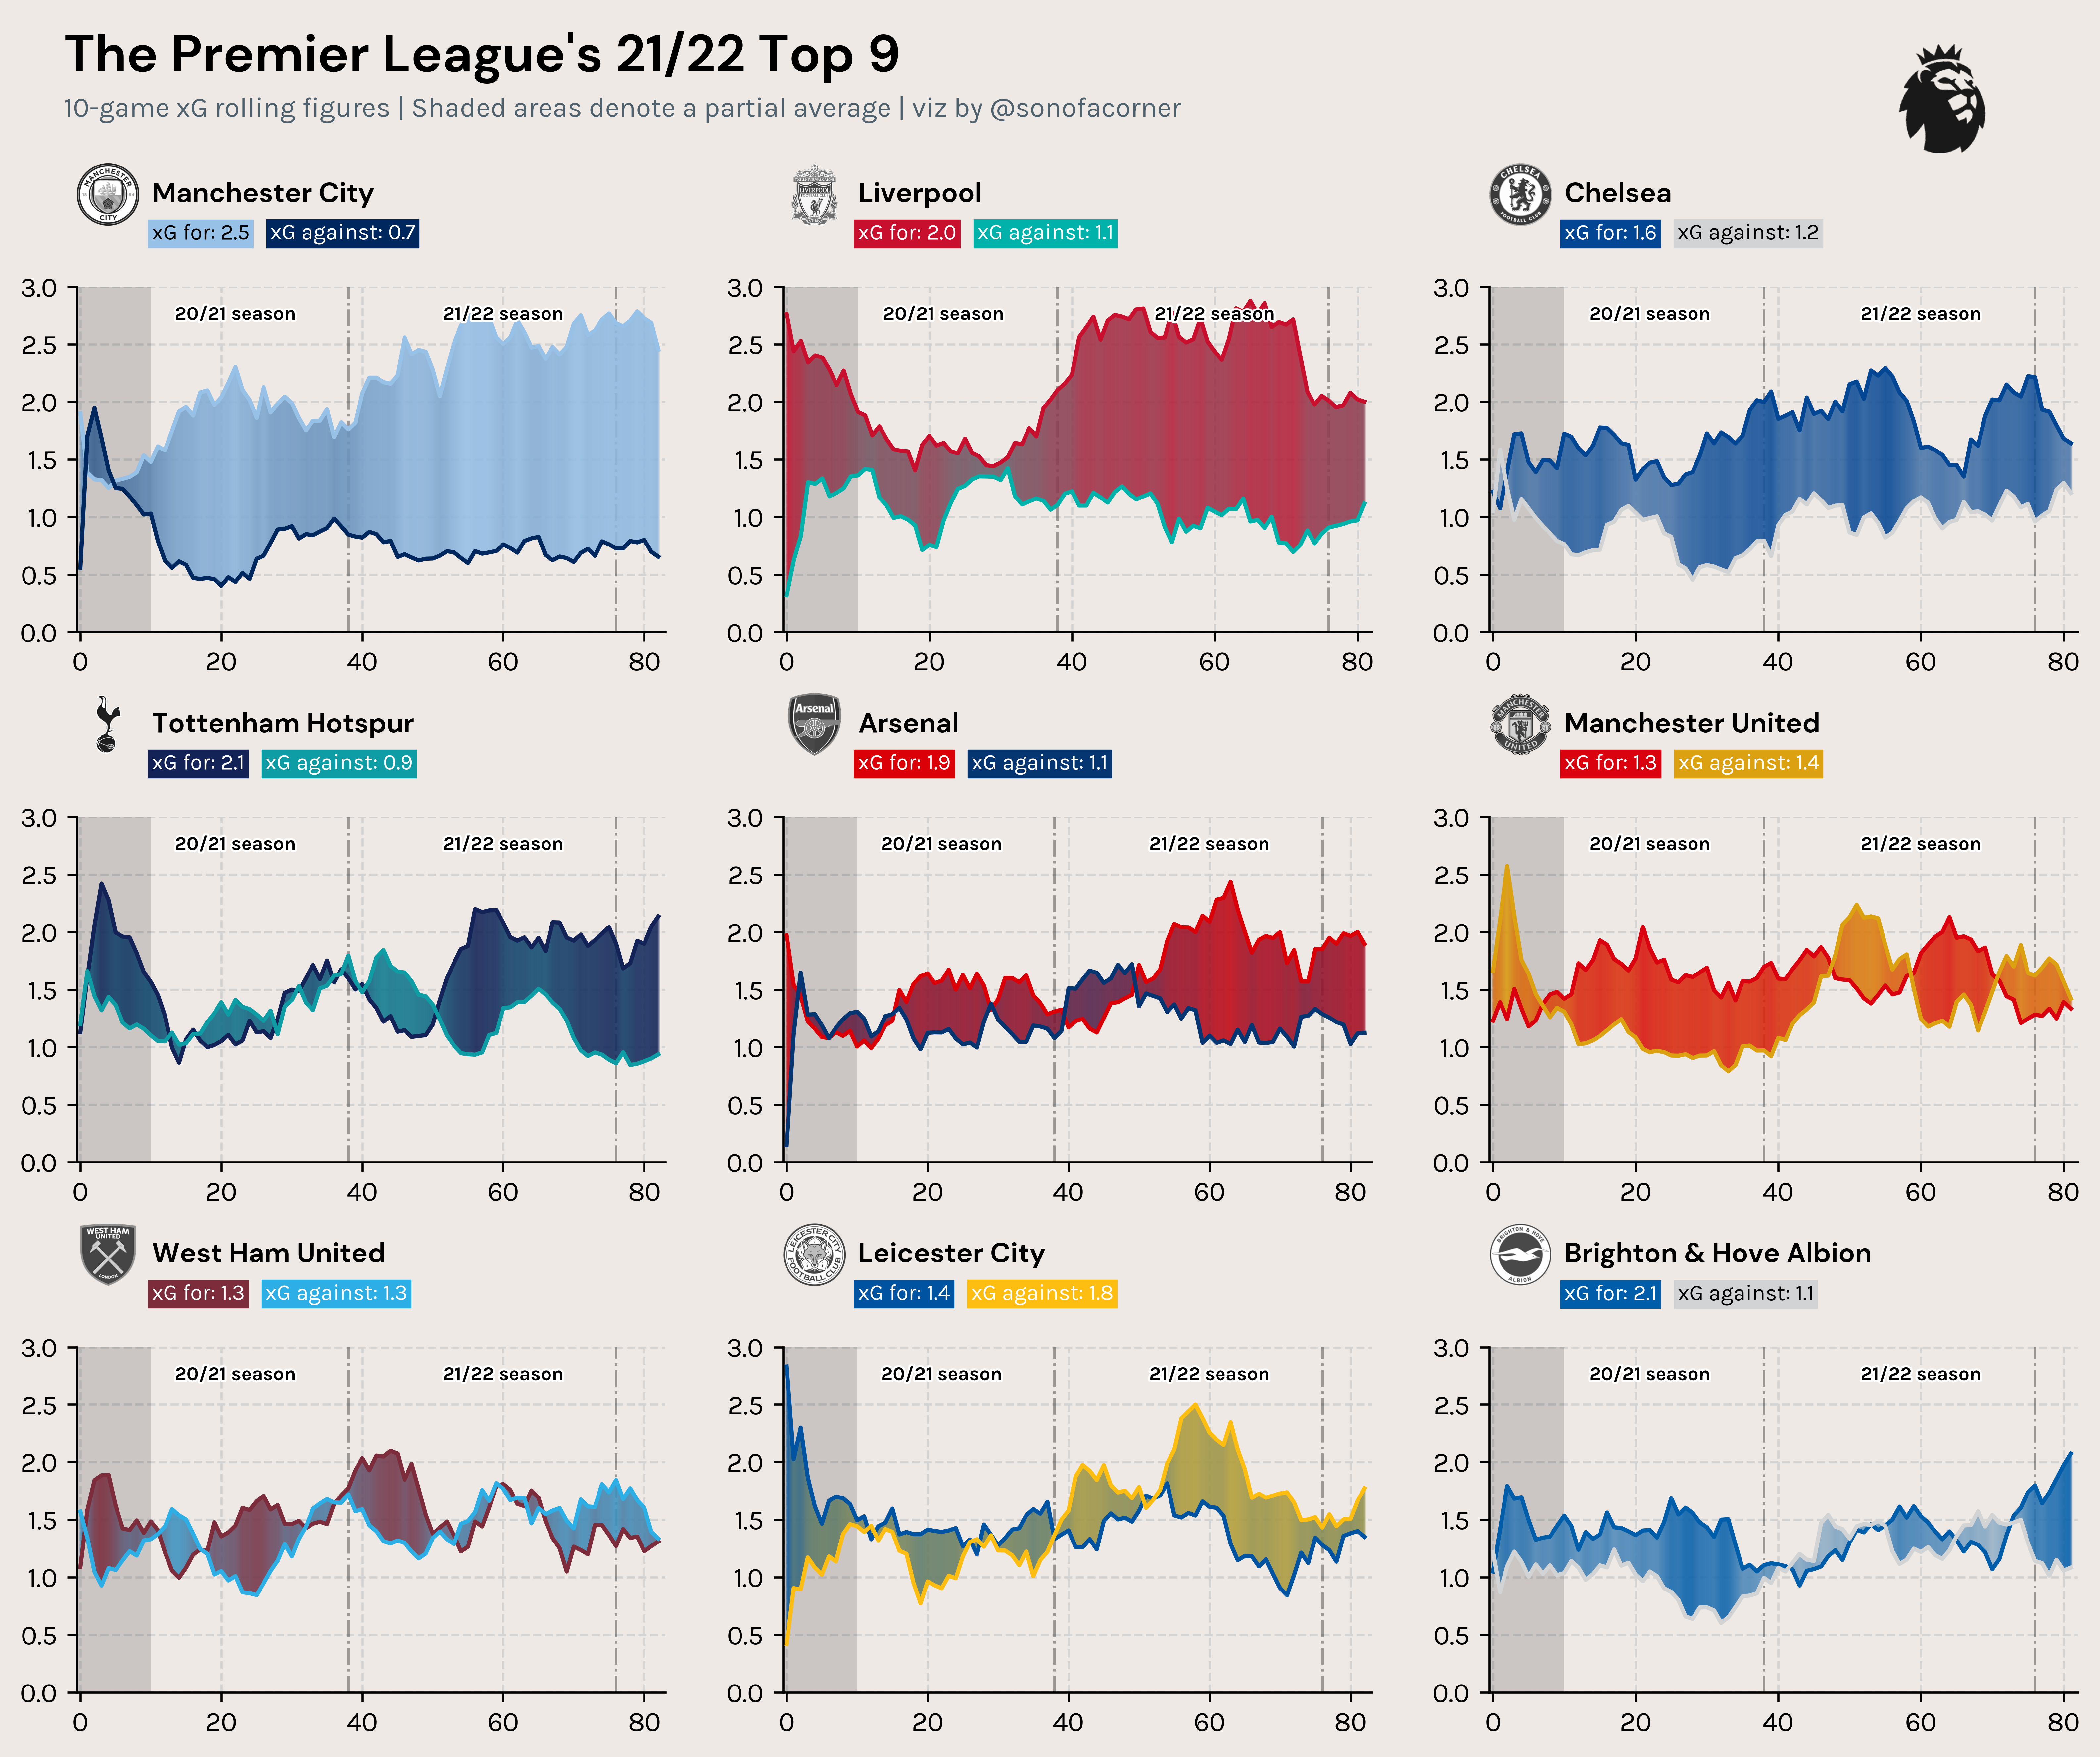
- xG Rolling Charts for the Premier League (09262022)
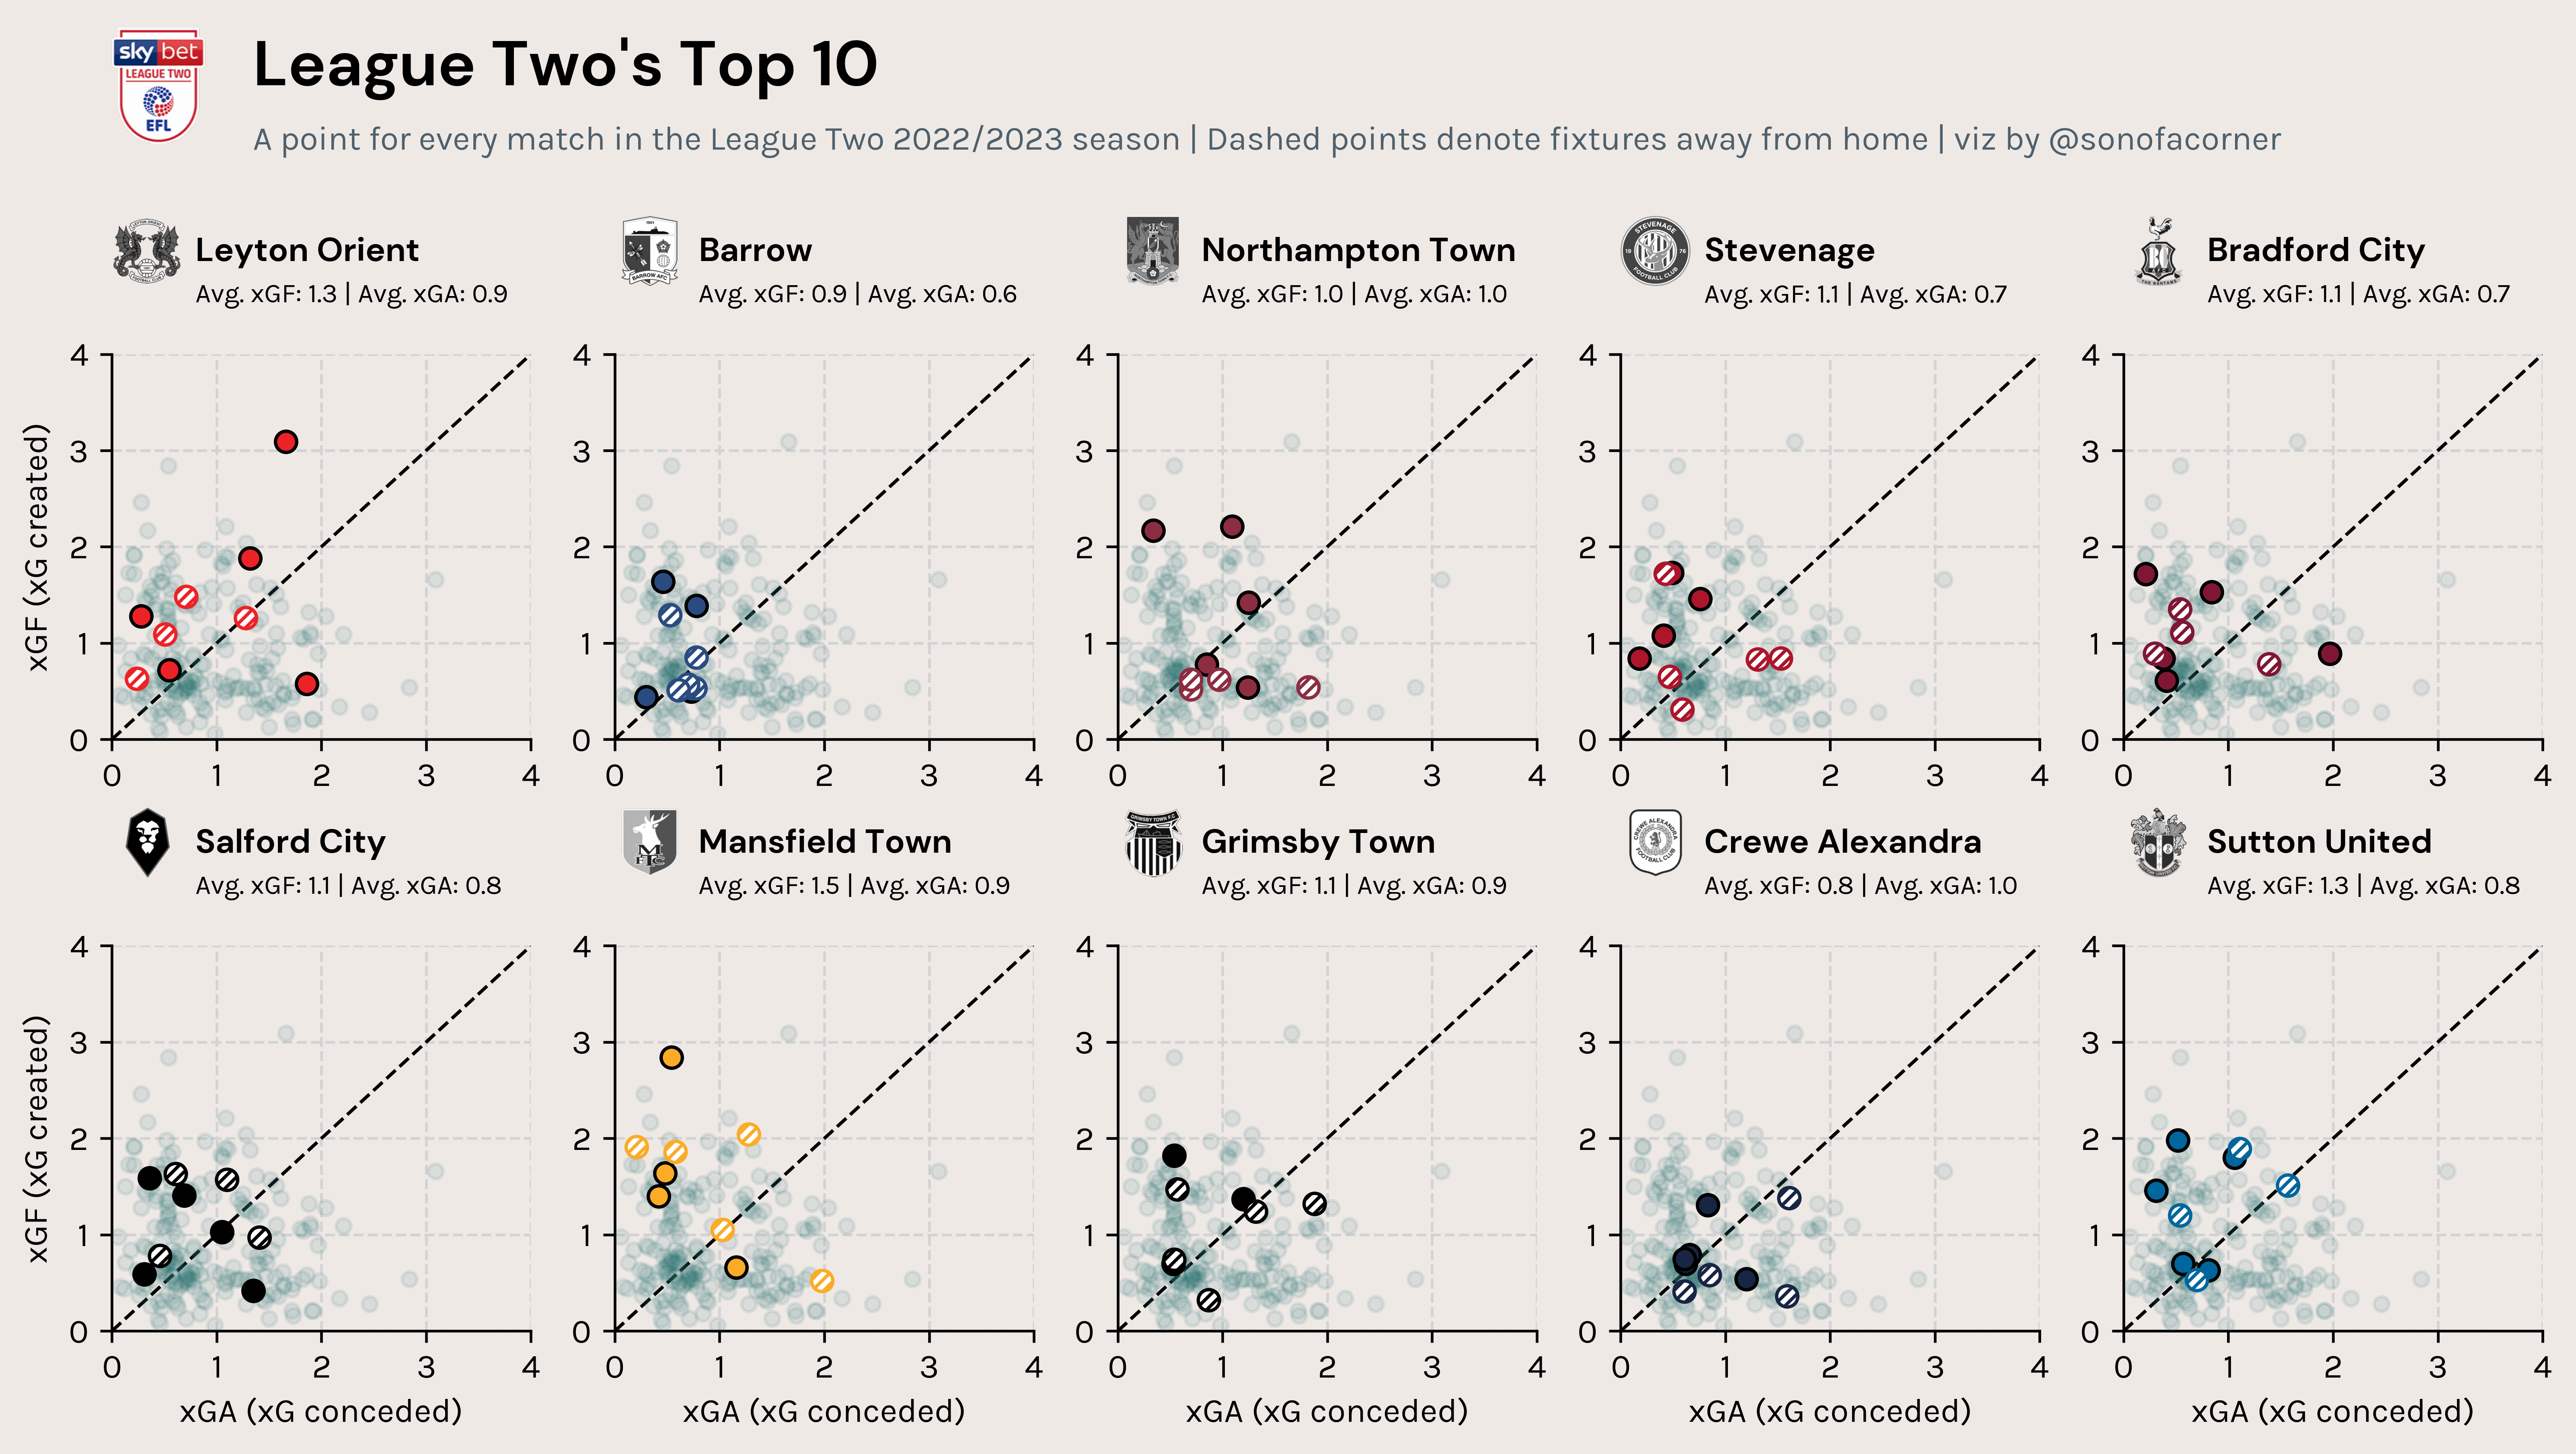
- League Two xG Scatter Plots (09192022)
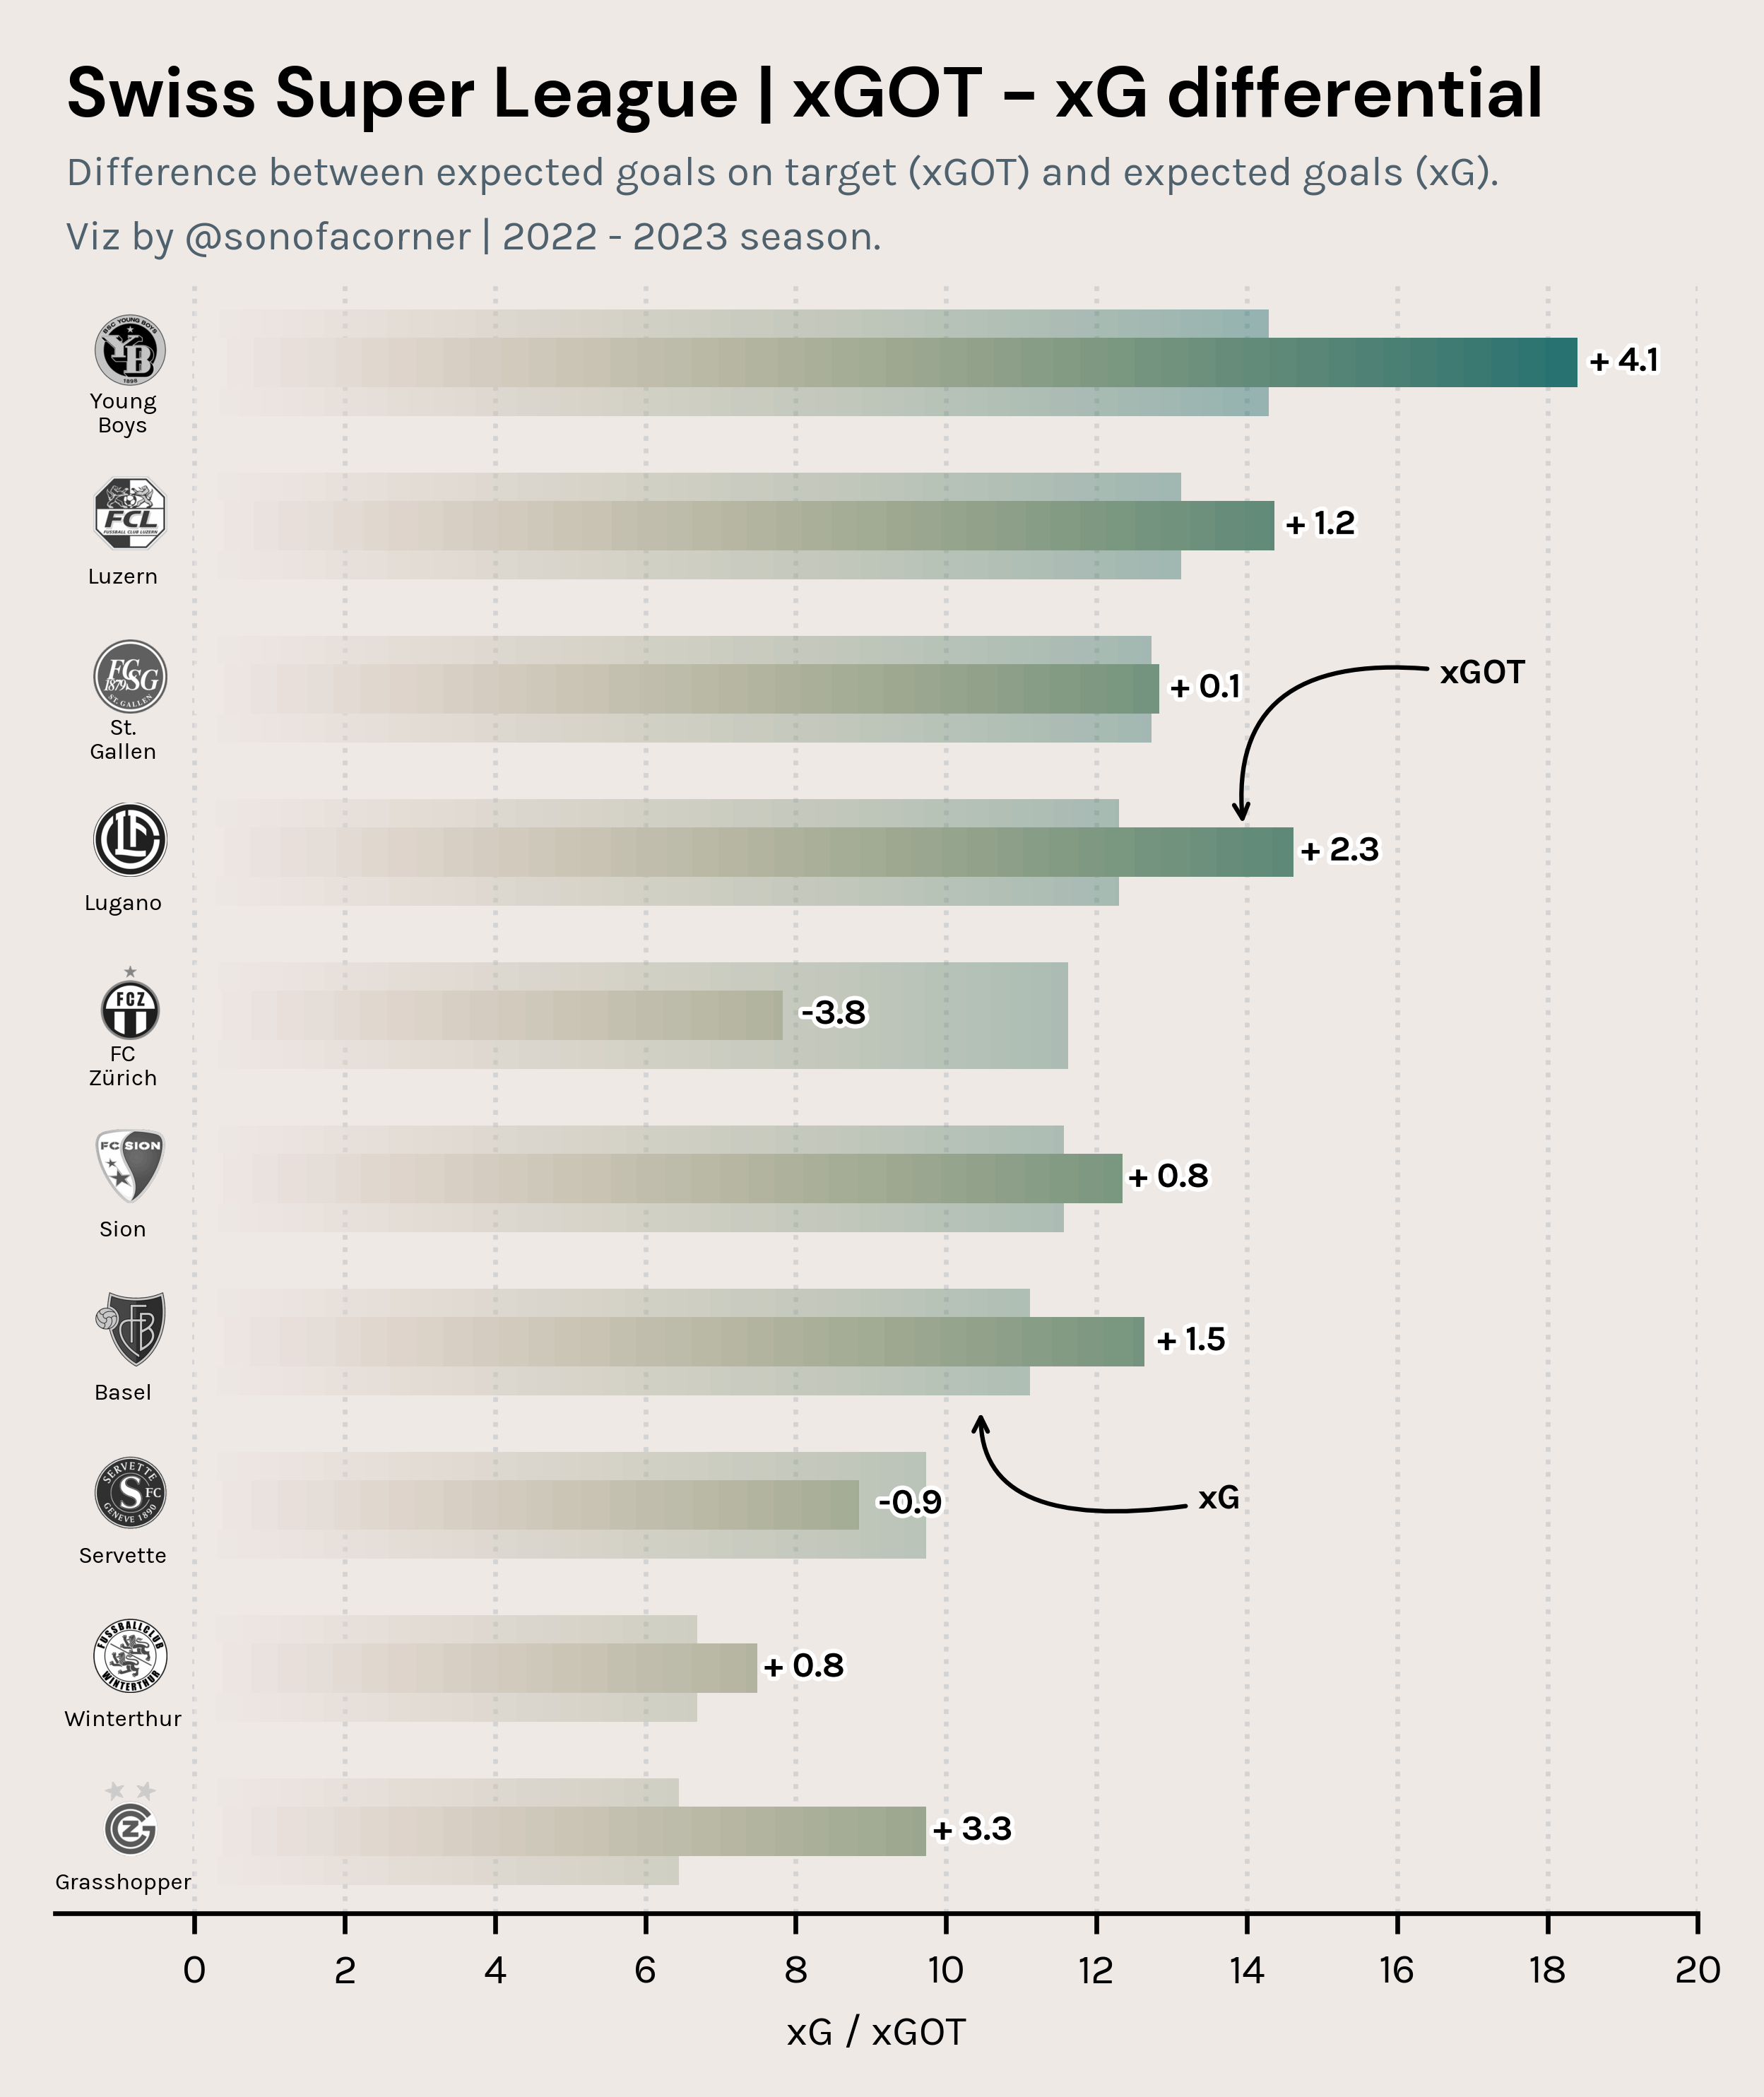
- Swiss Super League | xGOT - xG Differential (09122022)
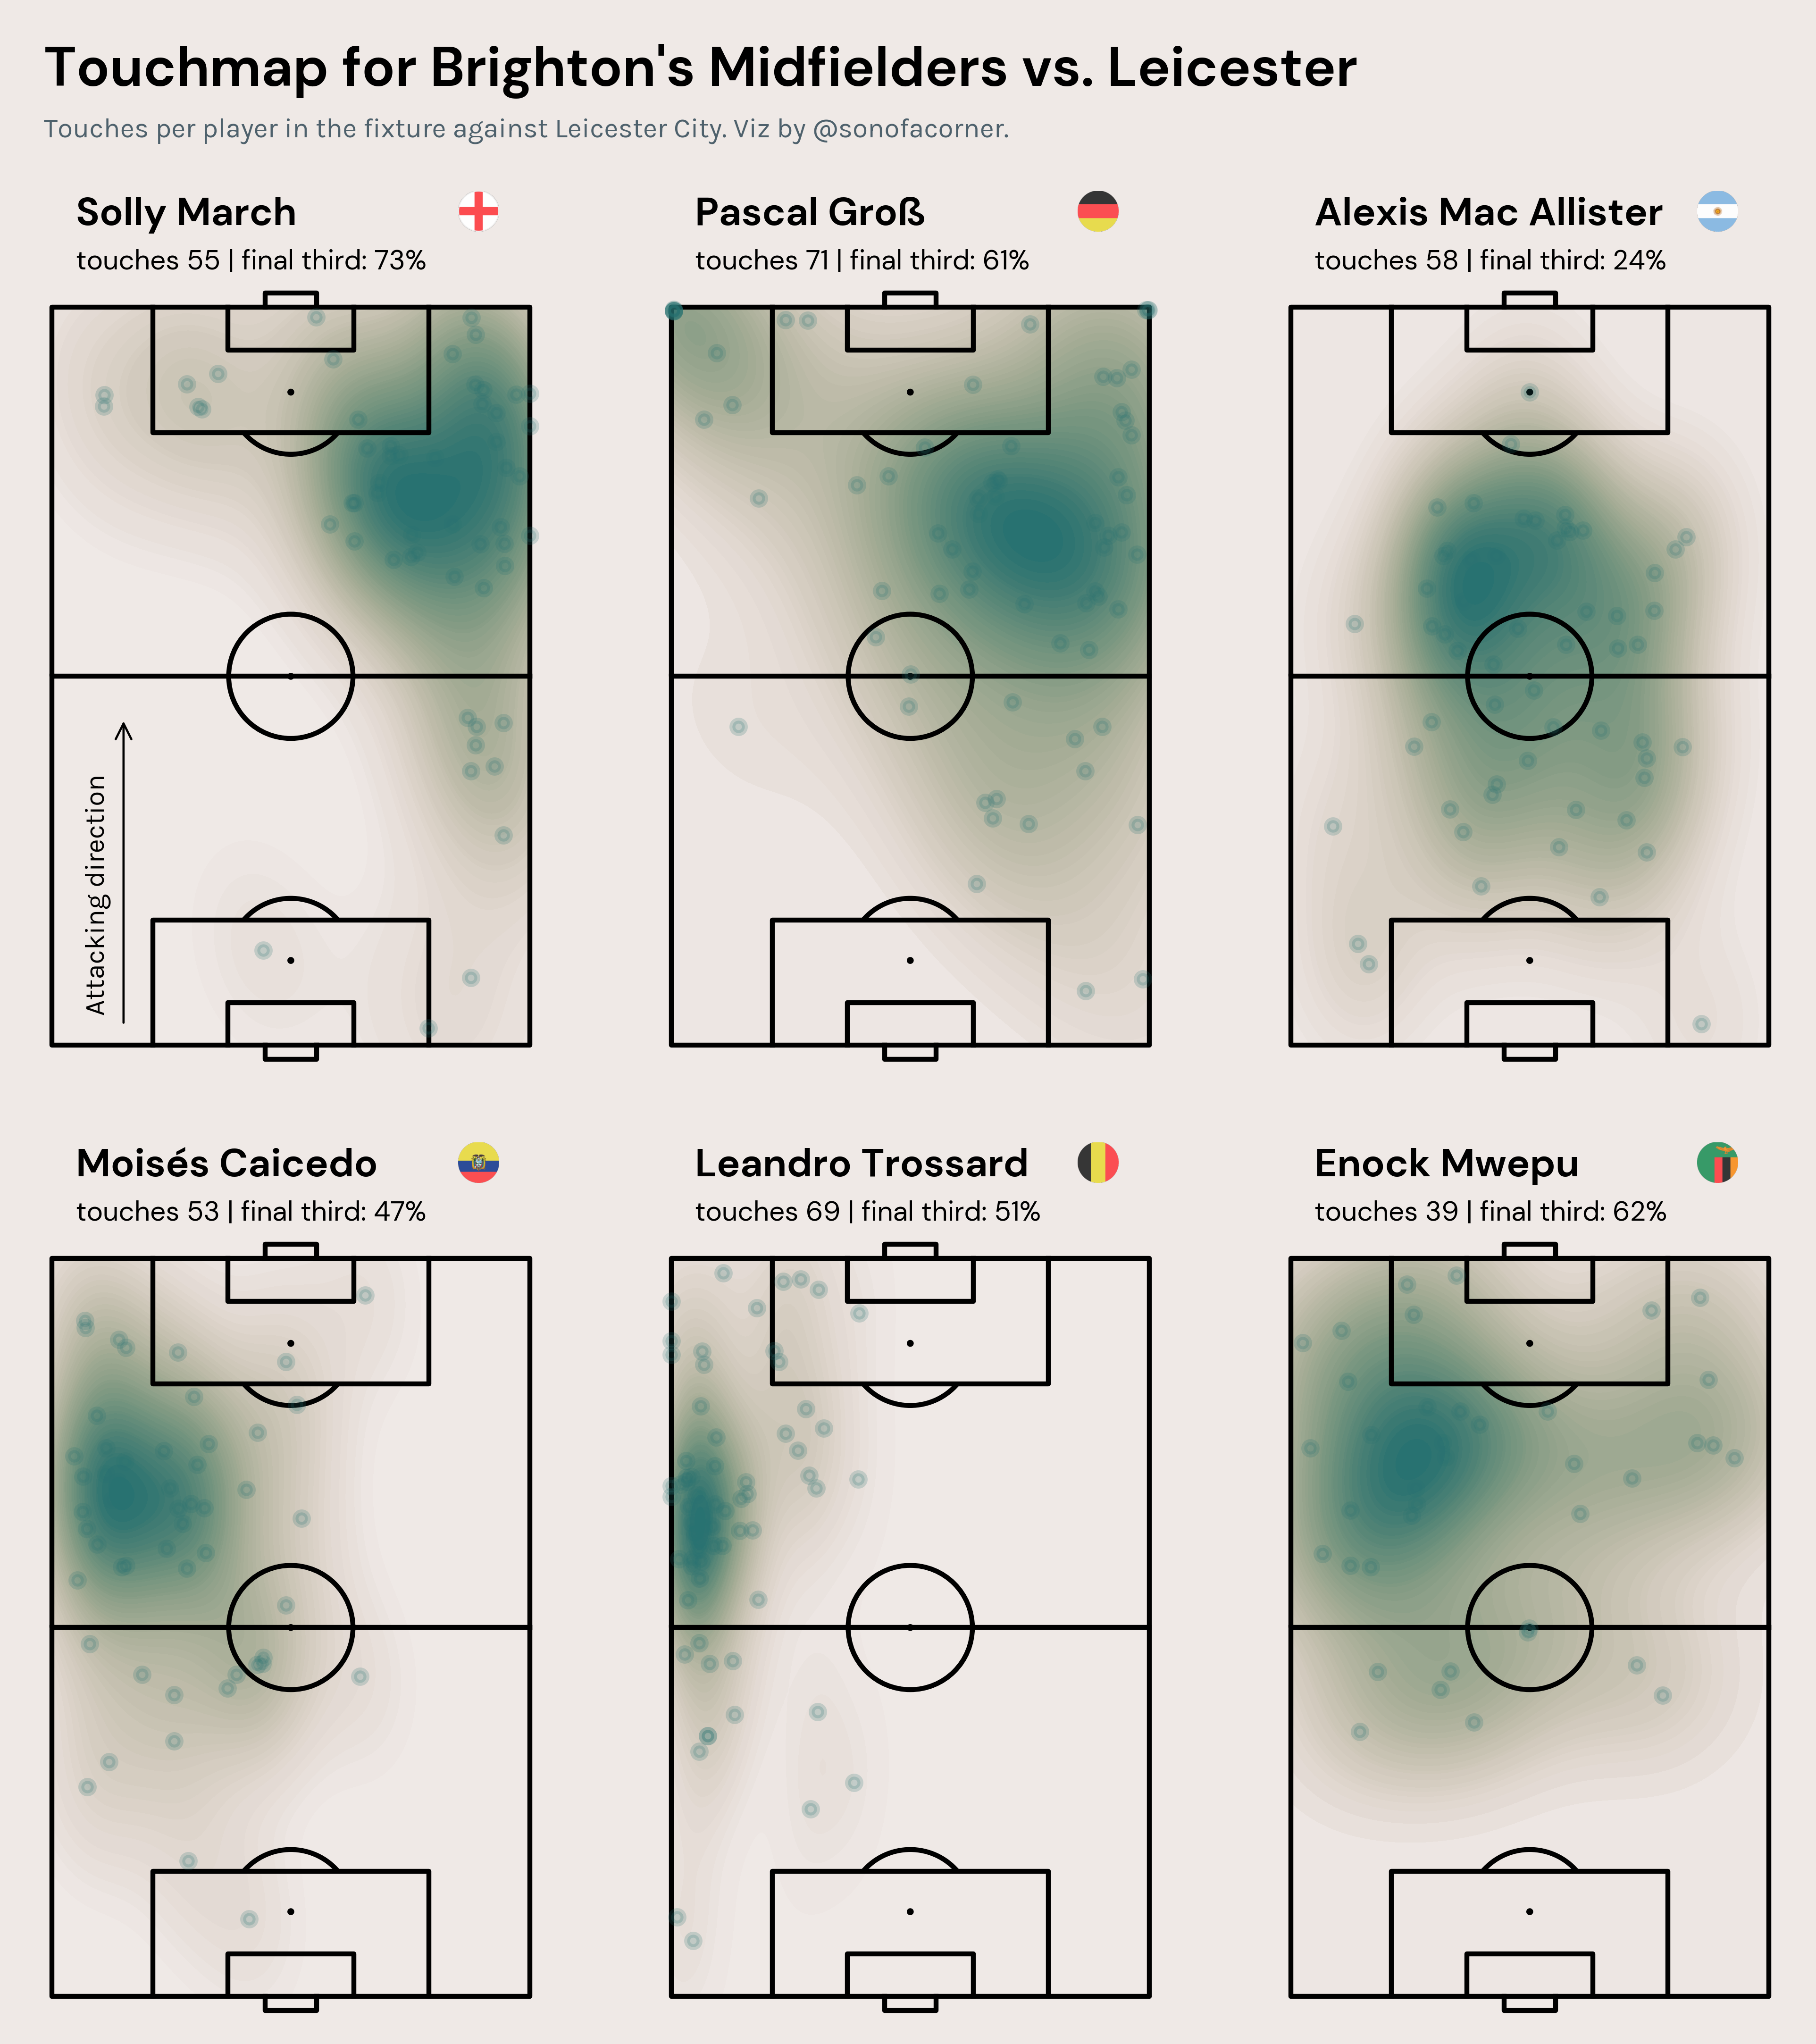
- Brighton's Touchmap vs. Leicester (09052022)
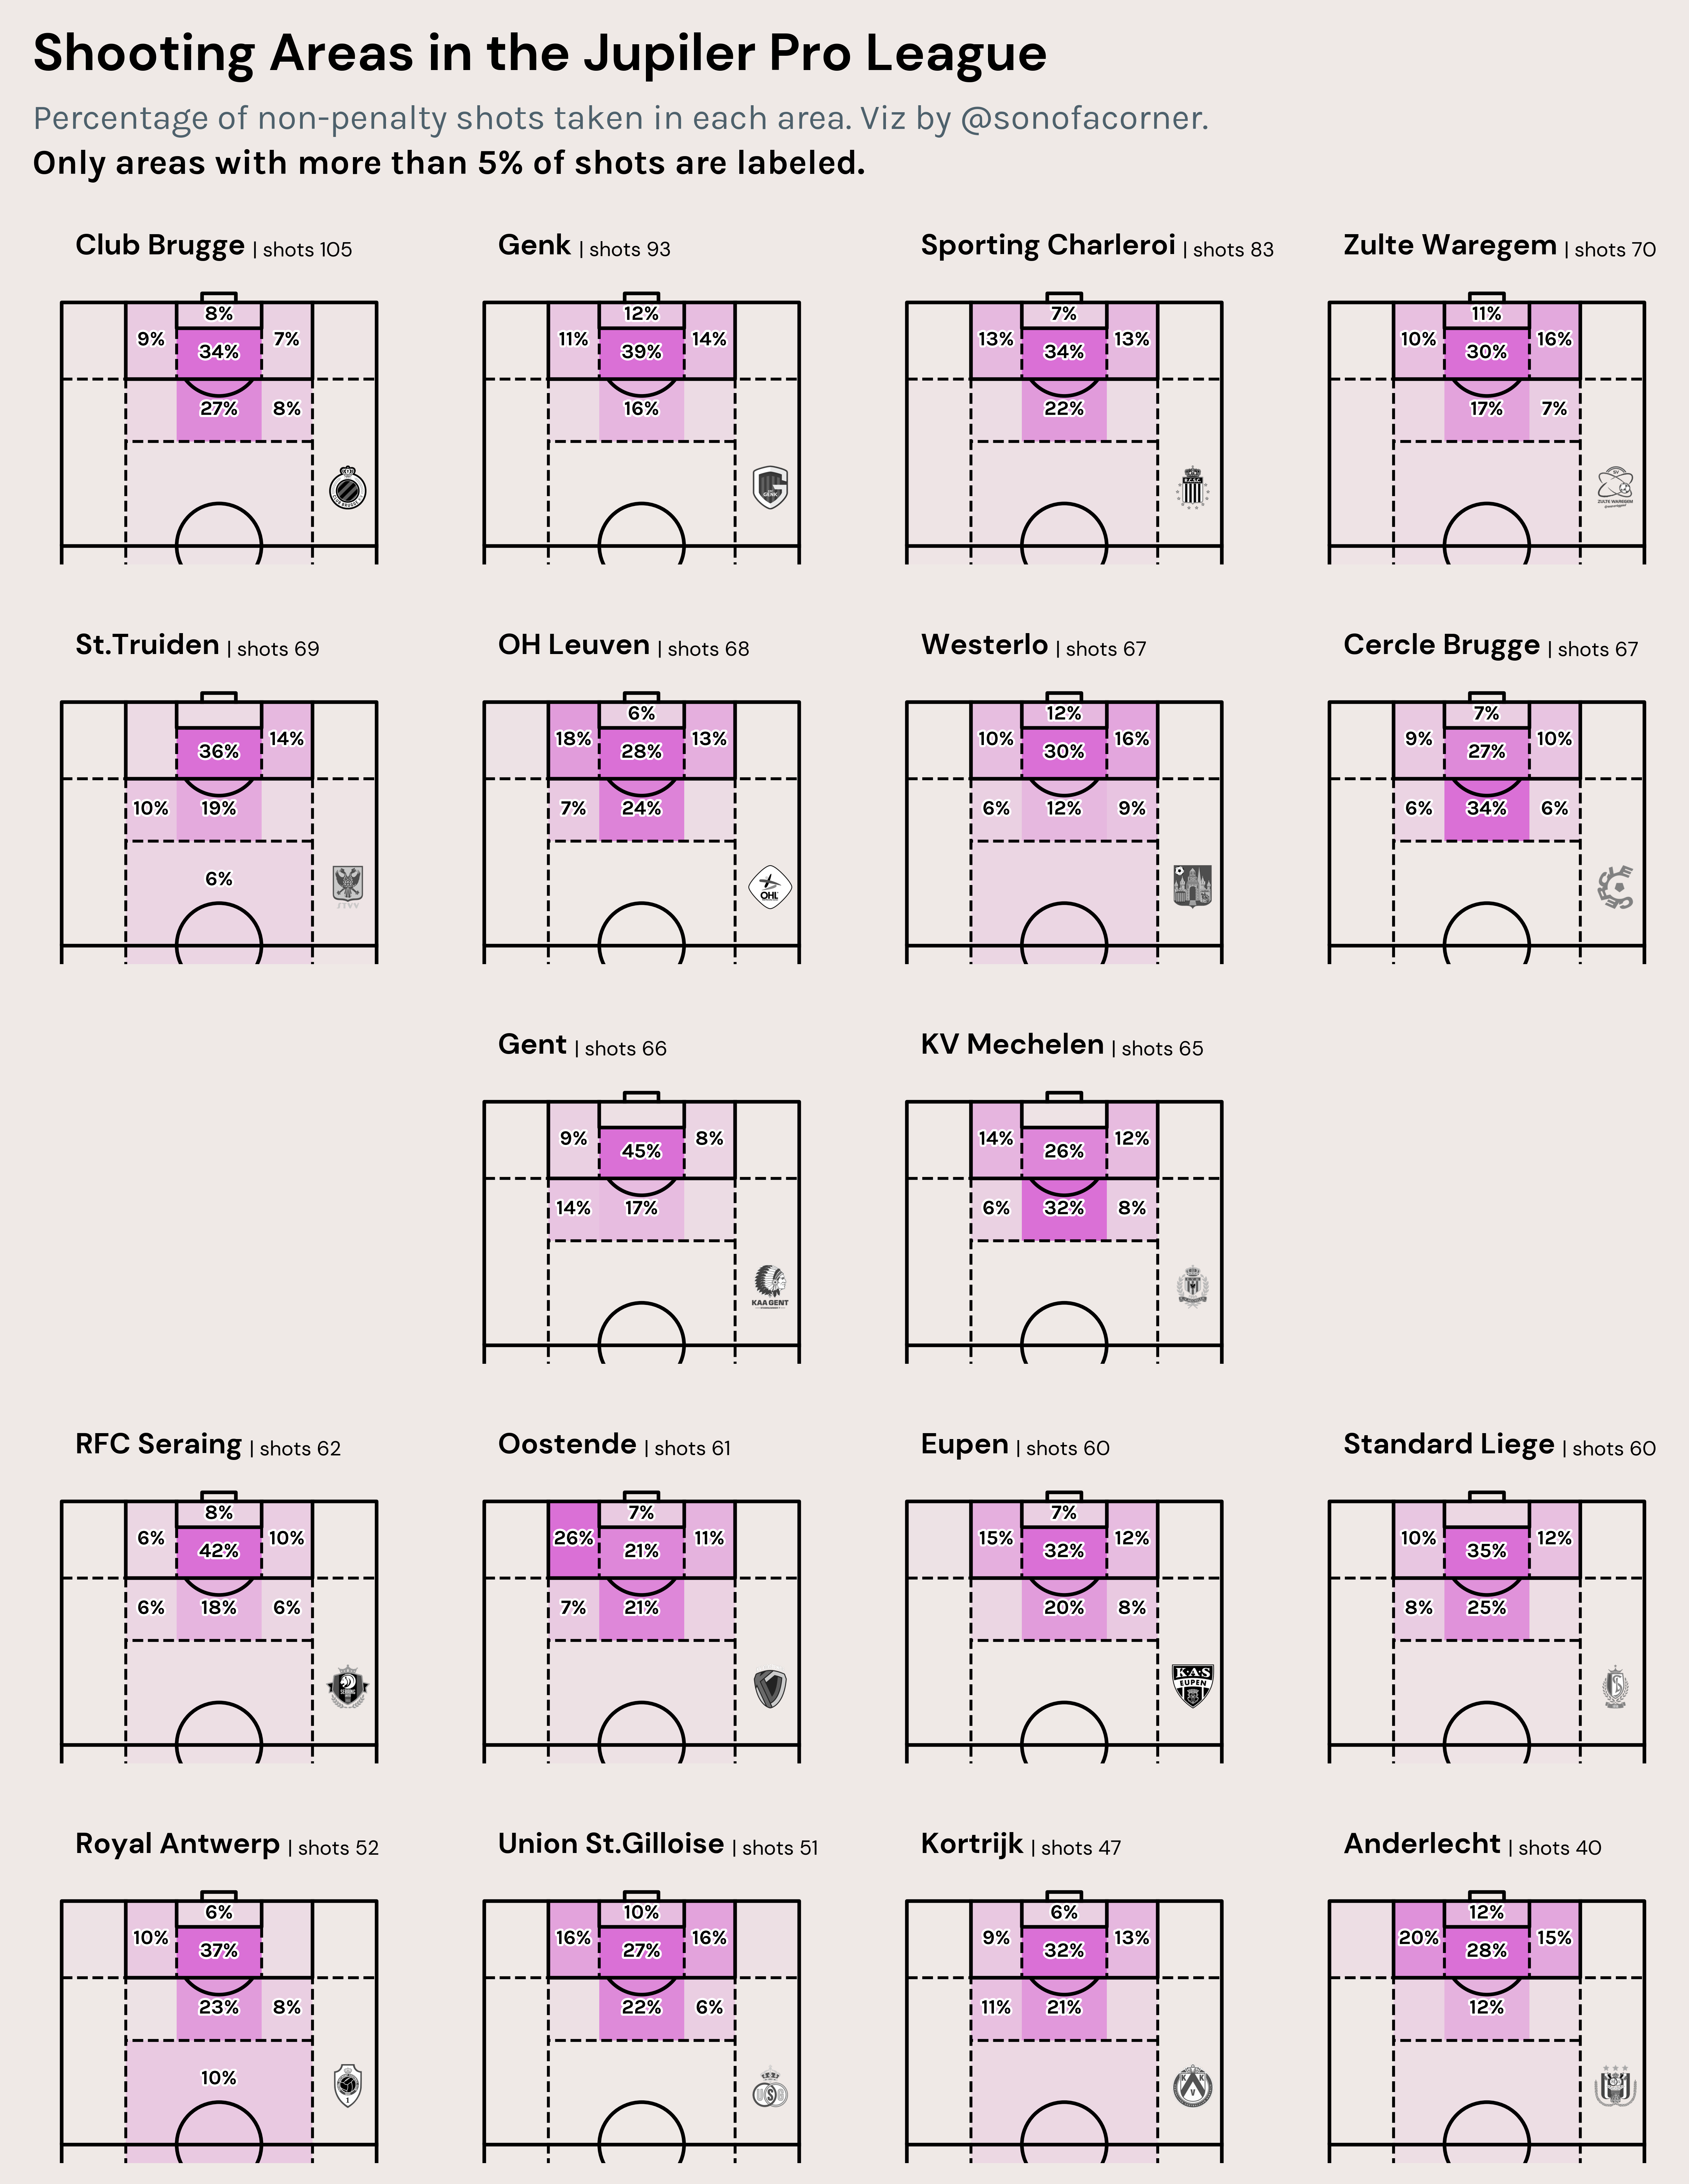
- Shooting Areas in the Jupiler Pro League (08292022)
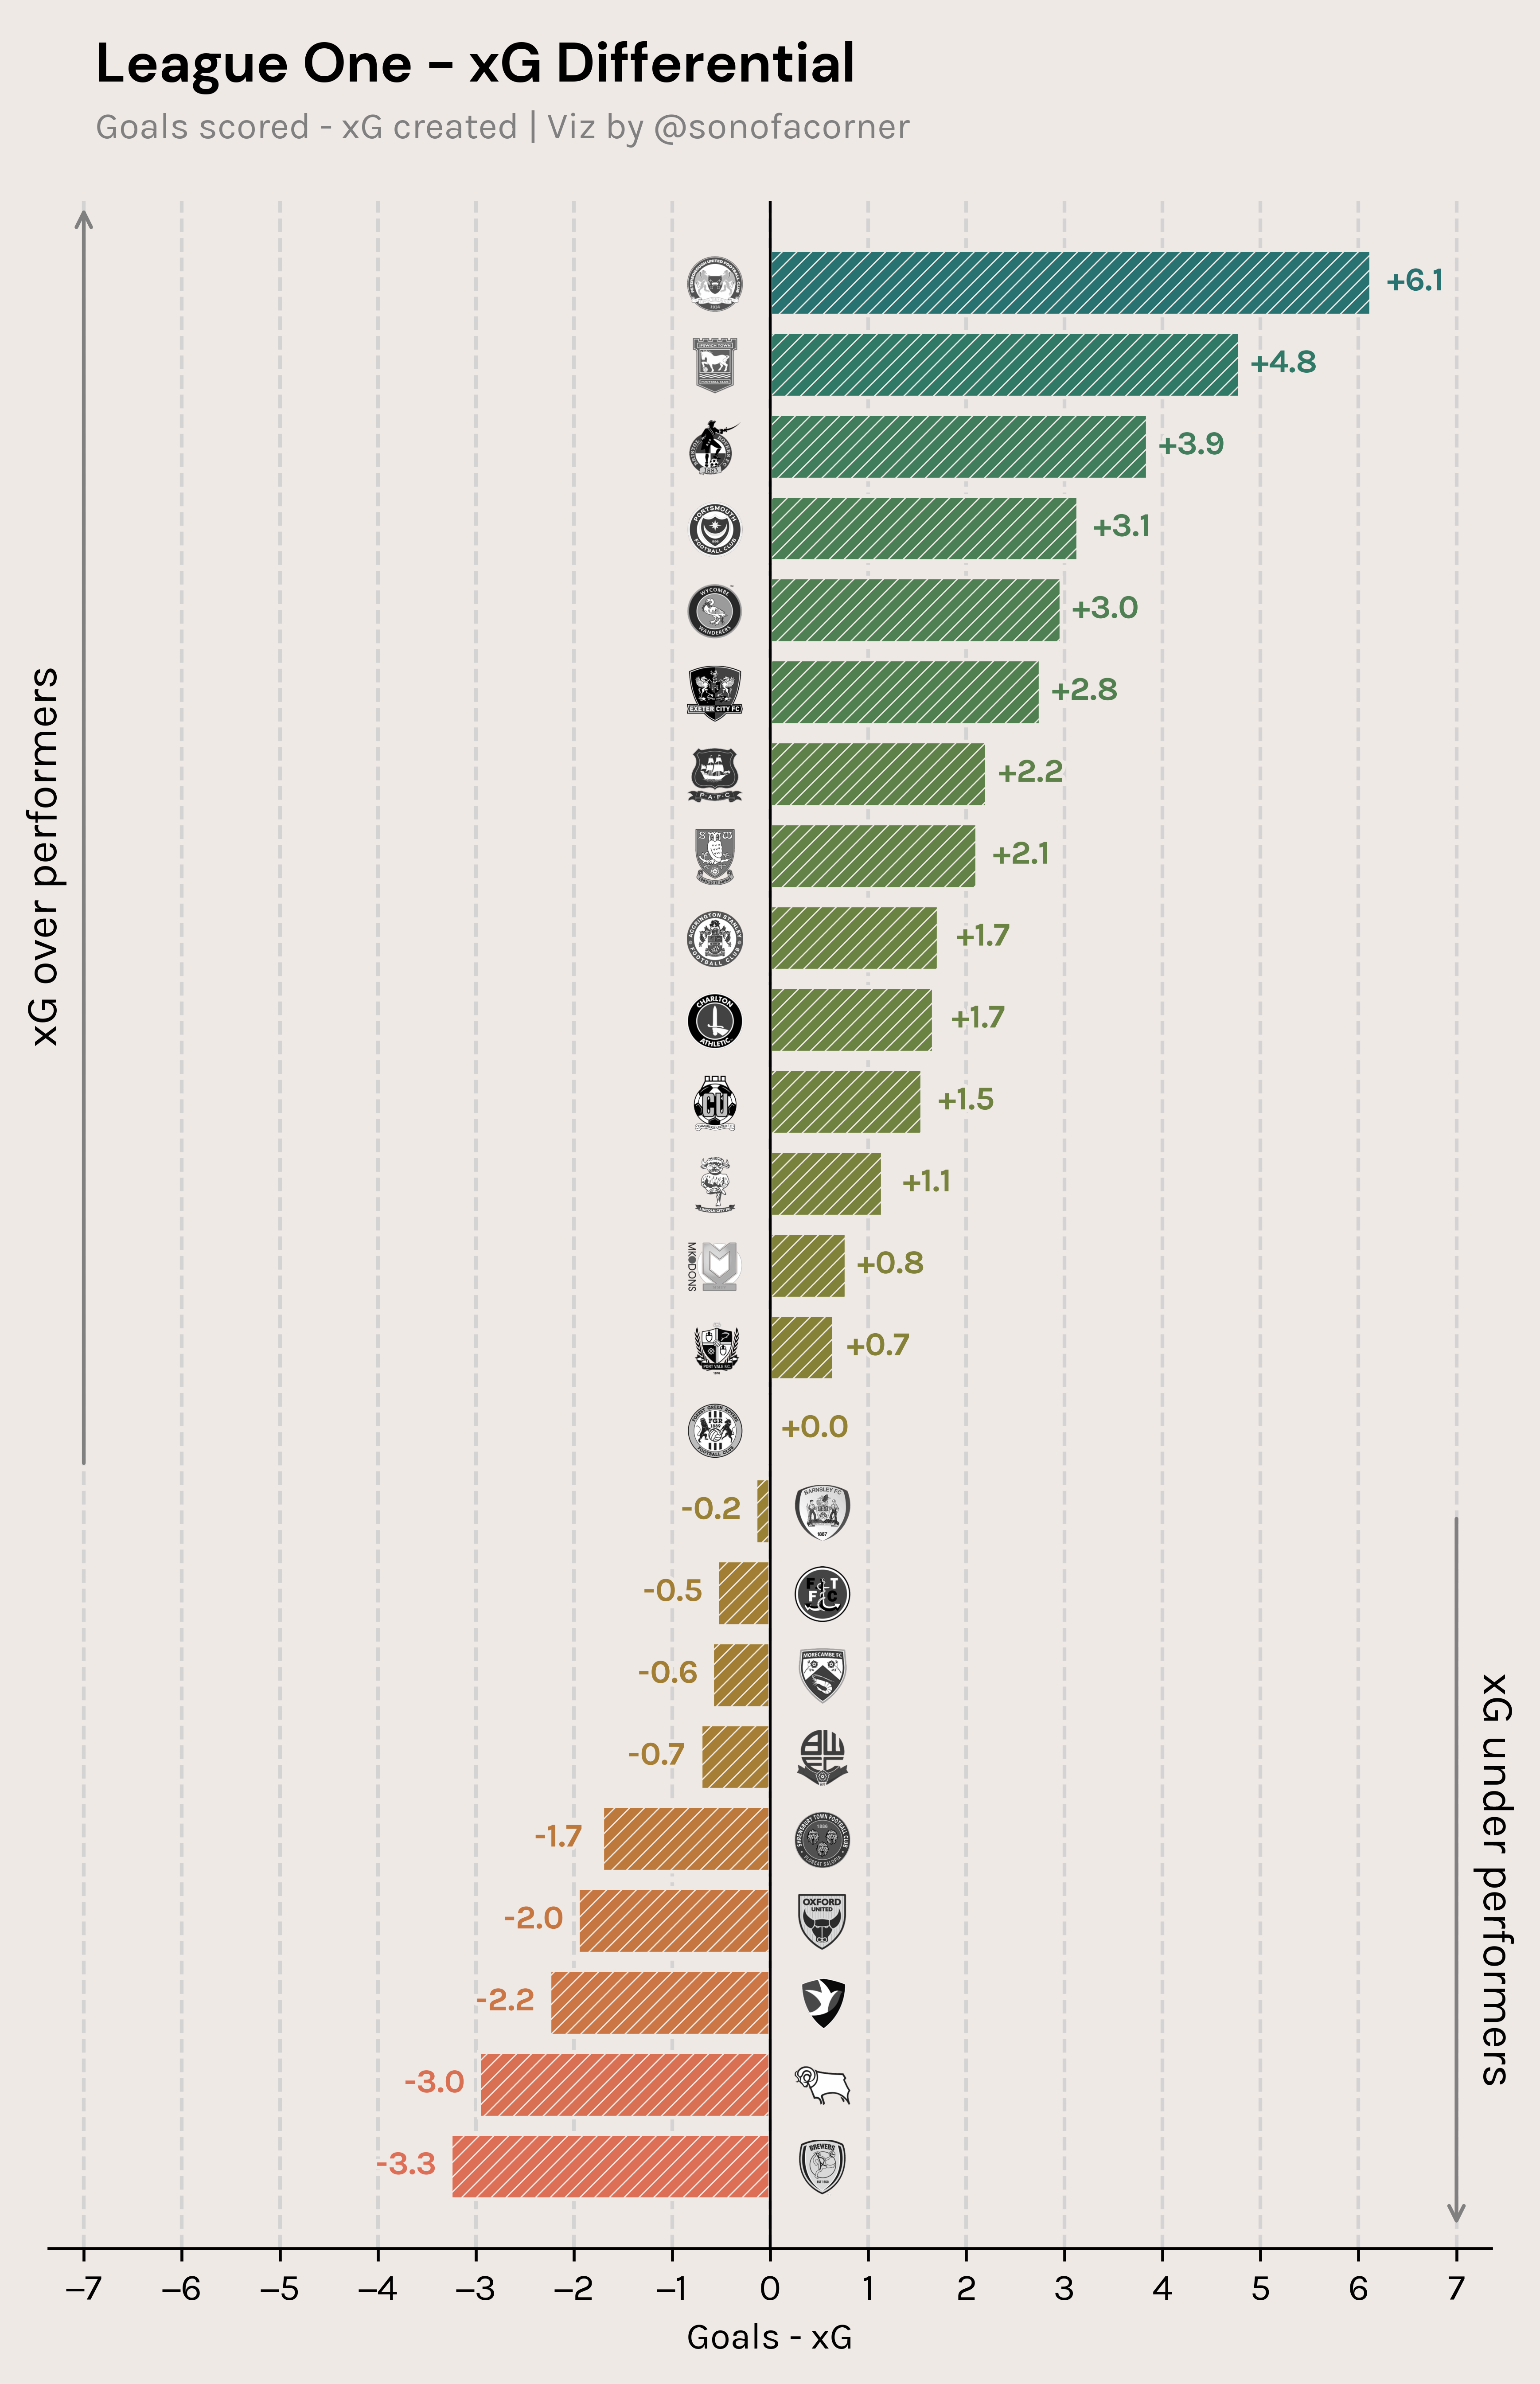
- League One - xG Differential (08222022)
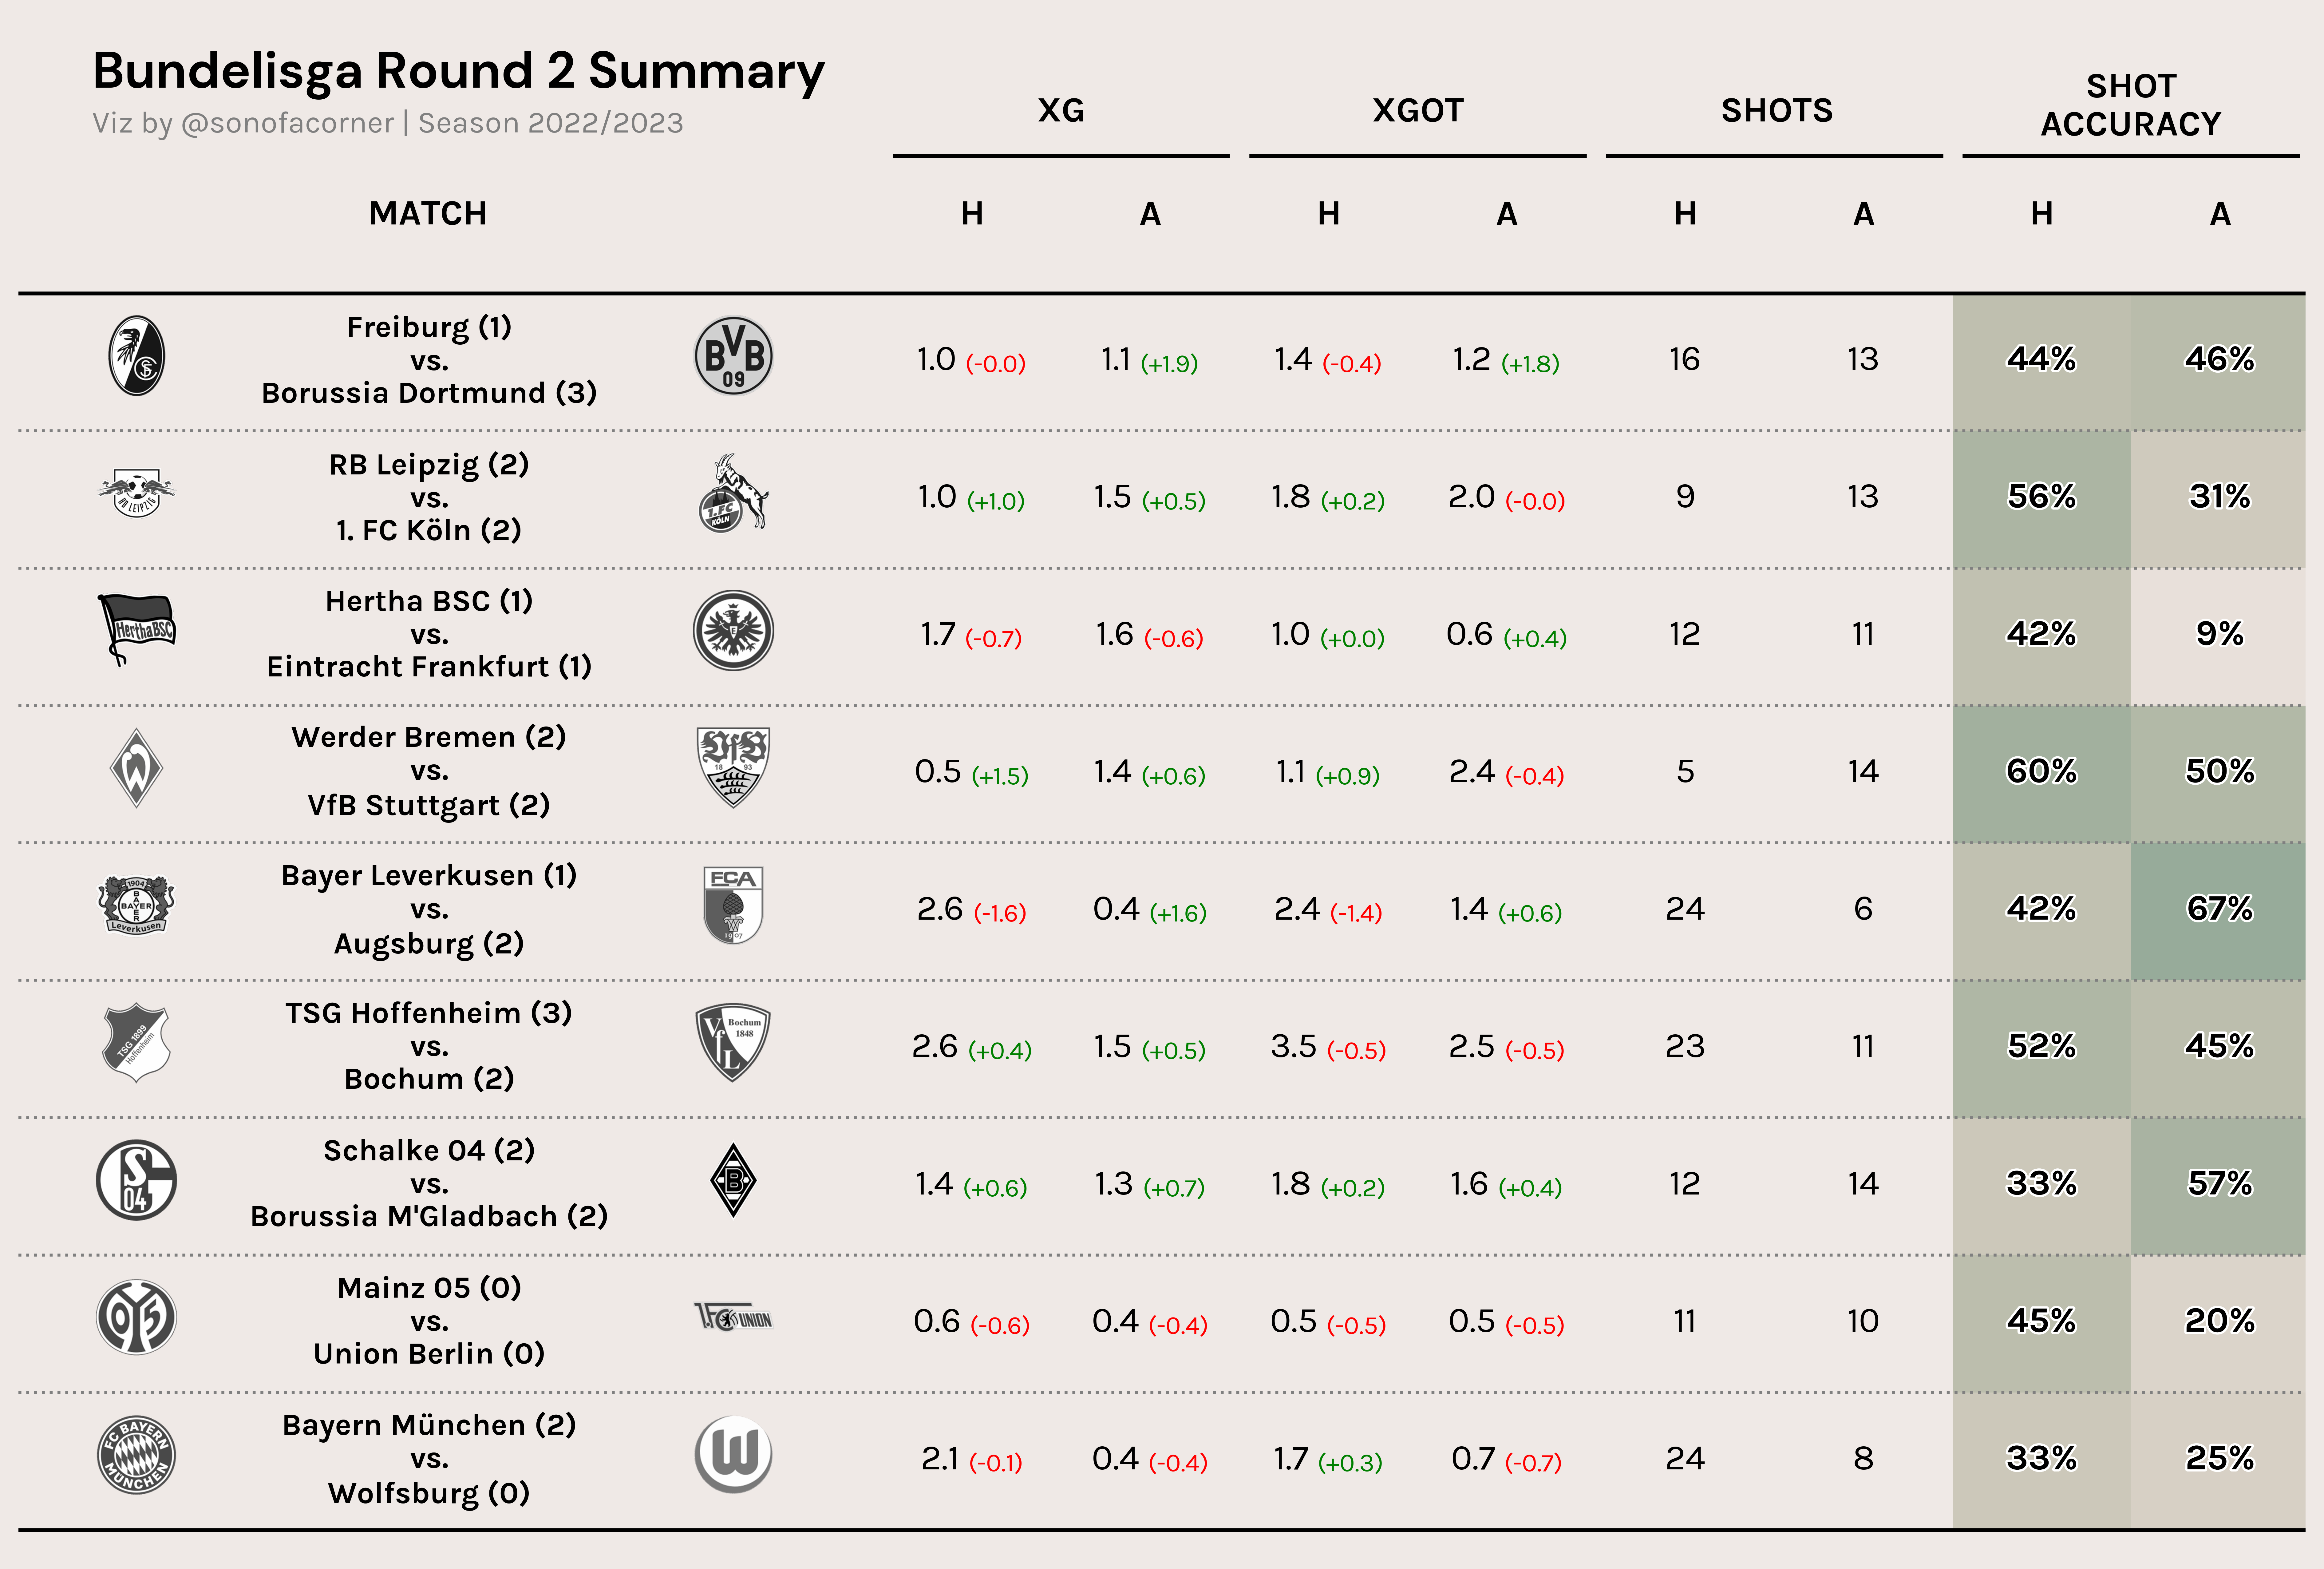
- Bundesliga Summary Table (08152022)
This repository contains the code behind the visuals of the Viz of the Week newsletter.
Hope it helps you in creating cool visualizations with matplotlib.
The repository contains fonts and stylesheet files for the visuals created in each of the examples.
To install the same versions of the packages, run the following command.
pip install -r requirements.txt
