Credits to the awesome Denis Toledo
🔍 inspect what's really happening in your broccoli pipeline
there be 🐲 here! The API's and functionality are still be cemented, anything before a 1.0.0 release will be subject to change.
yarn add broccoli-inspector --dev
Currently the middleware is made to work with ember's built in server middleware functionality. The end goal for this project is that this will be built into broccoli directly and will be available out of the box when using broccoli in your projects.
If you are using this to profile and debug an Ember applications build, please add this to the following places.
// server/index.js

module.exports = function (app, info) {
  require('broccoli-inspector/lib/middleware')(app, info);
};
To get FS timing information ensure that you add EMBER_CLI_INSTRUMENTATION=1 running ember serve.
Currently tracking moving this functionality into broccoli here broccolijs/broccoli#461.
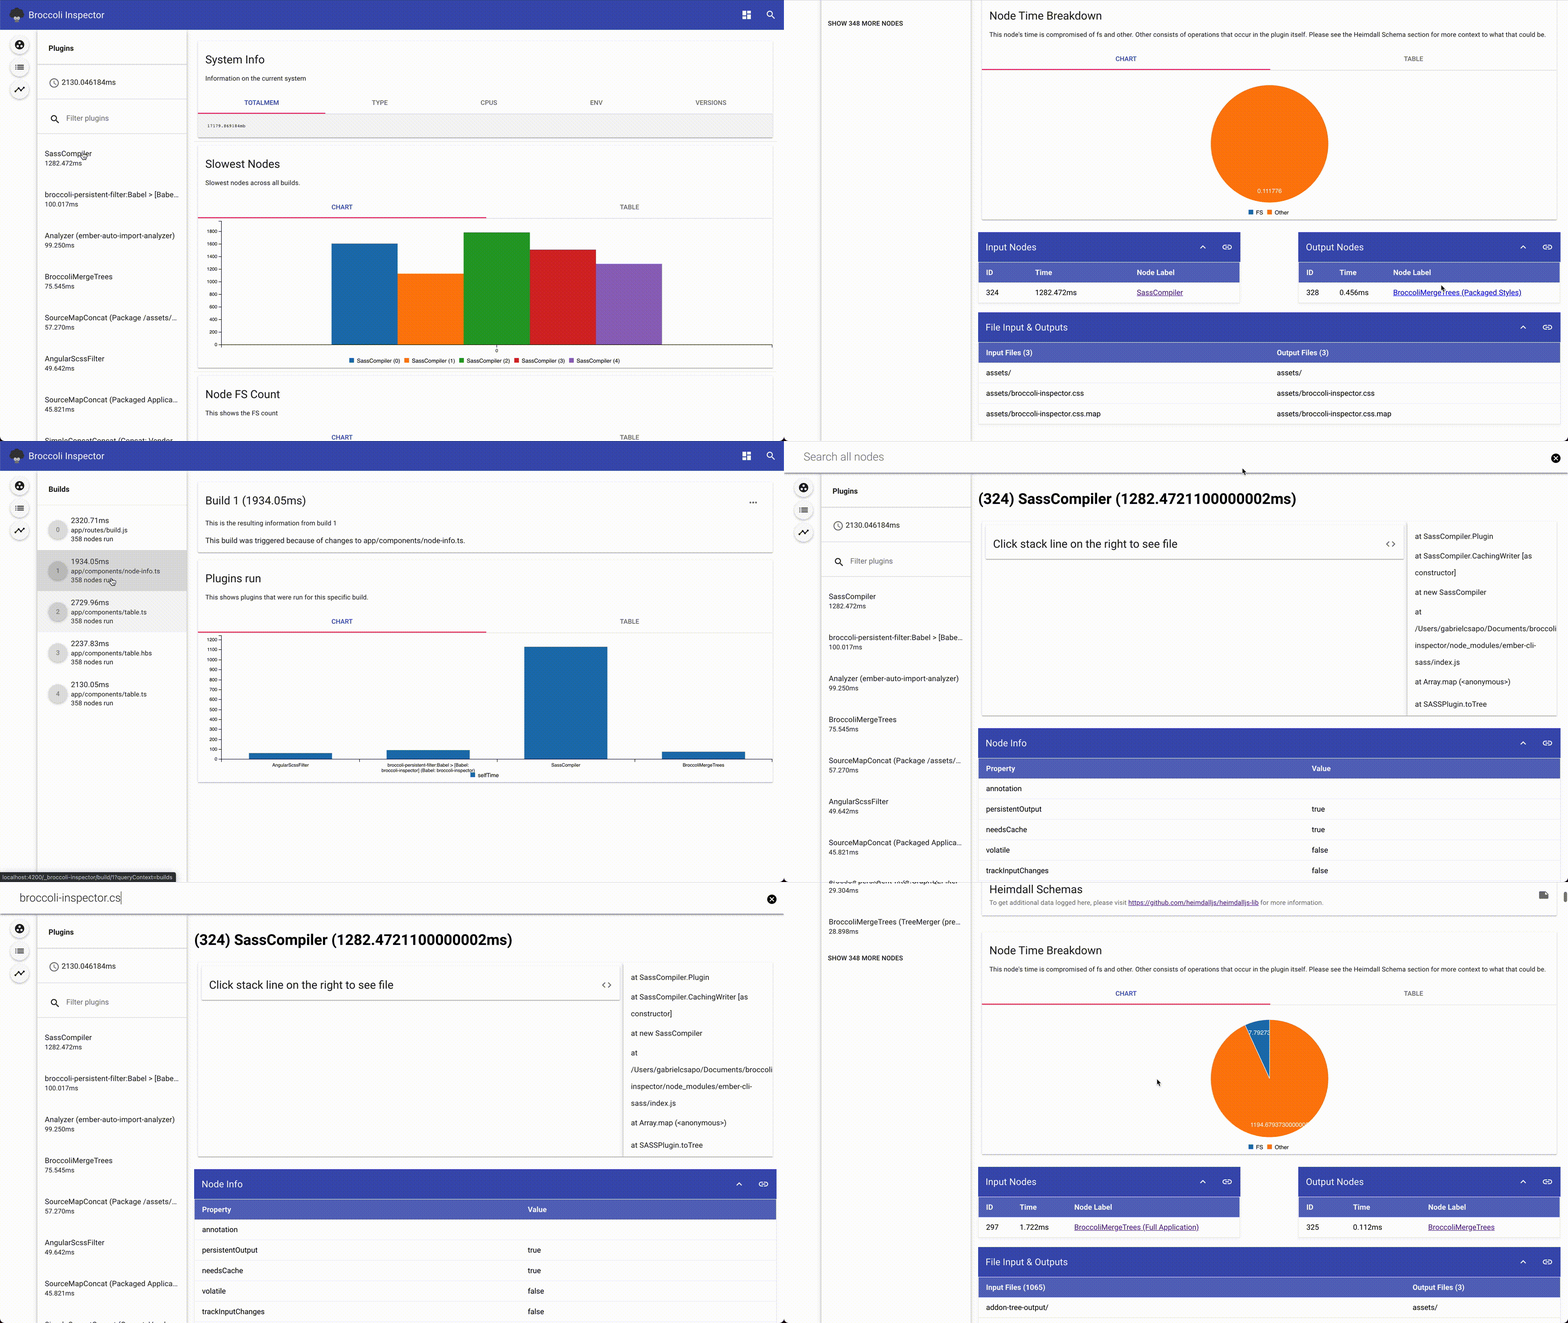
Once you have done the setup done, visit http://localhost:4200/_broccoli-inspector in your browser.
We are leveraging functionality that currently exists in the broccoli nodes themselves. We are using Ember as our UI as we can debug this application with itself!
Ember exposes the broccoli watcher in a middleware through server/index.js, since we are exporting a middleware of our own that takes in an express application and the broccoli builder we are utilizing functionality that exists!
Broccoli inspector consists of three distinct parts:
- A middleware (this can be used wherever there is a running express server and broccoli builder present)
- Broccoli (we are leveraging information broccoli has in it's builder)
- Heimdall (since Heimdall is used as a core logger for broccoli we can leverage it's information such as timing and fs data)
As broccoli inspector is meant to give a high level understanding of what is happening in the build. Once you are able to track down a plugin that is potentially worth exploring further, using the data you find and creating benchmarking test cases for that plugin and utilizing nodejs debugging flamegraphs https://nodejs.org/en/docs/guides/diagnostics-flamegraph/ will help bring a better level of understanding to what code paths are causing issues.

