I wanted to demonstrate the power of structured logging and illustrate some of the goodness of Application Insights (such as correlation across services and application map).
To see what I'll be working on next, head to the Trello board.
- Application Insights configuration
- Enhance logging
- A demo running in Azure App Service
- A demo running locally
- Results in Application Insights portal
- Create an Application Insights resource (for the local demo)
- Install .NET Core SDK 2.2.102
- Install Docker (optional)
The following points are my personal preferences only. I wrote more about logging in this guide. Feel free to ignore these principles if they do not apply to your situation.
- Logging should be wired up as early as possible to capture configuration issues (Serilog.AspNetCore instructions)
- Use
Microsoft.Extensions.Logging.ILogger<T>instead ofSerilog.ILogger
I'm using the Serilog.Sinks.ApplicationInsights sink.
I recommend sending log event to Application Insights as TraceTelemetry rather than EventTelemetry
Use TrackTrace to help diagnose problems by sending a "breadcrumb trail" to Application Insights. You can send chunks of diagnostic data and inspect them in Diagnostic Search. In .NET Log adapters use this API to send third-party logs to the portal. In Java for Standard loggers like Log4J, Logback use Application Insights Log4j or Logback Appenders to send third-party logs to the portal.
A custom event is a data point that you can display in Metrics Explorer as an aggregated count, and in Diagnostic Search as individual occurrences. (It isn't related to MVC or other framework "events.") Insert TrackEvent calls in your code to count various events. How often users choose a particular feature, how often they achieve particular goals, or maybe how often they make particular types of mistakes.
To simplify the local configuration, I'm using the Secret Manager. I made it so that all applications share the same UserSecretsId (b645d8b3-b7a2-436e-85af-6d8de9e23bfa). If multiple applications rely on the same secret, you will only need to set this secret once.
To set a secret:
dotnet user-secrets --id b645d8b3-b7a2-436e-85af-6d8de9e23bfa set <secret-name> "<secret-value>"The Application Insights instrumentation key should be stored as a secret. When running locally you can leverage the Secret Manager.
🚨 The Application Insights instrumentation key cannot be rotated.
Note: this is based on the NuGet package Microsoft.ApplicationInsights.AspNetCore 2.5.1. The documentation for Console application is sparse and the integration is more limited than for ASP.NET Core.
Some settings can be set via ASP.NET Core configuration and code while others can only be set via code. If known configuration keys are set they will take precedence over the "normal" configuration keys. This section explains the convoluted default behaviour of Application insights while the next section details what I think is a better approach.
| Code property name | Known configuration key | "Normal" configuration key |
|---|---|---|
AddAutoCollectedMetricExtractor |
N/A | N/A |
ApplicationVersion |
version |
N/A |
DeveloperMode |
APPINSIGHTS_DEVELOPER_MODE |
ApplicationInsights:TelemetryChannel:DeveloperMode |
EnableAdaptiveSampling |
N/A | N/A |
EnableAuthenticationTrackingJavaScript |
N/A | N/A |
EnableDebugLogger |
N/A | N/A |
EnableHeartbeat |
N/A | N/A |
EnableQuickPulseMetricStream |
N/A | N/A |
EndpointAddress |
APPINSIGHTS_ENDPOINTADDRESS |
ApplicationInsights:TelemetryChannel:EndpointAddress |
InstrumentationKey |
APPINSIGHTS_INSTRUMENTATIONKEY |
ApplicationInsights:InstrumentationKey |
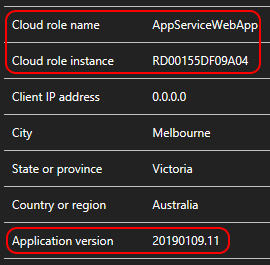
ApplicationVersionwill appear asApplication Versionin the Application Insights portal- Defaults to the value of the entry assembly's VersionAttribute which has some fairly restrictive rules
- Even more relevant if you leverage canary releases as you'll have two different versions of your application serving production traffic at the same time
DeveloperModewill send data immediately, one telemetry item at a time. This reduces the amount of time between the moment when your application tracks telemetry and when it appears on theApplication Insightsportal- If a debugger is attached on process startup, the
SDKwill ignore the configuration keys related toDeveloperModeand turn it on
- If a debugger is attached on process startup, the
EnableAdaptiveSamplingaffects the volume of telemetry sent from your web server app to theApplication Insightsservice endpoint. The volume is adjusted automatically to keep within a specified maximum rate of traffic (documentation).- 🚨 Adaptive sampling is only available for
ASP.NET Corewhere it is turned on by default
- 🚨 Adaptive sampling is only available for
InstrumentationKeyself-explanatory
The most relevant settings require to be configured via configuration and code. The process is cumbersome as:
- When using the configuration (SDK source), only some settings can be set; Namely:
ApplicationVersion,DeveloperMode,EndpointAddressandInstrumentationKey(SDK source). The notable absent here isEnableAdaptiveSampling. - When using the code (SDK source), the
SDKwill instantiate its ownIConfiguration(SDK source) using three providers:appsettings.json,appsettings.{EnvironmentName}.jsonandenvironment variables. If you're leveraging any other providers such as theSecret Manager,Key Vaultor thecommand linethey will be ignored. This will impactInstrumentationKeyas it should be stored as a secret.
I decided to ignore the known configuration keys altogether. I assume they were added to support legacy hosting scenario on Azure. I also focused on providing a uniform API between ASP.NET and Console applications
I wrote an extension method (ASP.NET and Console) that leverages both code and configuration and allows you to set the most relevant settings via configuration.
| Configuration Key | Note |
|---|---|
ApplicationInsights:ApplicationVersion |
Defaults to the InformationalVersion of the entry assembly |
ApplicationInsights:InstrumentationKey |
No default value |
ApplicationInsights:TelemetryChannel:DeveloperMode |
Defaults to false |
ApplicationInsights:TelemetryChannel:StorageFolder |
Required on Unix if you want to to add resiliency to the telemetry channel. Optional on Windows |
ApplicationInsights:EnableAdaptiveSampling |
Available in ASP.NET Core only, defaults to true 🚨 |
Application Insights is persisting telemetry to a temporary directory so that it can retry sending them in case of failure. This works out of the box on Windows but requires some configuration on macOS and Linux:
- Create a directory to hold the telemetry
- The user running
Kestrelneeds to have write access to this directory
- The user running
- Set the configuration key
ApplicationInsights:TelemetryChannel:StorageFolderwith the path of the directory
I disabled the built-in request logging by setting the Microsoft minimum level to Warning and replaced it by RequestLoggingMiddleware.
- Emit a single
Informationevent when the request completes instead of two (one at the beginning and one at the end) - Requests that throw an
Exceptionor return a HTTP status code greater than499are logged asError- Swallow the
Exceptionto avoid duplicate logging ofException
- Swallow the
This demonstrates the capabilities of Application Insights when used in an Azure App Service. The application is composed of:
- A
Web App (ASP.NET Core 2.2)API(SampleApi project) - A
Web Job (.NET Core 2.2 console app)(SampleWorker project) - An
Azure Service Busnamespace with a topic and a subscription to allow theWeb Appto delegate some tasks to theWeb Job
You'll need to configure the following secrets when running locally:
Jwt:SecretKey- used to sign theJWT, should be at least16charactersServiceBus:ConnectionStringApplicationInsights:InstrumentationKey
cd .\template\
.\deploy.ps1 -subscriptionId <subscription-id> -resourceGroupName <resource-group-name> -resourceGroupLocation <resource-group-location>
This will create the resource group if it does not exist and:
- Application Insights
- An Azure Service Bus namespace with a topic and a subscription
- App Service
- Web App
- The Application Insights instrumentation key will be configured as an app settings
- The Topic Sender SAS connection string will be configured as an app settings
- PHP will be turned off
- Will use the 64 bit platform
- ARR will be turned off
Alternatively you can sign-in to Azure and test the deployment. Execute the commands line by line:
Login-AzureRmAccount
Get-AzureRMSubscription
Set-AzureRmContext -SubscriptionID <subscription-id>
# Either test the deployment:
Test-AzureRmResourceGroupDeployment -ResourceGroupName "<resource-group-name>" -TemplateFile .\template.json -TemplateParameterFile .\parameters.json
# Or deploy it:
New-AzureRmResourceGroupDeployment -ResourceGroupName "<resource-group-name>" -TemplateFile .\template.json -TemplateParameterFile .\parameters.jsonI created a Postman collection to get you started.
You will have to overide BaseAddress with the URI of your Azure App Service.
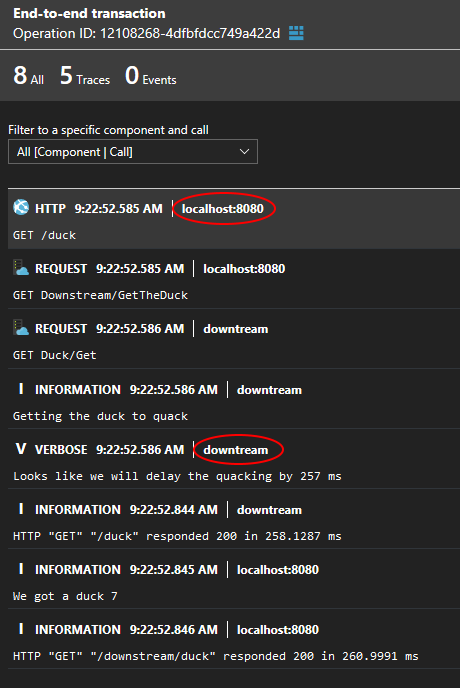
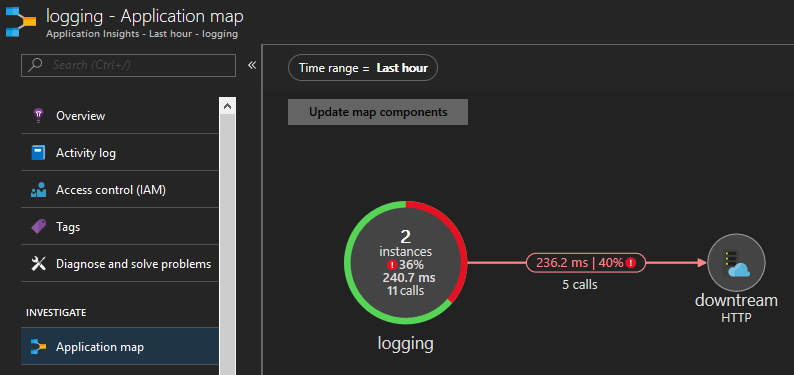
This demonstrates the capabilities of Application Insights when running locally (optionally inside Docker). The application is composed of:
- An upstream (client-facing)
ASP.NET Core 2.2API(Docker.Web project) - A downstream (called by the upstream)
ASP.NET Core 2.2API(Docker.Downstream project)
ApplicationInsights:InstrumentationKey
$Env:ApplicationInsights:InstrumentationKey = "<instrumentation-key>"
docker-compose up -d
Once you're done simply type
docker-compose downI created a Postman collection to get you started.
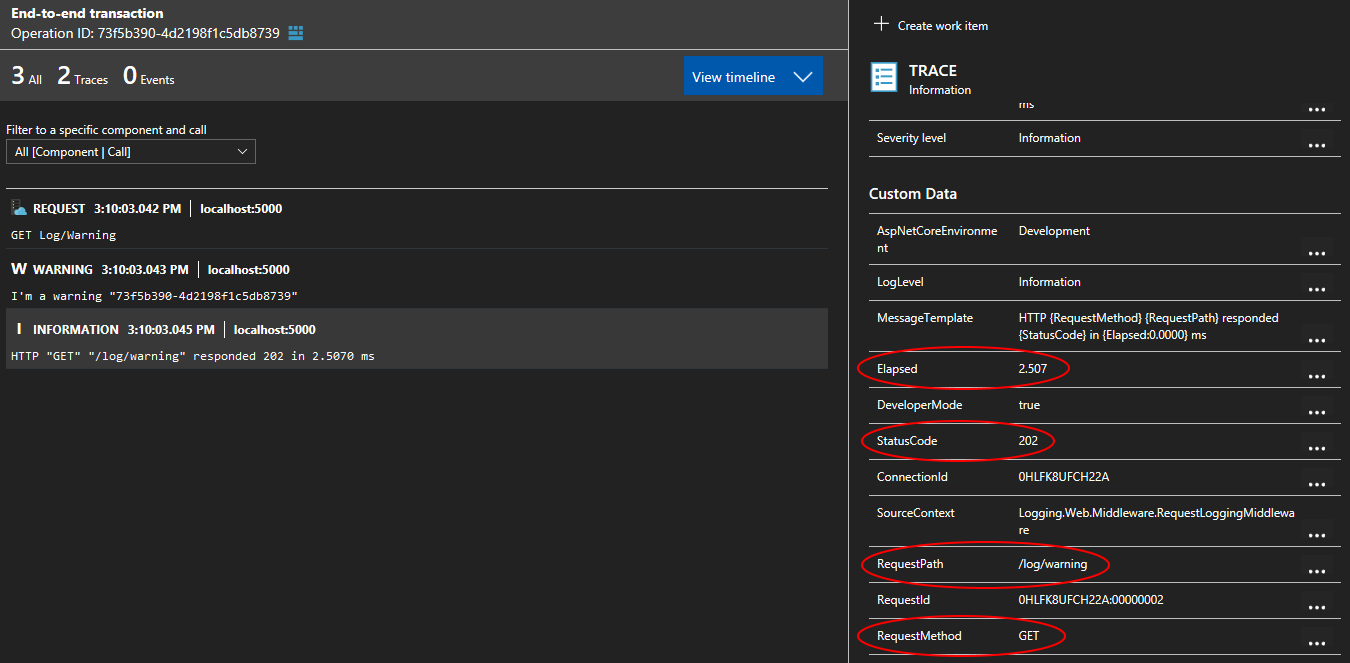
Notice how request properties such as the RequestMethod and StatusCode are recorded as Custom Data. This gives us the ability to query them in the Application Insights and Log Analytics portals.
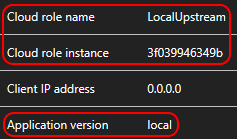
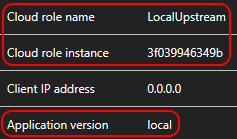
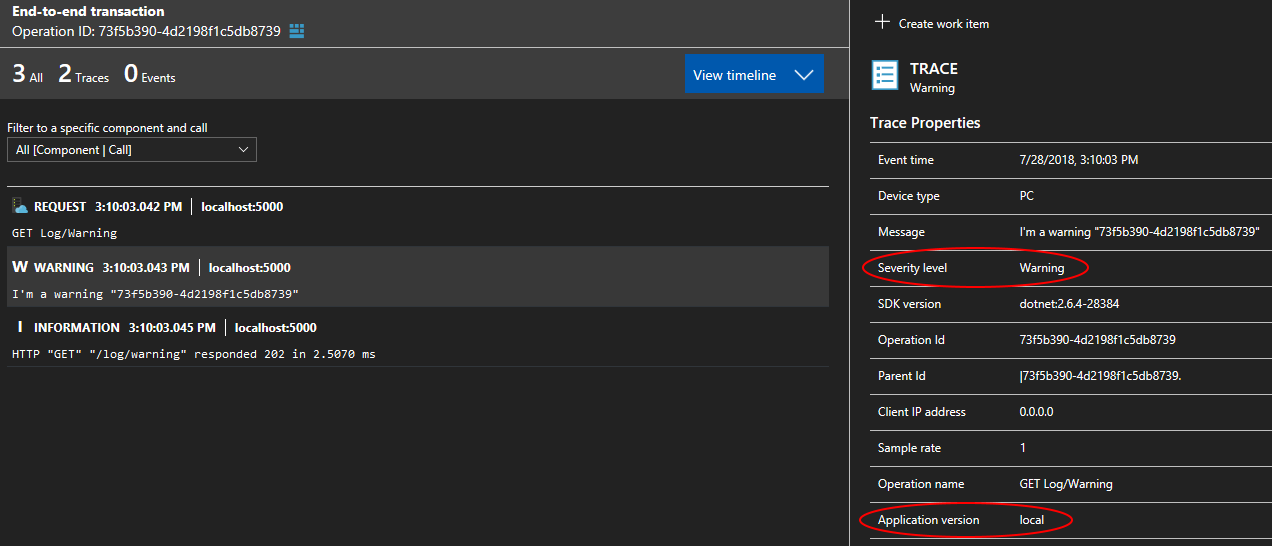
Log events emitted by Serilog are recorded as Traces by Application Insights. The Severity level of Warning has been preserved. The value (local) of the Application version has been read from configuration using an extension method.
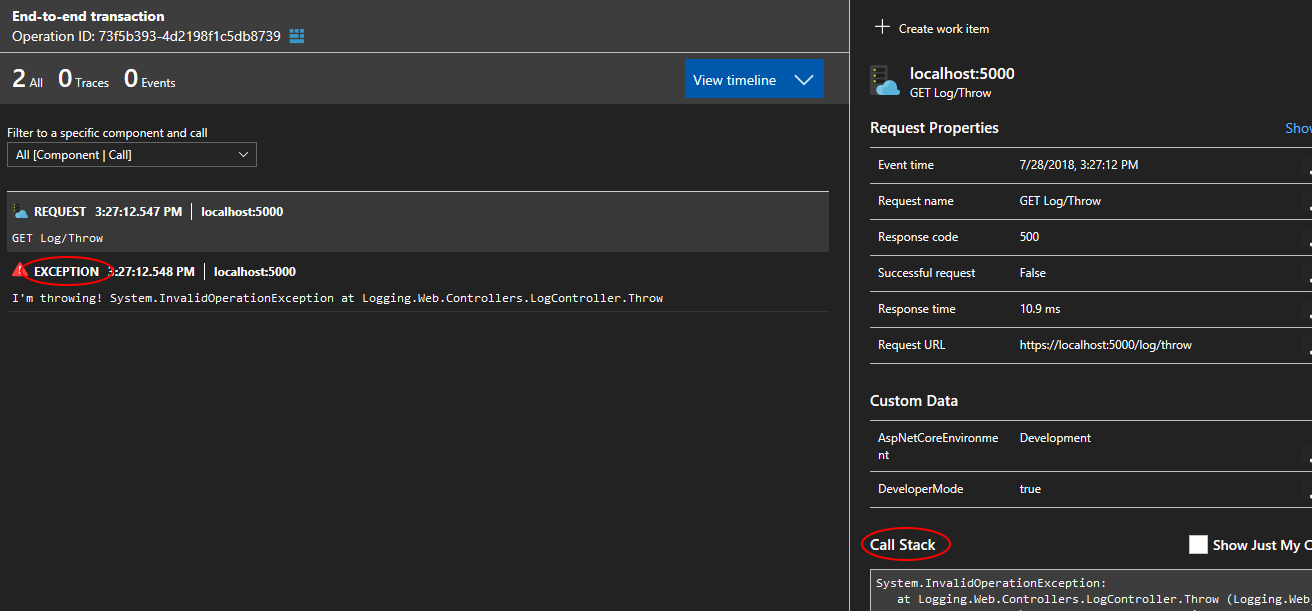
Error log events emitted along with an Exception will be recorded as Exception by Application Insights. The Request recorded by Application Insights will have knowdledge of the Exception and expose the stacktrace.
