gadgetplots
Plot gadget3 model output using ggplot2. R package version 0.1.10
The gadgetplots package produces diagnostics graphics for gadget3 using ggplot2. The package replaces the plotting capabilities of Rgadget package which was designed to work with gadget2.
Installation
The gadgetplots is not available on CRAN yet. Use the devtools or remotes packages to install directly from GitHub:
# install.packages("devtools")
devtools::install_github("gadget-framework/gadgetplots")
Overview of plots
The package produces generally similar plots to
Rgadget. Names and
apperances of these plots have changed somewhat. There are two ways to
produce the plots: either use a specific plot_*() or the generic
plot() with param argument specifying the type of plot.
Load example data to demonstrate the plots:
library(gadgetplots)
data(fit) # Note that we'll need a better example dataset
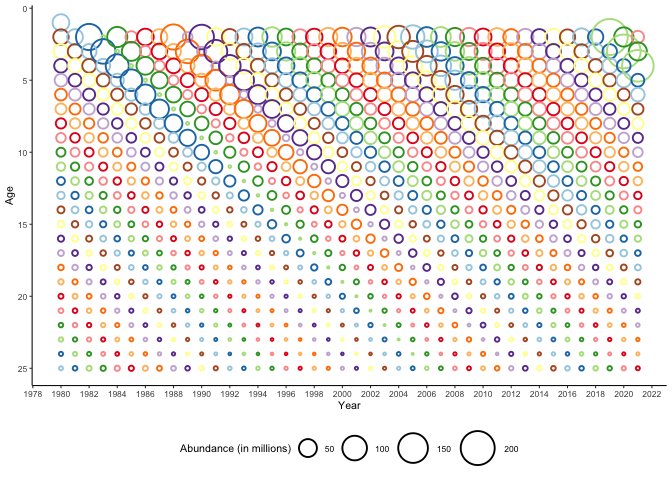
Annual (ICES) plot
plot_annual(fit) # synonym: plot(fit)Stock biomass and abundance
plot_biomass(fit, total = TRUE) # synonym: plot(fit, "total")plot_biomass(fit, geom_area = TRUE) # synonym: plot(fit, "biomass", geom_area = TRUE)plot_biomass(fit, biomass = FALSE) # synonym: plot(fit, "abundance")Spawning stock
Currently requires definition of spawning stock among stocks in the
gadget model (uses a reasonable guess: grep("fem.*mat")). Defining
spawning stock based on length or age from the model is also possible,
but needs to be implemented.
plot_ssb(fit) # synonym: plot(fit, "ssb")Recruitment
plot_rec(fit) # synonym: plot(fit, "rec")Fishing mortality (F)
plot_f(fit) # synonym: plot(fit, "f")Modeled catches and harvest rate
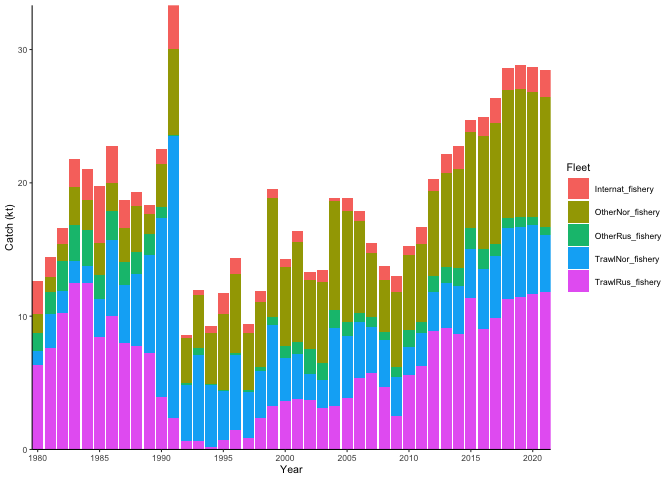
plot_catch(fit, type = "stock") # synonym: plot(fit, "catch")plot_catch(fit, type = "fleet") # synonym: plot(fit, "fleet")plot_catch(fit, type = "hr") # synonym: plot(fit, "hr")Survey indices
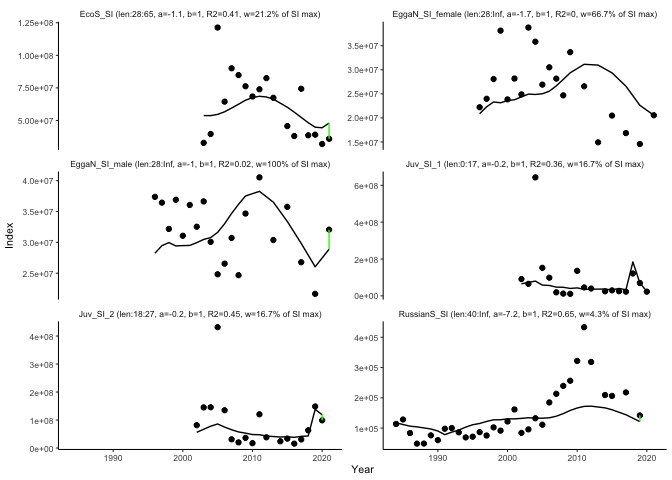
plot_si(fit) # synonym: plot(fit, "si")Catch distribution
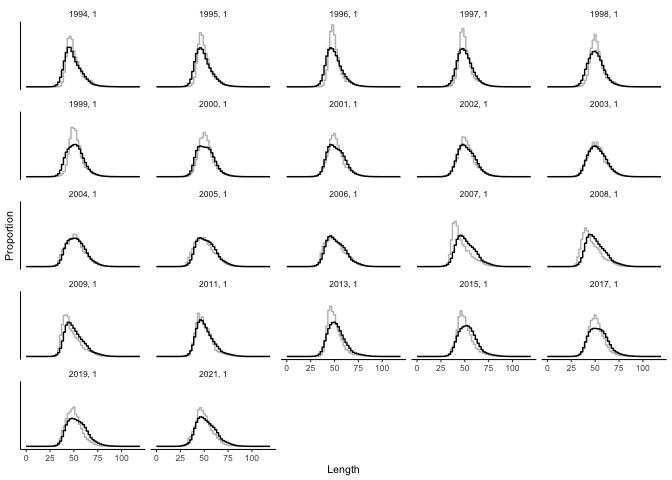
The function typically produces a list of plots. Here only one to save space
plot_catchdist(fit, name = "EggaN_ldist") # synonym: plot(fit, "catchdist")
#> $EggaN_ldist
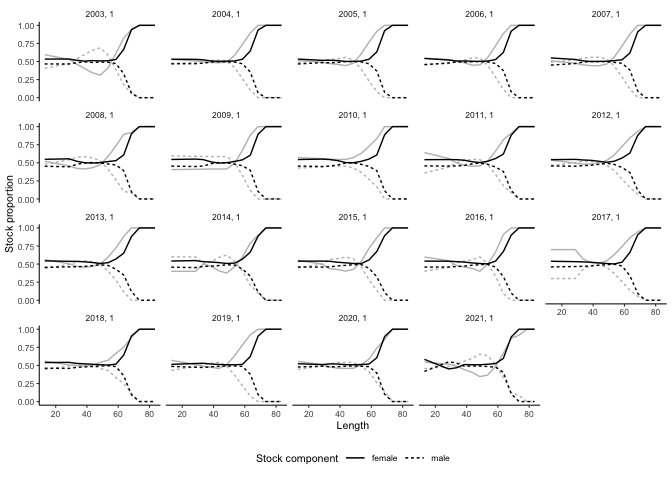
Stock distribution
plot_stockdist(fit) # synonym: plot(fit, "stockdist")Stock composition
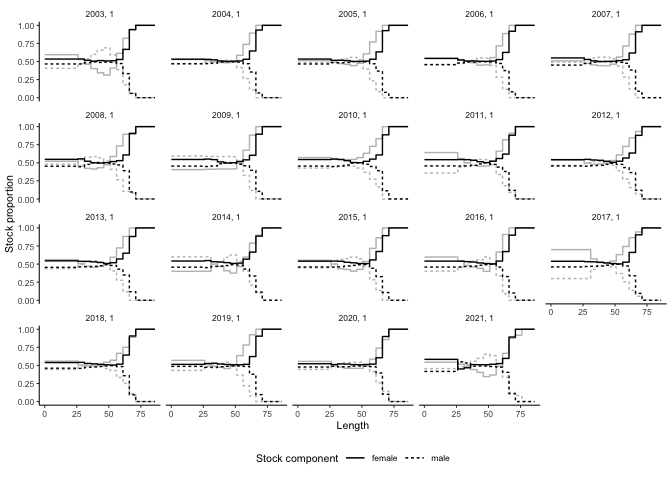
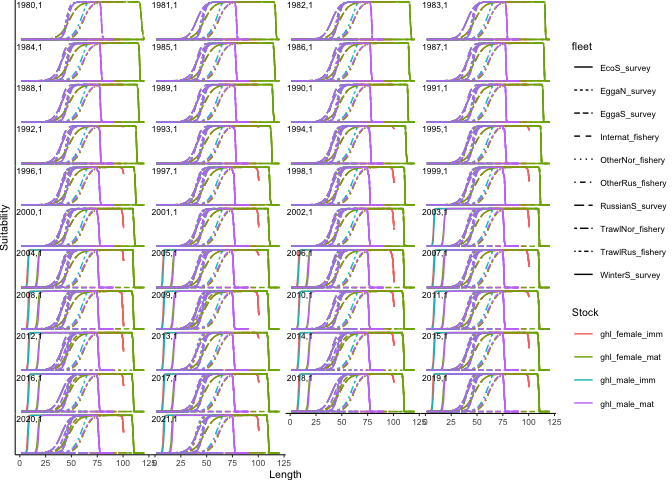
plot_stockdist(fit, type = "stock_composition") # synonym: plot(fit, "stockcomp")Suitability (fleet selection)
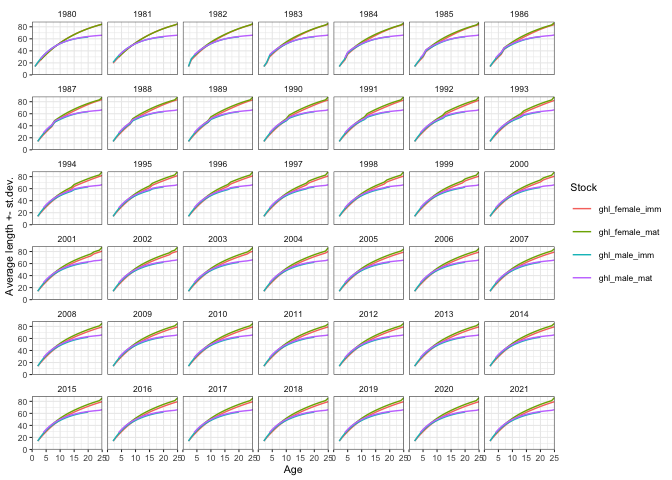
plot_suitability(fit) # synonym: plot(fit, "suitability")Average length by age (growth)
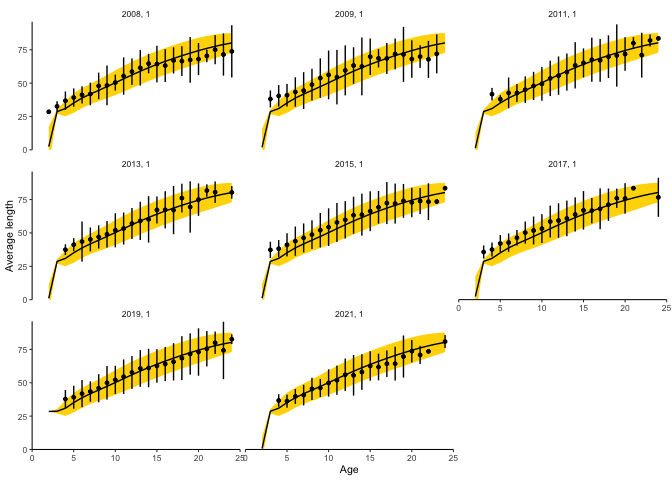
plot_growth(fit) # synonym: plot(fit, "growth")Age-length fit
Returns as many plots as there are separate age-length data sources. Only one plotted here to save space.
plot_agelength(fit, name = "EggaN_aldist_female") # synonym: plot(fit, "agelength")
#> $EggaN_aldist_female
Age composition
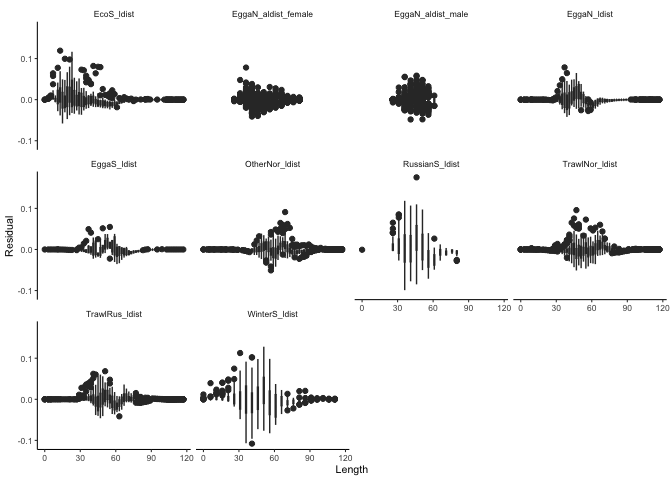
plot_agecomp(fit) # synonym: plot(fit, "agecomp"), also "stock.std" worksResiduals
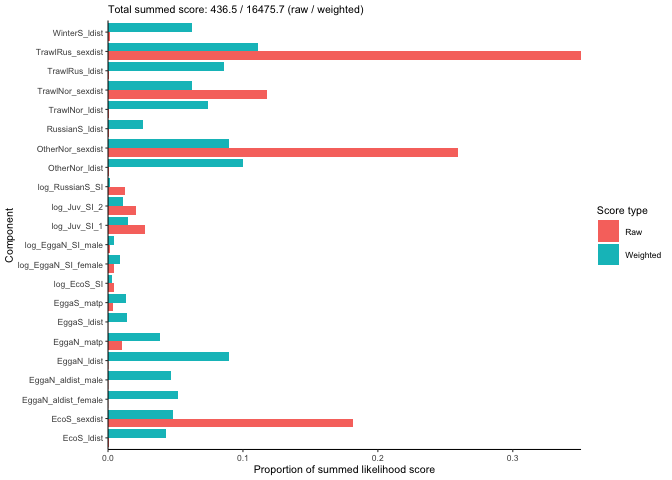
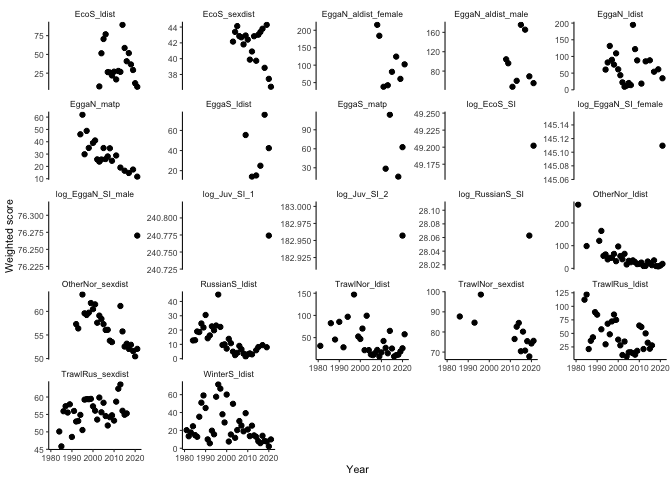
plot_resid(fit) # synonym: plot(fit, "resid")Likelihood
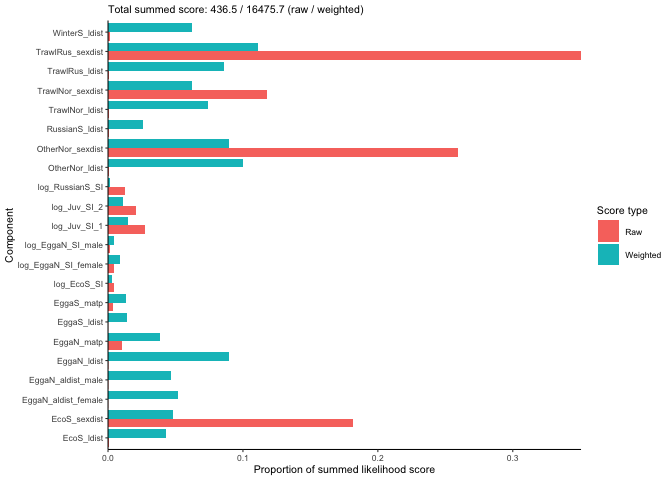
plot_likelihood(fit) # synonym: plot(fit, "likelihood")plot_likelihood(fit, type = "weighted") # synonym: plot(fit, "weighted")plot_likelihood(fit, type = "sums") # synonym: plot(fit, "sums")Parameters
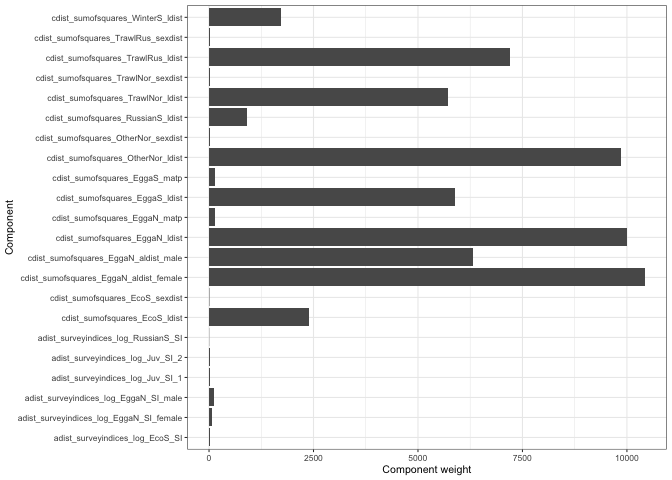
Parameter component weights:
plot_weight(fit) # synonym: plot(fit, "weight")# plot_param(fit) # synonym: plot(fit, "param") # need to add bounds to g3_fitQuickly plot central diagnostics
The gadget_plot() produces a range of diagnostic plots into a folder
specified by the path argument. You may also use the
file_type = "html" argument to save these plots into a single html
file. There is also the make_html() to produce the html file directly
without a wrapper function.
Found a bug or desire a feature?
The package is under an active development together with gadget3 framework. Please report bugs and write feature requests under Issues.


