interlock-models
Intro
This is where we store our models of how the interlock network works. We do our modeling using the tools that we developed to reason about Dynamically Complex Systems (See: https://github.com/interlock-network/knowledgebase/blob/main/what/dynamically-complex-systems.md).
This repository contains 2 main kinds of things: content and code. The code, at the moment, is (a) cadCAD code for running simulations of the model, and (b) Mathematica code for specifying the actual graphical (as in graph theory) model.
The content is basically all supporting text and visuals that describe and explain the model to any interested modellers. The primary examples of this are the various rendered graphs that are nearest approximations of a network of Stock-and-Flow diagrams and Causal-Loop diagrams.
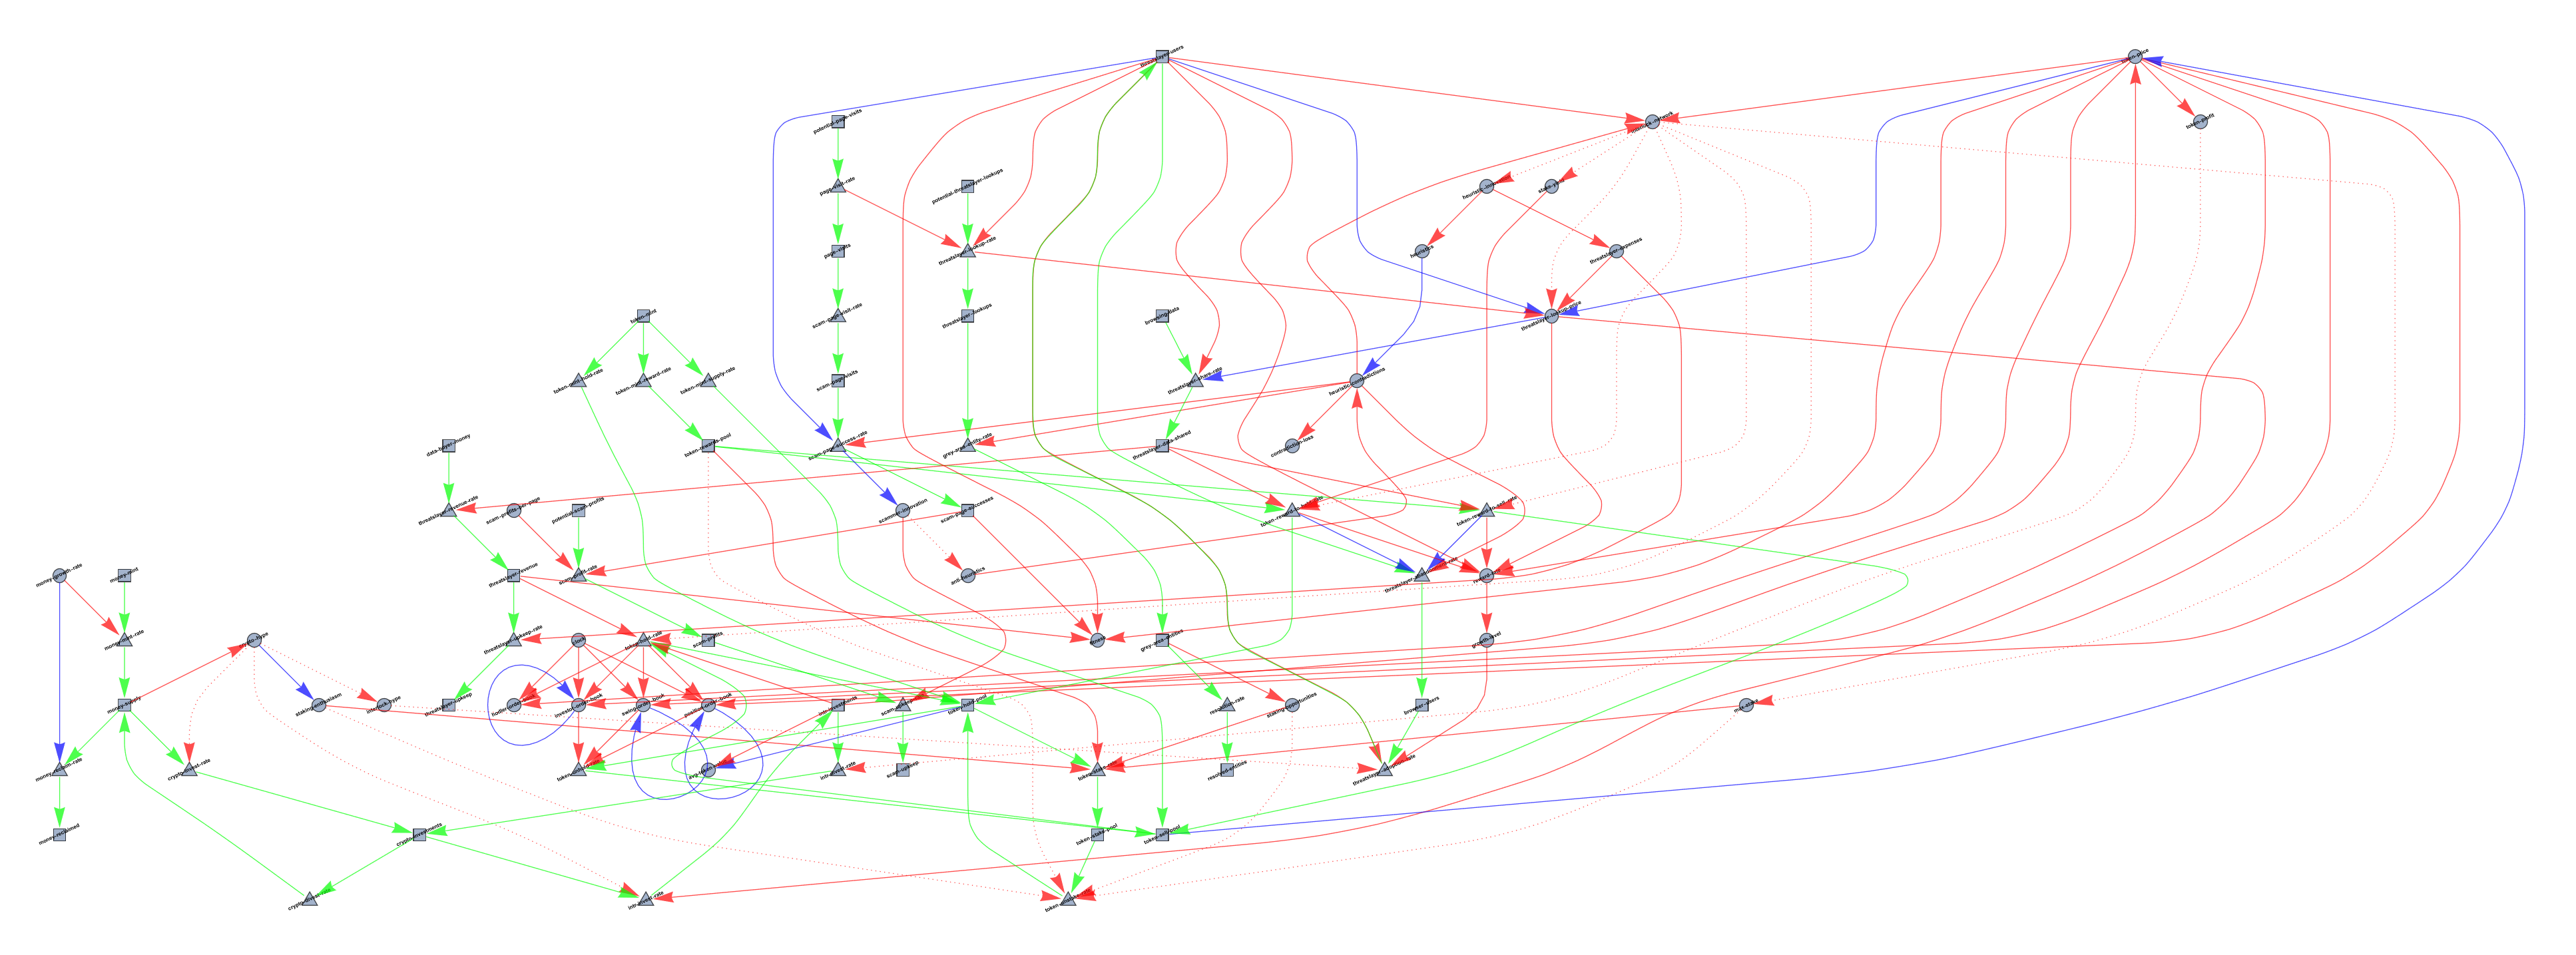
Primary Model
Here is the primary model of the Interlock Network. It is a lot to take in, so we will have to explain what the various aesthetics actually mean. The Stock and Flow Diagrams are represented via: Green Arrows, Squares, and Triangles. Whenever you see a Green Arrow you are looking at the movement of a resource (either unchanged, or transformed -- does not matter, it's all just a number to the simulation). The Squares represent Stocks -- a place where resource flow into and out of. The Triangles represent Flow-Rates -- they govern how quickly (per unit time), the resources get moved from one stock to the next.
The Causal Loop Diagrams are represented via Circles, Red Arrows, and Blue Arrows.
The Circles represent Indicators, they are variables that capture some aspect of the system
that has nothing to do with conserved quantities -- they often represent abstract
concepts like crypto-hype, or token-price, or token-profit, or scammer-innovation.
The Red Arrow implies a positive correlation (i.e. if there is a Red Arrow from A
to B, then an increase in A will cause and increase in B, and a decrease in A
will cause a decrease in B). The Blue Arrow implies negative correlation (i.e. if there
is a Blue Arrow from A to B, then an increase in A will cause and decrease in B, and a
decrease in A will cause an increase in B).
As an inviolable rule, there can be no Red or Blue arrow leading to a Stock/Square. That would be equivalent to creating matter out of thin air. Instead if an Indicator/Circle wants to increase the quantity of a Stock/Square, it needs to increase one of the Inflow Rates (i.e. Triangle). That said, there can be arrows leading away from a Stock/Square.
Any solid arrows represent a causal effect that takes place at the beginning of each time-step. While dotted arrows represent a causal effect that takes place in some future time-step. For example an increase in token-price will cause an immediate increase in token-profit, but token-profit causes a delayed increase in the divestment rate (representing people who want to cash out, and claim the surplus).
It is very important to not use Causal Loops, where Stocks and Flows would be more appropriate. Causal Loops simply indicate causal deltas, without any implication of directionality. While Stocks and Flows have a clear direction, and a finite amount of material to move around. Also the Flow-Rates in the Stocks and Flows provide a non-arbitrary source of delays.
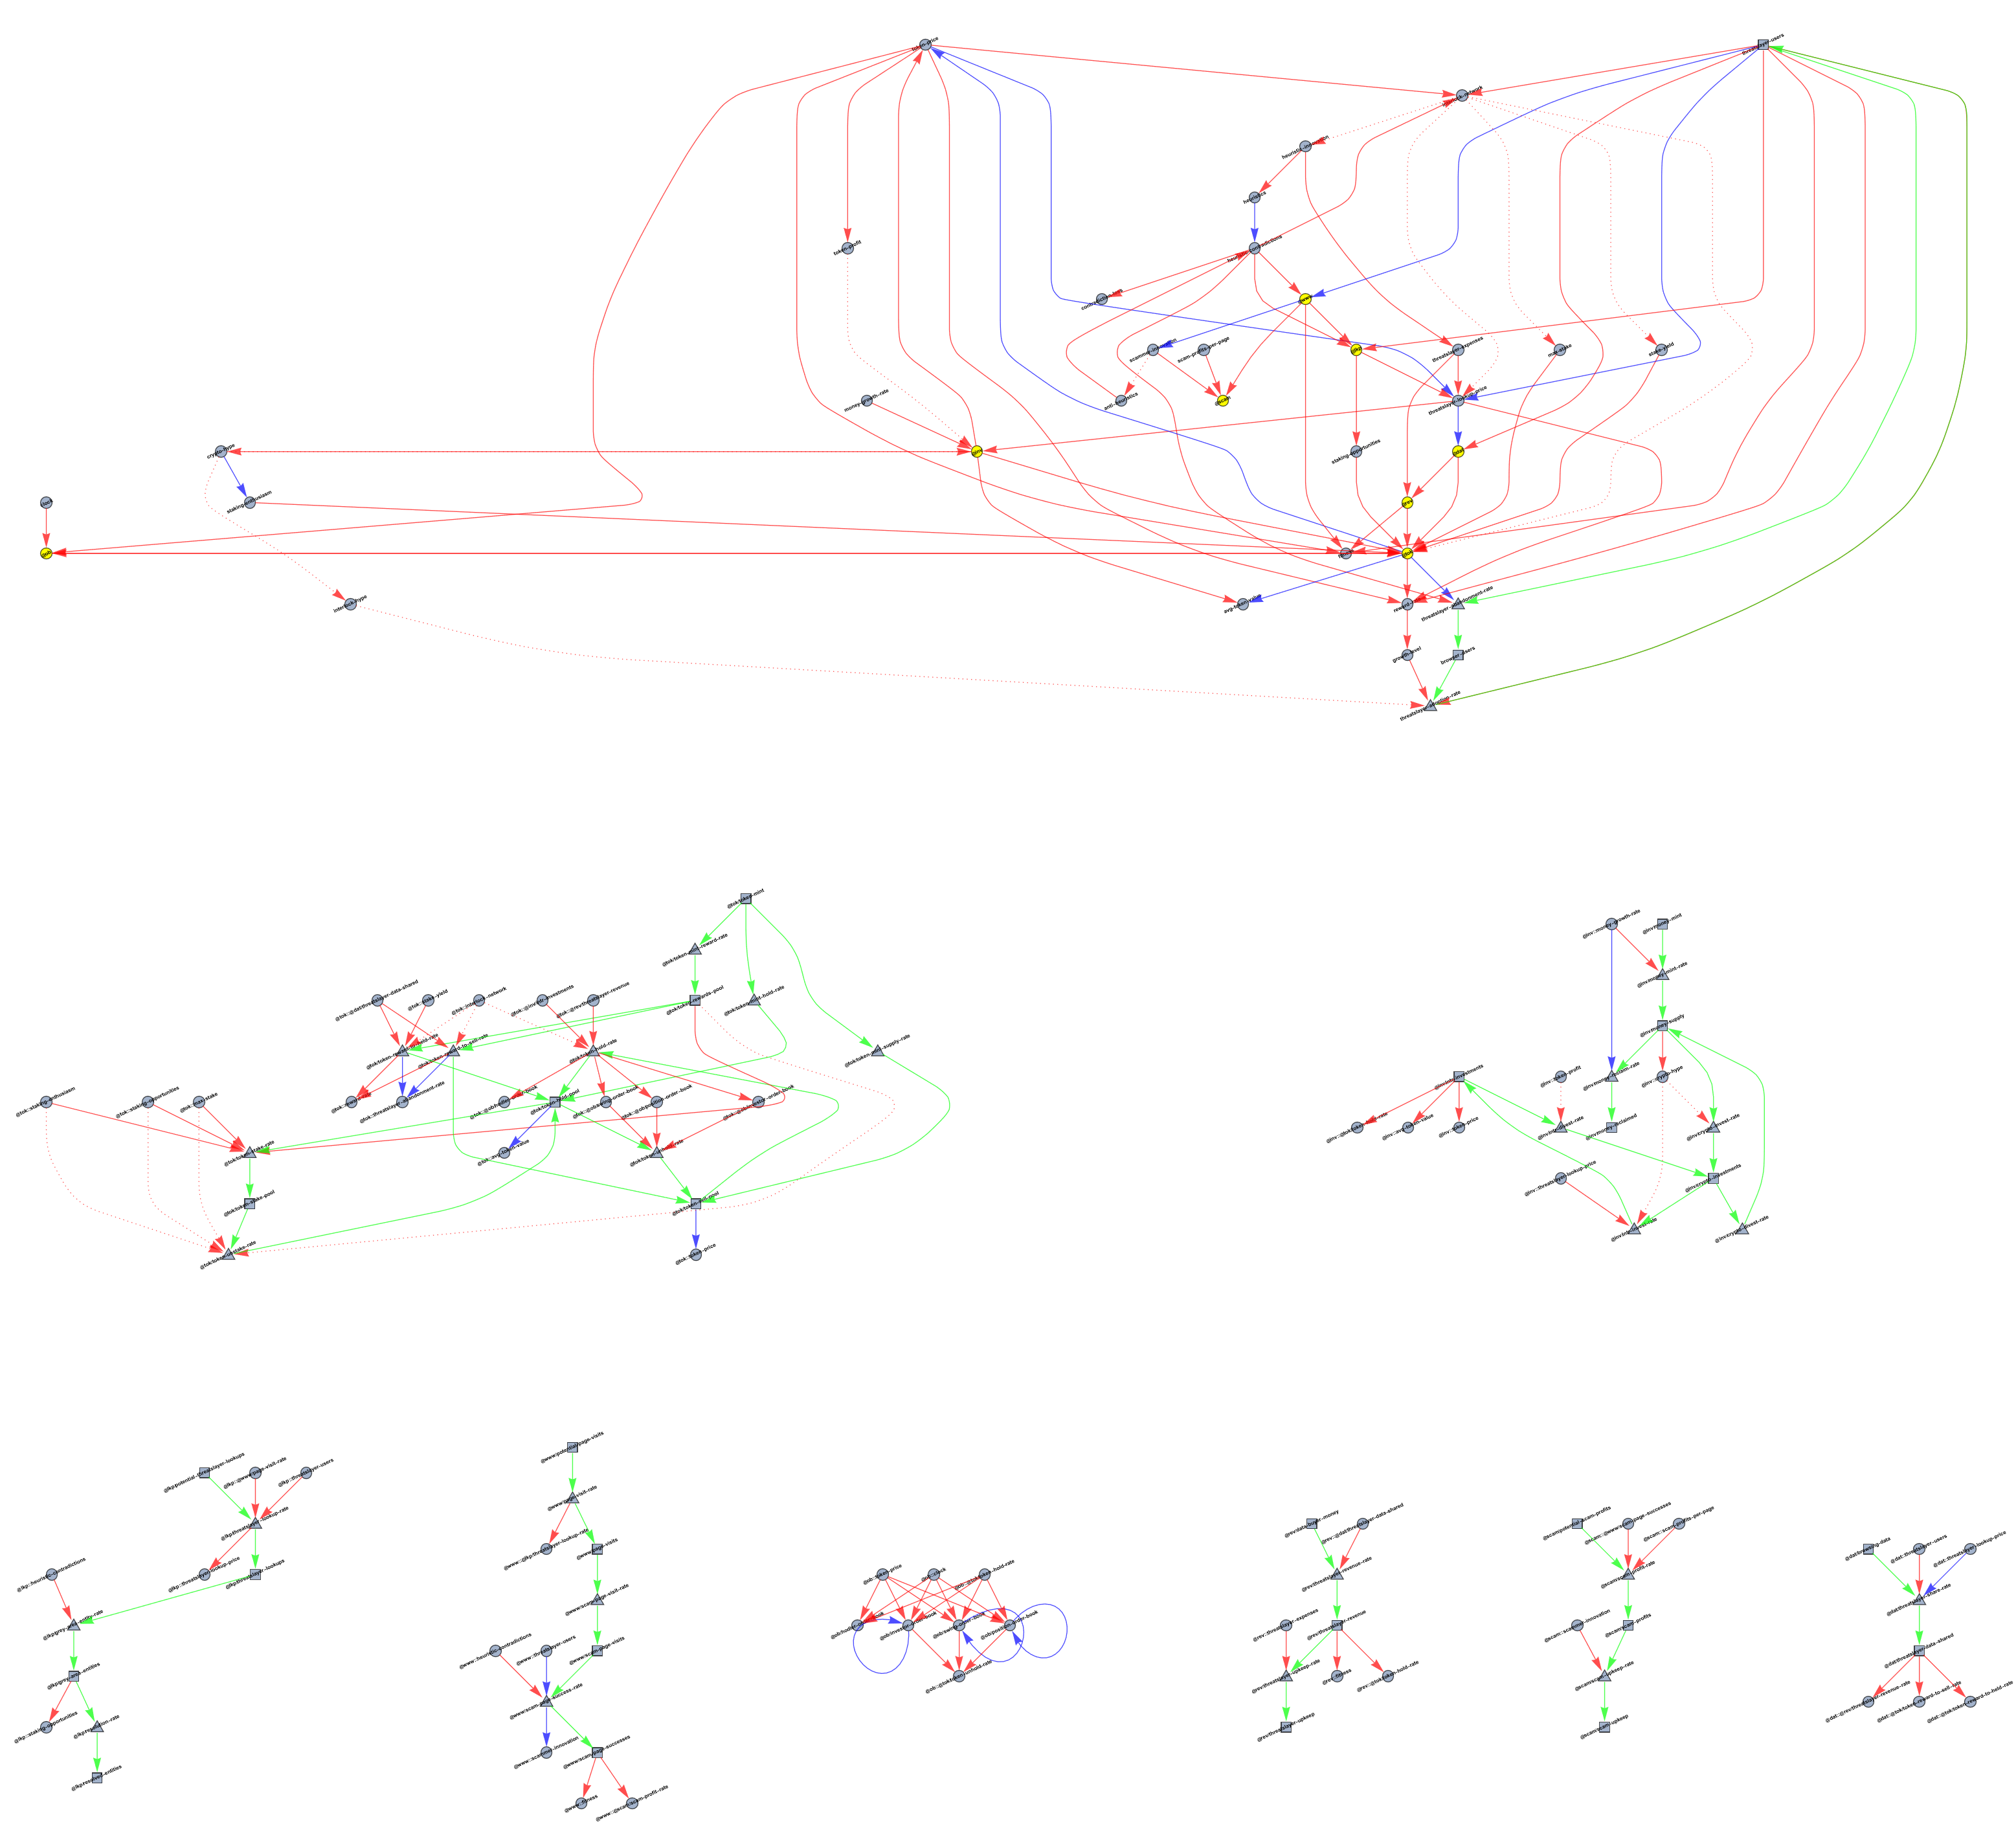
Here is another rendering of the above graph, but broken up into subgraphs (see MAD-4 for full explanation of prefixes, etc):
Graph Updates
The Graphs are being updated actively, though it might take some time for the changes to make it into this repo. Whenever the topology changes, there is a process that involves playing with (a) the embeddings and (b) the label-rotation-angles.
cadCAD
This repo will contain the cadcad-model in the directory cadcad-model -- it is almost
ready for review, just need to make sure it matches the spec, and vice-versa.
Mathematica
The mathematica directory contains the mathematica input-code, which is currently
used for rendering, but -- by virtue of being a first class mathematical object that
is understood by the software -- it can be used for graph-related calculations,
such as centrality computations, and graph-walks. We will explore these uses of
mathematica, to ask questions about the structure of the model.

