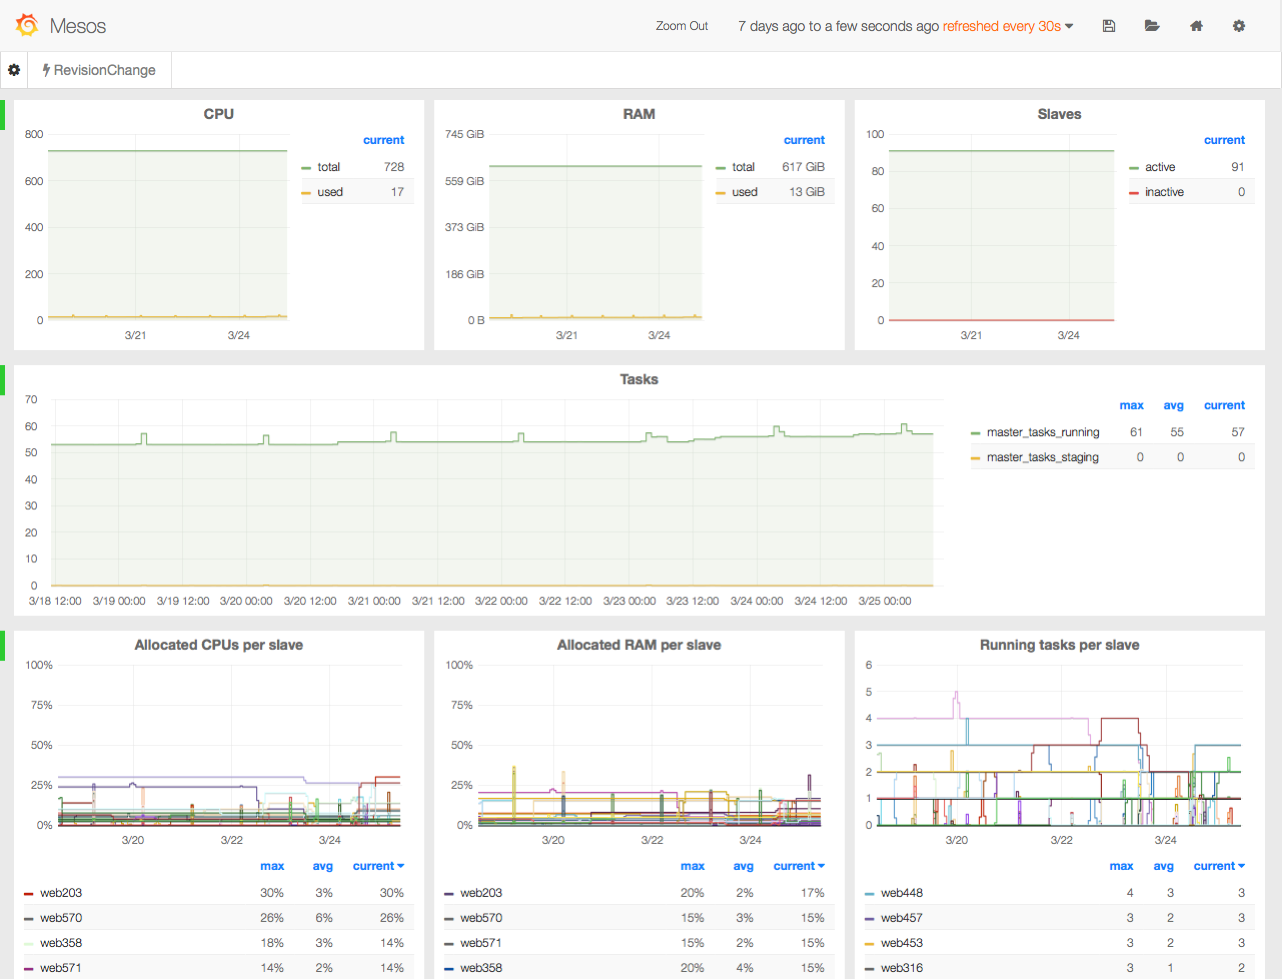
Collect mesos metrics to graphite
This is dockerized version of collectd-mesos. You only need docker to run this, mesos to monitor and graphite to store metrics.
Running
Master
docker run -d -e GRAPHITE_HOST=<graphite host> -e MESOS_MODE=master \
    -e MESOS_HOST=<mesos host> -e MESOS_PORT=<mesos port> \
    -e MESOS_VERSION=<mesos version> bobrik/collectd-mesos
Slave
docker run -d -e GRAPHITE_HOST=<graphite host> -e MESOS_MODE=slave \
    -e MESOS_HOST=<mesos host> -e MESOS_PORT=<mesos port> \
    -e MESOS_VERSION=<mesos version> bobrik/collectd-mesos
Environment variables
COLLECTD_HOST- host to use in metric name, defaults to the value ofMESOS_HOST.GRAPHITE_HOST- host where carbon is listening for data.GRAPHITE_PORT- port where carbon is listening for data,2003by default.GRAPHITE_PREFIX- prefix for metrics in graphite,collectd.by default.INFLUXDB_HOST- host where influxdb is listening for data.INFLUXDB_PORT- port where influxdb is listening for data,25826by default.MESOS_MODE- mesos node type:masterorslave.MESOS_HOST- mesos host to monitor.MESOS_PORT- mesos port number, likely5050for master and5051for slave.MESOS_VERSION- mesos version to enable version-specific metrics.
Note that this docker image is very minimal and libc inside does not
support search directive in /etc/resolv.conf. You have to supply
full hostname in MESOS_HOST that can be resolved with nameserver.
Grafana dashboard
Get example grafana dashboard:
