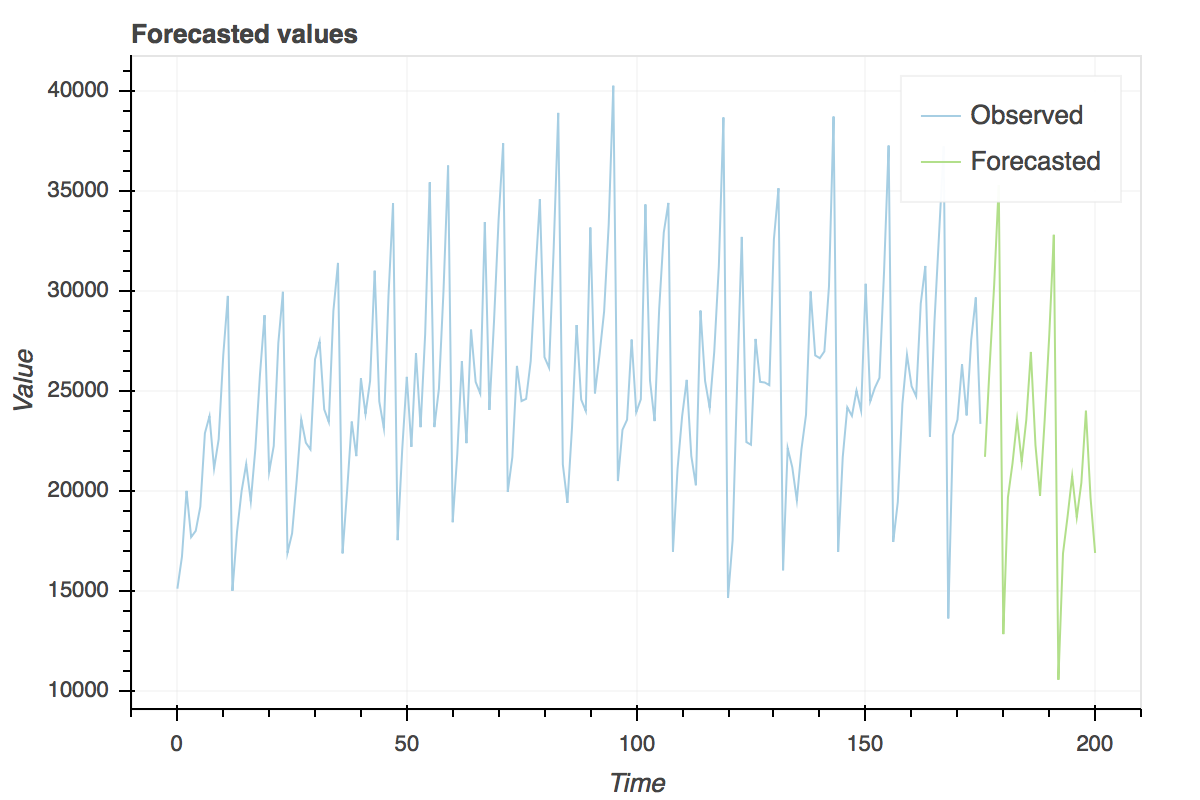
Pyramid is a no-nonsense statistical Python library with a solitary objective: bring R's
auto.arima
functionality to Python. Pyramid operates by wrapping
statsmodels.tsa.ARIMA and
statsmodels.tsa.statespace.SARIMX
into one estimator class and creating a more user-friendly estimator interface for programmers familiar with scikit-learn.
import numpy as np
from pyramid.arima import auto_arima

# this is a dataset from R
wineind = np.array([
    # Jan    Feb    Mar    Apr    May    Jun    Jul    Aug    Sep    Oct    Nov    Dec
    15136, 16733, 20016, 17708, 18019, 19227, 22893, 23739, 21133, 22591, 26786, 29740,
    15028, 17977, 20008, 21354, 19498, 22125, 25817, 28779, 20960, 22254, 27392, 29945,
    16933, 17892, 20533, 23569, 22417, 22084, 26580, 27454, 24081, 23451, 28991, 31386,
    16896, 20045, 23471, 21747, 25621, 23859, 25500, 30998, 24475, 23145, 29701, 34365,
    17556, 22077, 25702, 22214, 26886, 23191, 27831, 35406, 23195, 25110, 30009, 36242,
    18450, 21845, 26488, 22394, 28057, 25451, 24872, 33424, 24052, 28449, 33533, 37351,
    19969, 21701, 26249, 24493, 24603, 26485, 30723, 34569, 26689, 26157, 32064, 38870,
    21337, 19419, 23166, 28286, 24570, 24001, 33151, 24878, 26804, 28967, 33311, 40226,
    20504, 23060, 23562, 27562, 23940, 24584, 34303, 25517, 23494, 29095, 32903, 34379,
    16991, 21109, 23740, 25552, 21752, 20294, 29009, 25500, 24166, 26960, 31222, 38641,
    14672, 17543, 25453, 32683, 22449, 22316, 27595, 25451, 25421, 25288, 32568, 35110,
    16052, 22146, 21198, 19543, 22084, 23816, 29961, 26773, 26635, 26972, 30207, 38687,
    16974, 21697, 24179, 23757, 25013, 24019, 30345, 24488, 25156, 25650, 30923, 37240,
    17466, 19463, 24352, 26805, 25236, 24735, 29356, 31234, 22724, 28496, 32857, 37198,
    13652, 22784, 23565, 26323, 23779, 27549, 29660, 23356]
).astype(np.float64)

# fit many models returning the best one
fit = auto_arima(wineind, start_p=1, start_q=1, max_p=3, max_q=3, m=12,
                 start_P=0, seasonal=True, n_jobs=-1, d=1, D=1,
                 error_action='ignore',  # 'warn' if you want to see when a model cannot be fit
                 suppress_warnings=True)  # so convergence warnings don't fill your screen up

# now you can look at your model summary:
>>> fit.summary()
<class 'statsmodels.iolib.summary.Summary'>
"""
                                 Statespace Model Results
==========================================================================================
Dep. Variable:                                  y   No. Observations:                  170
Model:             SARIMAX(1, 1, 1)x(1, 1, 2, 12)   Log Likelihood               -1576.165
Date:                            Thu, 01 Jun 2017   AIC                           3166.330
Time:                                    13:07:01   BIC                           3188.280
Sample:                                         0   HQIC                          3175.237
                                            - 170
Covariance Type:                              opg
==============================================================================
                 coef    std err          z      P>|z|      [0.025      0.975]
------------------------------------------------------------------------------
intercept    204.0896    244.412      0.835      0.404    -274.949     683.128
ar.L1         -0.1177      0.088     -1.338      0.181      -0.290       0.055
ma.L1         -0.6462      0.097     -6.661      0.000      -0.836      -0.456
ar.S.L12      -0.7921      0.573     -1.383      0.167      -1.915       0.331
ma.S.L12       0.3650      0.574      0.636      0.525      -0.760       1.489
ma.S.L24      -0.4317      0.239     -1.809      0.070      -0.899       0.036
sigma2      3.669e+07      0.021   1.72e+09      0.000    3.67e+07    3.67e+07
===================================================================================
Ljung-Box (Q):                       39.84   Jarque-Bera (JB):               982.04
Prob(Q):                              0.48   Prob(JB):                         0.00
Heteroskedasticity (H):               5.28   Skew:                            -1.72
Prob(H) (two-sided):                  0.00   Kurtosis:                        14.76
===================================================================================

Warnings:
[1] Covariance matrix calculated using the outer product of gradients (complex-step).
[2] Covariance matrix is singular or near-singular, with condition number 2.84e+24. Standard errors may be unstable.
For an easy, reproducible quick-start example, see examples/.


