Simple Spring Boot application to demonstrate collecting and correlating logs, metrics and traces with Prometheus, OpenTelemetry, and Grafana Cloud. It is built using Maven.
Refer to this documentation for details.
To just see the application in action, you can build a jar file and run it from the command line.
git clone https://github.com/adamquan/hello-observability.git
cd hello-observability/hello-observability
./mvnw package
java -jar target/*.jar
You can then access Hello Observability here: http://localhost:8080/hello. Very simple application!
Or you can run it using Docker:
cd hello-observability/hello-observability
docker build -t hello-observability .
docker run -d -p 8080:8080 --name hello-observability hello-observability
Similarly, you can access the application here: http://localhost:8080/hello
You can stop the docker container using:
docker stop hello-observability
Note that when you run the application either using the Jar file or directly with docker, nothing will be collected. You will need start all services using docker-compose, either all locally or connect to Grafana Cloud, to generate and collect logs, metrics and traces.
You can run the whole stack locally inside Docker, after building the application container. The whole stack contains:
- The Hello Observability application
- The simple load runner
- Prometheus for metrics
- Loki for logs
- Tempo for traces
- Grafana Agent to collect logs, metrics and traces
- Grafana
cd hello-observability/local
docker-compose up
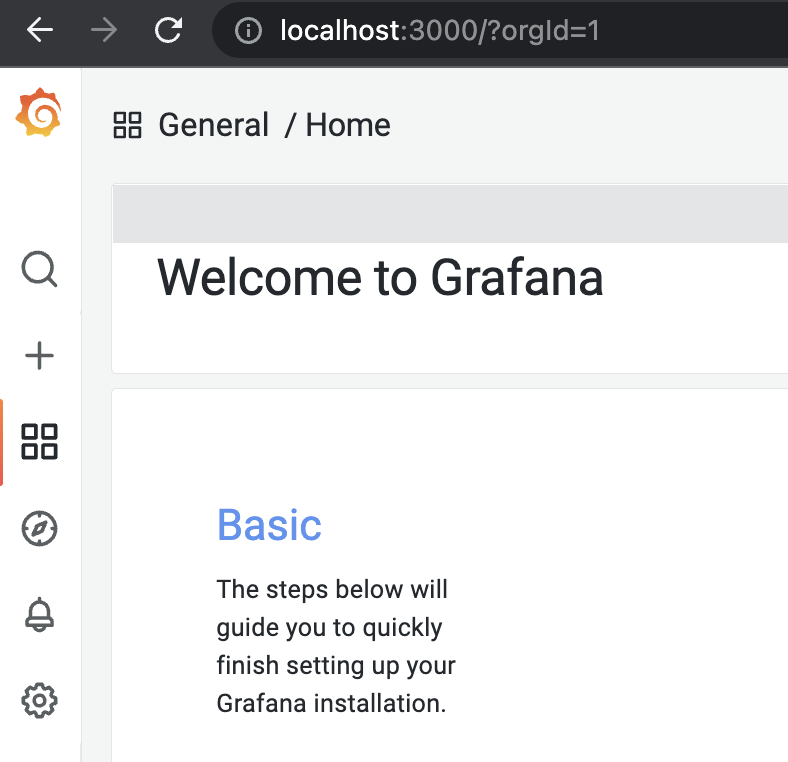
After all the containers are up, you can access the appliction here: http://localhost:8080/hello, and Grafana here: http://localhost:3000
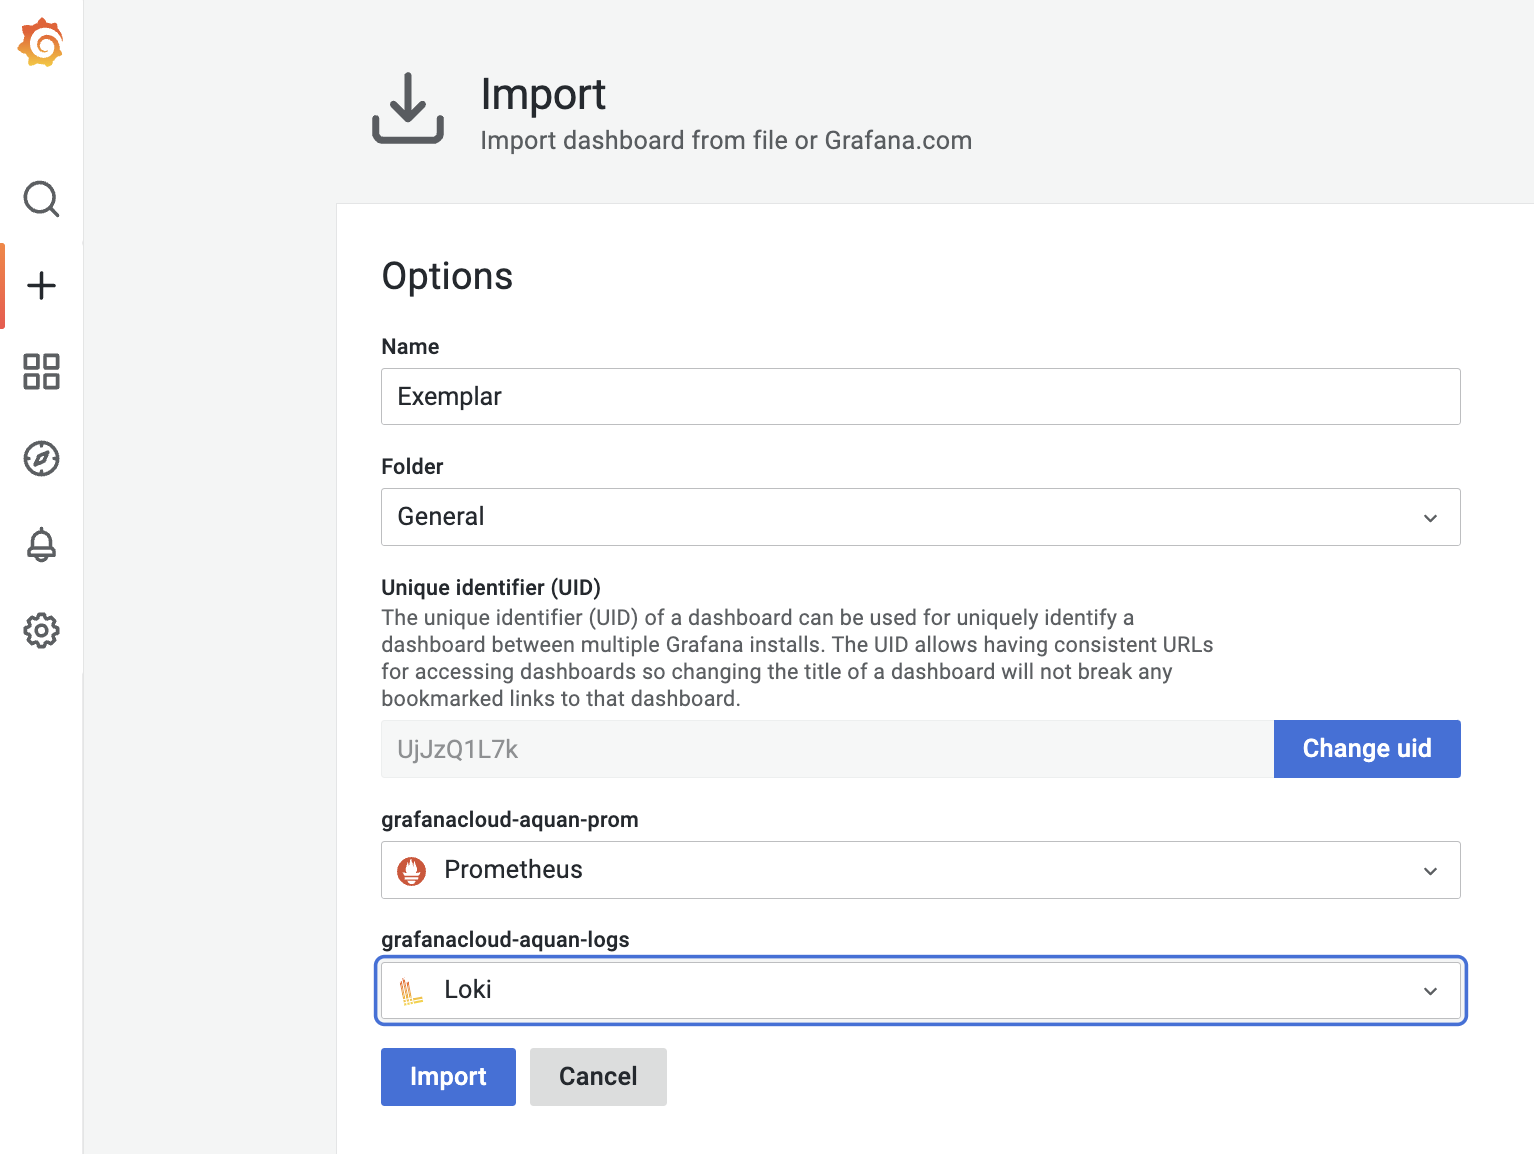
Import the dashboard from the dashboard.json file,
and see something beautiful!
You can also run the application locally, but send logs, metrics and traces to Grafana Cloud. You do need to configure the cloud/config/agent.yaml file with your Grafana Cloud information. Local components that starts inside Docker include:
- The Hello Observability application
- The simple load runner
- Grafana Agent to collect logs, metrics and traces
The architecture looks like:
cd hello-observability/cloud
docker-compose up
Similary as you have done locally, import the dashboard and enjoy!
Here is a live version of the dashboard


