A convolutional neural network for recognizing Organic Chemical Lewis Structures and Skeletal formulas build with Google's Tensorflow.
This is modified from the AlexNet architecture, with similar modifications to this paper.
99% accuracy was achieved on the test set with only 3 epochs.
There are hundreds of thousands of academic Chemistry papers. Some services like Reaxys and SciFinder index these papers to allow you to search by chemical structures or reactions. I would like to automate the process of identifying chemical structures in these papers, to make these indexes easier to maintain.
This involves two steps:
- Object detection - find the location of chemical structures within papers
- Identification - not just classification, but determining the actual chemical formula
This project is the first step. It can classify Lewis structures from non Lewis structures.
Some of the positives were gathered from the ChemSpider API. I downloaded the first 10,000 images (by ascending integer ID). Some of the negatives were taken from papers without chemical structures in them, about 9,000 images. Papers were converted to PNGs and cropped into 150x150 tiles. For each class, several thousand were downloaded and labelled manually from Google images. This was done with a Chrome Extension called Label Gun.
The network was trained on a Lenovo U31-70 with a NVIDIA GeForce 920M running Ubuntu 16.04.3.
Among the training data, the most common false positives are from drawings of "stick figure" people, and physics diagrams such as circuits or Feynman diagrams. False negatives seem to occur when the molecule in the image is too zoomed out or too small.
Hidden Layer Visualizations
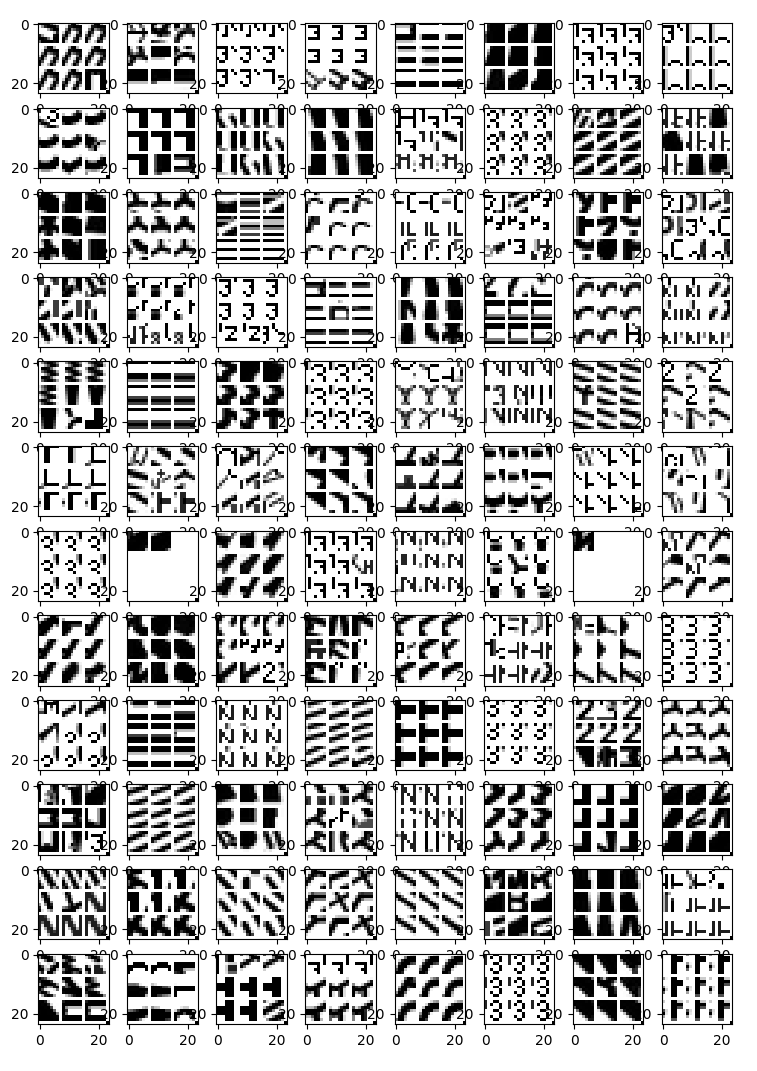
I'm using a technique from Donahue et. al., 2013. Here I find crops of the input image space that maximize activation in higher layers. This gives us an idea what each filter is "looking for". In this case, the top 9 patches are shown for each filter. The negatives were excluded in this visualization.
Hidden layer 1
The first conv layer has 96 filters. Here are the 864 images (9 * 96) that maximize the activations in the first layer. Each box in this grid is for one filter. Within the box are the 9 patches (crops) from the input images that produce the largest observed activations for that filter.
This layer appears to be detecting simple things like curves, edges, vertices, and individual letters/numbers.
Hidden layer 2
This layer is detecting more complex things like parts of rings, methyl groups, double bonds, quaternary carbons, amines, carbonyls, etc. Notice that quite a few of the units are all blank, meaning there was no activation whatsoever for all the positive images. These units are probably stimulated by salient features in the negatives.
Hidden layer 3
This layer detects even more complexity, like entire rings or polycycles, allyl groups, and other functional groups.


