 all scraped items are 'on-sale/discounted' only, if the item is not on sale for regular customers or prime members it will not be in the queried dataset
The point of this app is to help Whole Foods shoppers make better purchasing decisions at their local store to have a better shopping experience and save money, with specifics that are not on the website.
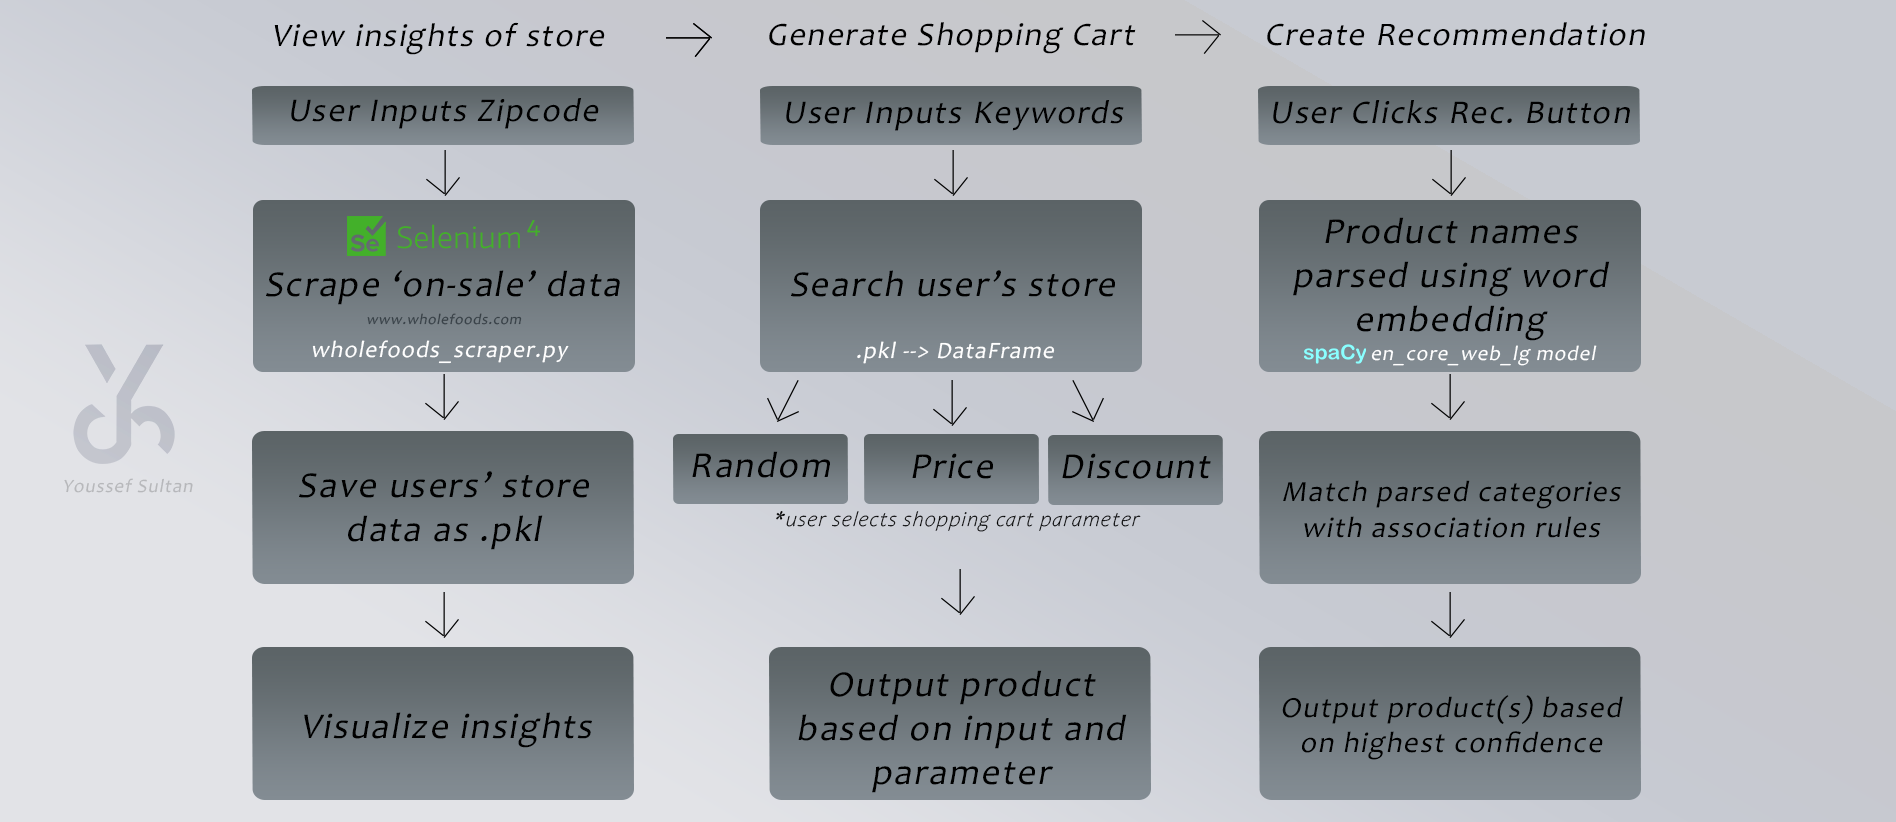
- A user inputs their zipcode
- A script scrapes unstructured product data from each category on the Whole Foods website pertaining to the user's inputted zipcode/store and then structures all of the data in a DataFrame (similar to an Excel spreadsheet)

- It shows many graphs of the queried data of all 'on-sale/discounted' items from the user's store or other users' stores to understand how much of each product/category is on sale
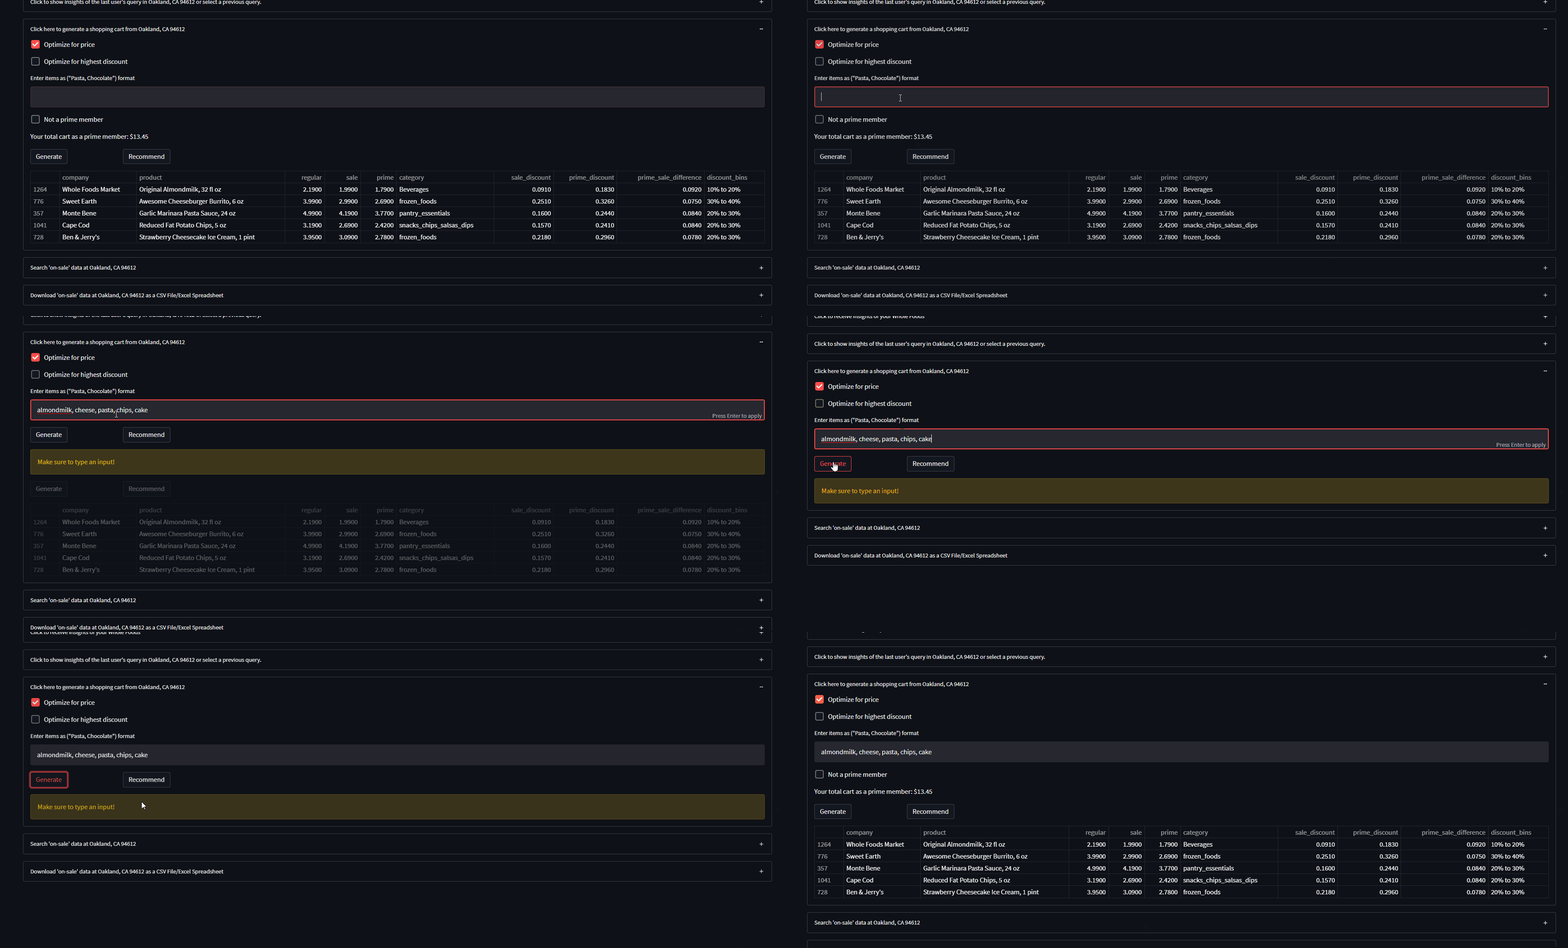
- It generates a shopping cart of items 'on-sale/discounted' based on user keyword input ('chocolate, pasta'...) and selected optimization parameter ('random, price, discount')
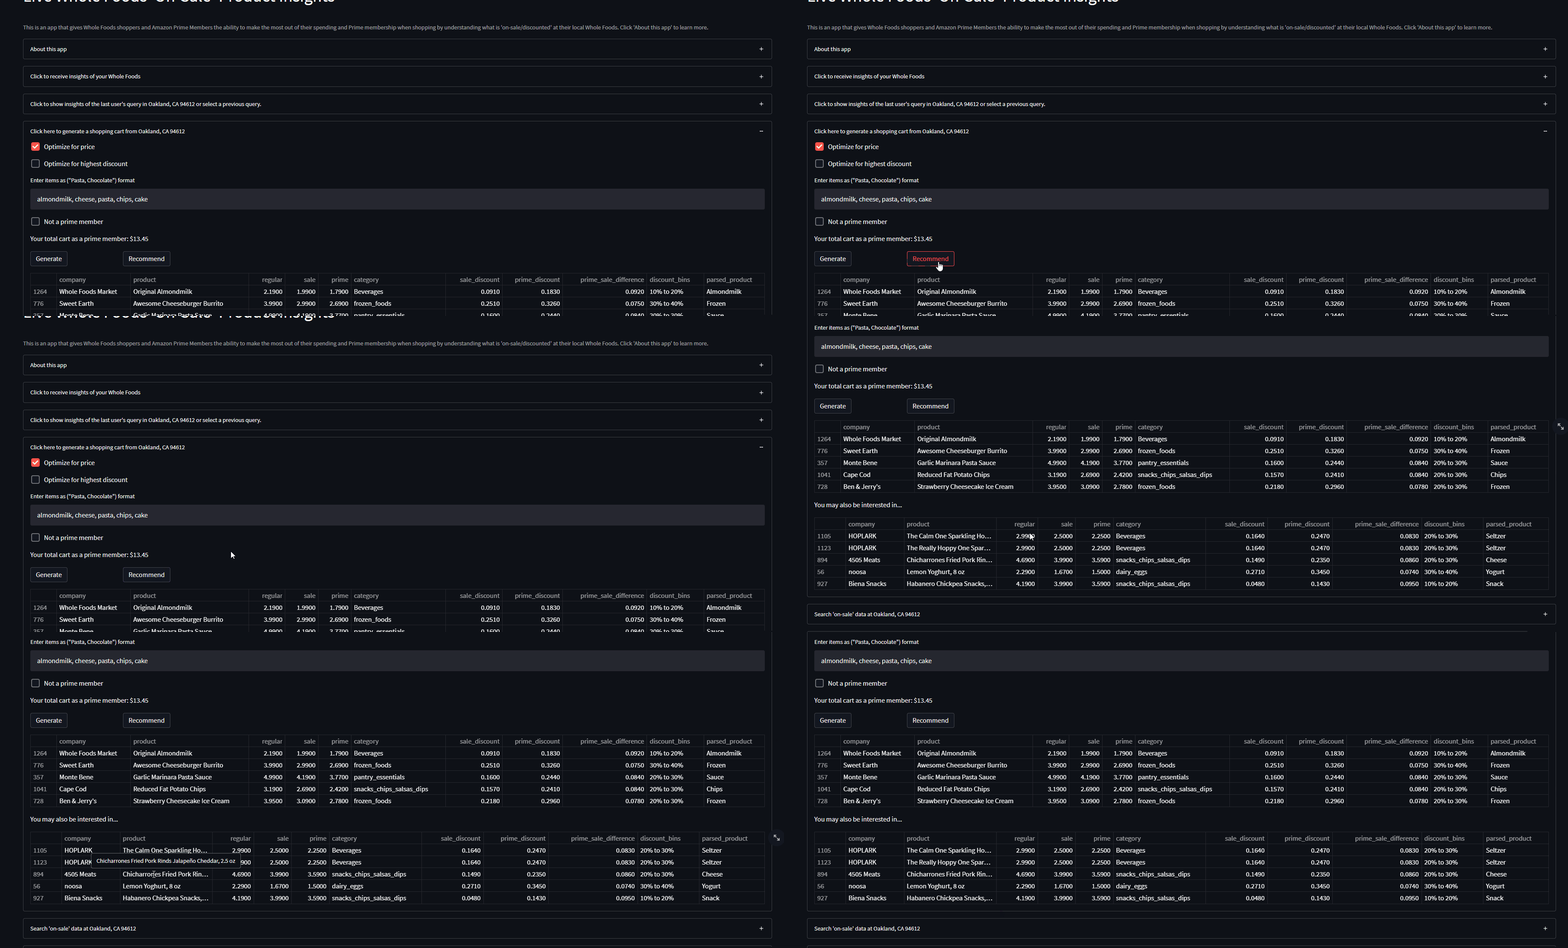
- It recommends products to the user based on Instacart customer data using a collaborative filtering approach and the users generated shopping cart
- For more information on the intuition behind the recommendation system click here or view the blog post
- Search the queried dataset based on keywords for anything specific
- Download the queried dataset as a CSV
- Any user queried data gets wrangled/cleaned/manipulated to fit all edge cases for website element changes, product title mismatches and other errors that might arise when scraping product information, then structured with the following columns (any column with a * is a created feature):
feature                    dtype description
---------------------------------------------------------------------------
company                   object [product company name]
product                   object [product title]
regular                  float64 [regular product price]
sale                     float64 [on-sale product price]
prime                    float64 [on-sale product price for prime members]
category                  object [Whole Foods category]
sale_discount            float64 [sale discount percentage] *
prime_discount           float64 [prime discount percentage] *
prime_sale_difference    float64 [prime discount - sale discount] *
discount_bins             object [discount bins I.E. 0% Off to 10% off] *
-
Recommendations are driven by parsing products into categories
- rule-based data parsing/cleaning/lemmatization
- word embedding (parsing) using spaCy pre-trained model
- designing the taxonomy (categories) from scratch to have a unique signature (1400 avg items per data set --> 99 categories)
- all of which is automated and preprocessed using a transformer with the help of sci-kit learn's BaseEstimator & TransformerMixin
-
Instacart's public datasets of 3M customer orders and other tables are joined collectively, used and built to match the taxonomy design of the signature above (99 categories)
-
Apriori algorithm is applied to the designed dataset
-
Recommendations on the app are provided to the user based on association rules of Instacart customer data as well as the input of the user
- Recommendations are based on a random selection of a category within the top 10 confidence values (measure of the percentage of times that item in category B is purchased, given that item in category A was purchased.) this reduces bias by mitigating a selection of a category solely by the highest confidence.

*if a user were to have chocolate in their shopping cart, there is an equal chance that a product within the top 10 confidence values in each category of item_B is recommended
This project is deployed via Streamlit which uses a debian based linux image on their cloud, a big thanks to them for allowing many to use their platform with ease for data scientists like myself.


