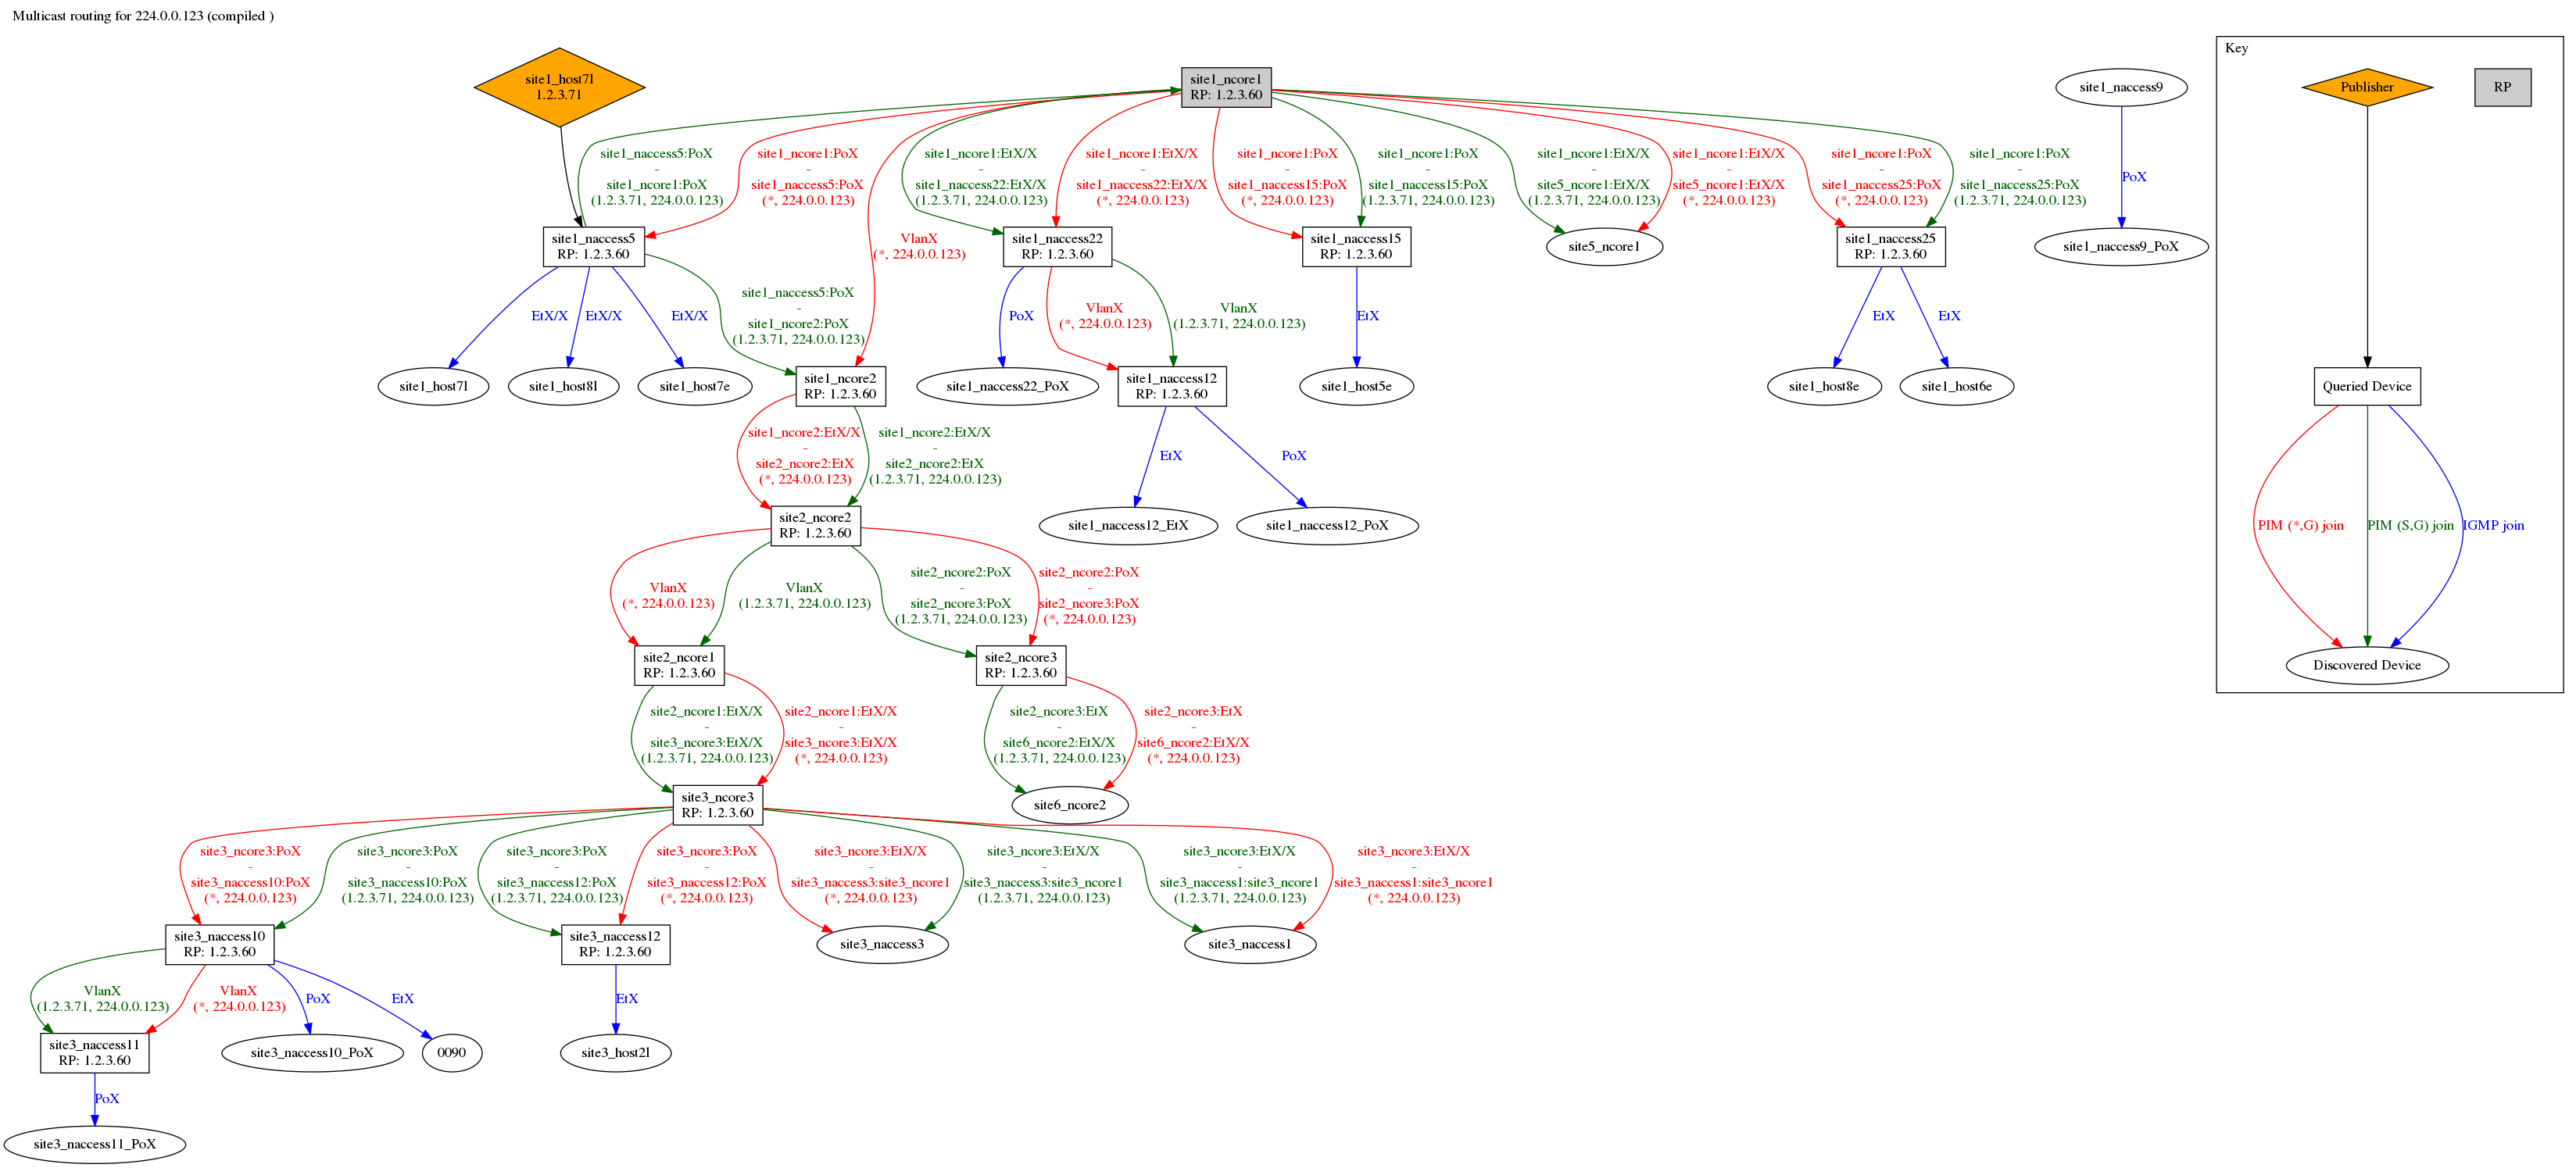
Visualises the multicast trees for a single IPv4 group address using information scraped from NX-OS, EOS and IOS devices using ansible, ntc-ansible and TextFSM.
It is capable of showing the following information (provided all relevant devices are queried):
- The Rendezvouz Point device
- What every other device believes the RP to be (to help detect config mismatches)
- The direction of traffic flow on the shared multicast tree
- The direction of traffic flow on any source-specific multicast trees
- The publishes (IP addresses and name as discovered through LLDP)
- The subscribers (as discovered through IGMP Snooping and LLDP)
This tool is very young and could be significantly improved upon. It was a first attempt at doing something useful while studying for Ivan Pepelnjak's Building Network Automation Solutions course.
- Clone this repository
- Initialise the ntc-ansible submodule:
git submodule update --init --recursive- Create a python virtualenv and install the dependencies:
virtualenv env
source env/bin/activate
pip install -r requirements.txt- Update the
hostsinventory file with your own devices - Create a vault file at
secrets/vault.ymlif you need ssh username and password to access your devices, otherwise just create an empty file there:
ansible-vault create secrets/vault.yml
# or
touch secrets/vault.yml- Run the tool for your chosen multicast group with:
ansible-playbook check_group.yml --extra-vars "mcast_group=224.0.0.123"The rendered graph will be written to the outputs directory with the group
address as the filename and a ..png extension, e.g. outputs/224.0.0.123.png.
If you need to use a bastion host to connect to your network devices, uncomment the
line in hosts file, and change the hostname of the bastion host there. Also edit
ssh_config and set the right hostname there.
- python (tested with 2.7 only)
- ansible (tested with 2.3)
- graphviz
This tool depends on several python libraries which are listed in the
requirements.txt file, which is intended to be used with a python virtualenv.
The playbook has several stages (each of which is tagged and can be run separately):
setup- Creates the output directoriesfetch- Fetches information from each device and writes them to separate output files. This stage is split into mutiple sub-stages, each of which are written to separate fiels. **fetch-interfaces- Retrieves list of interfaces **fetch-lags- Retrieves the list of link-aggregation groups **fetch-neighbours- Retrieves the list of LLDP neighbours **fetch-rp- Retrieves the Rendezvouz Point **fetch-mroutes- Retrieves the list of mroutes **fetch-snooping- Retrieves the list of IGMP subscriberscompile- Merges the separate output files into a single report for easier processinggenerate- Generates the dot graph from the compiled reportrender- Renders the outputpngimage from the dot graph
The data is scraped from the devices using ntc-ansible and ntc-templates.
This tool ships its own modified copy of several of the TextFSM templates shipped
by ntc-templates which did not retrieve all of the necessary data. I intend to
upstream those modifications when time permits.
All of the business logic for calculating the list of devices and relationships in the dot graph is done (ab)using jinja2 filters.
Pull requests are very much welcome!
