- Intro
- Why Bandar-Log?
- Getting started
- Bandar-Log concepts
- Architecture overview
- Build custom image
- License
- Credits
Bandar-Log makes possible to monitor flow throughput of data sources and processing components that are part of Data Ingestion and ETL pipelines.
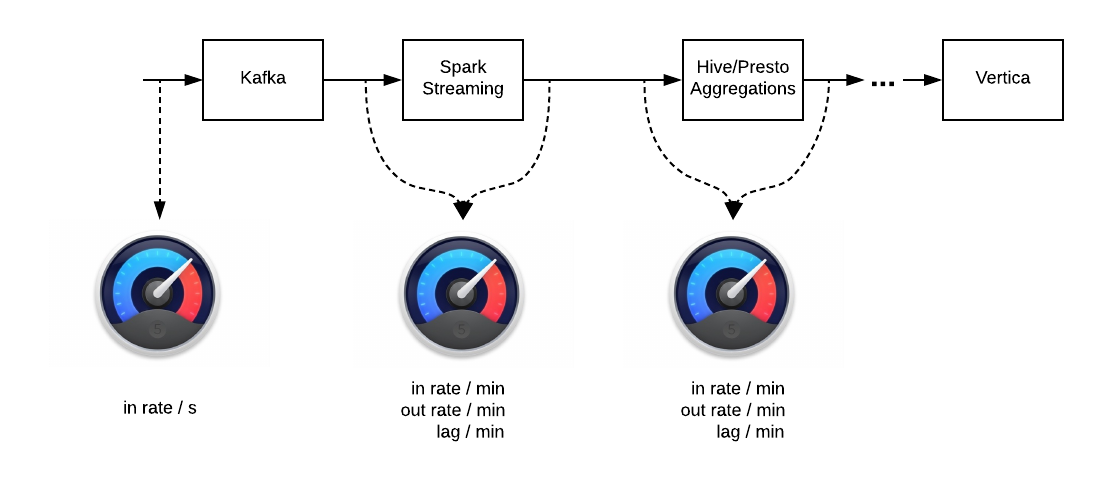
Typical ETL assumes having some processing logic between data sources which adds some delay i. e. "resistance", which should be measured. For example:
- how many events Spark app process per minute and comparing to how many events come to Kafka topics
- what's the size of unprocessed events in Kafka topics at this moment
- how much time passed since the last aggregation processed
Collected metrics might be sent to specified monitoring service like Datadog or others.

Typical ETL pipelines accept incoming data and compraises a chain of processing components with certain flow geometry:
-
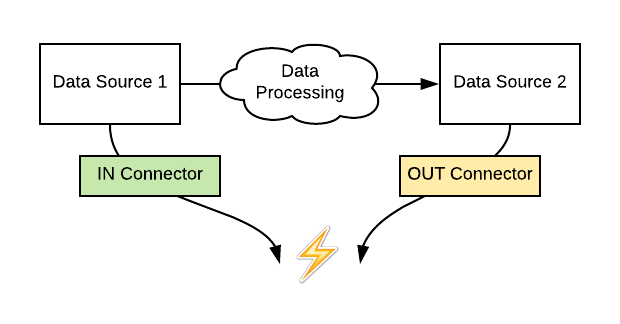
There is incoming data with certain rate, we call it
IN.Examples: Kafka's topics that accept incoming messages.
-
There are ETL components that pull data from one data source and put it to another one. This consuming rate is called
OUT.Examples: Spark Streaming, Hive/Presto aggregations that pull portion of data from one table and aggregate it to another one, replicators that mirror data from one data source to another one.
Bandarlog is a standalone service that tracks IN [incoming rate], OUT [consuming rate] between two and more data sources.
In addition, it allows to measure LAG which is defined as (LAG = IN - OUT).
Particular semantics of metrics IN, OUT, LAG depends on specific Data Sources and contracts that Bandarlog expects (see Metrics).
- Easy to use. Create your own Bandar-Log in 10 minutes, just follow up with Start Bandar-Log in 3 steps section.
- Tested on the real-time big data pipelines for a long period of time. Bandar-Log proved itself like the most straightforward and stable component.
- Support. Bandar-Log is running right now. So, we care about its stability and new features.
- No need to modify any apps. Bandar-Log is a separated application which monitors metrics outside.
- Easy to extend and add custom data sources.
See How to Start Bandar-Log in 3 steps.
- Data source config
- Bandarlog
- Metric
- Reporter
Data source is an abstration over persistance component which can provide or store data.
In Bandar-Log data source is represented by configuration object called data source config.
Data source config specifies driver/connection properties like host, username, password etc... Data source config can be shared between multiple data sources.
Kafka data source configuration:
kafka-config {                   # kafka configuration id (can be any id)
  brokers = 1.1.1.1:9092         # default list of brokers
}

example-bandarlog {
  connector = "kafka-config"     # reference to the particular kafka config
}
SQL data source configuration:
sql-data-source-config {             # data source configuration id (can be any id)
  host = "example.host.com"          # data source host
  port = "5433"                      # data source port
  dbname = "dbname"                  # data source database name
  username = "username"              # data source username
  password = "password"              # data source password
  schema = "schema"                  # data source schema
  use-ssl = true                     # data source SSL mode flag (by default = true)
  max.pool.size = 10                 # connection pool size (by default = 10)
  connection.timeout.ms = 60000      # connection timeout in ms (by default = 60000)
}

aws-glue-source-config {
  region = "region"                  # aws region
  dbname = "database"                # database name
  access.key = "accesskey"           # access key provided by AWS account
  secret.key = "secretaccesskey"     # secret key provided by AWS account
  fetch.size = 10                    # the maximum number of partitions to return in a single response
  segment.total.number = 10          # the total number of segments - non-overlapping region of a table's partitions. Maximum possible value - 10
  maxwait.timeout.seconds = 60       # maximum wait time until all the parallel requests become completed
}
- Kafka (version >= 0.10.2)
- SQL
- Vertica (compatible with vertica driver 6.0.0)
- Presto (compatible with presto driver 0.181)
- AWS Glue Data Catalog (compatible and tested with aws-java-sdk-glue 1.11.388)
*you can easily add new data source
Bandarlog -- unit of data-flow monitoring for one data source or between several data sources.
Each bandarlog, depending on its type, has one or multiple connectors -- objects that reference to specific data source config. Bandarlog monitors flow between linked data sources.
For now there are two supported bandarlog types:
- SQL -- to measure the performance of specific ETL component(s) which reads data from SQL-complient data source and writes data to SQL complient data source(s). In order to use Glue connector, one needs metadata table, for example, created by the AWS Glue crawlers. Crawlers connect to a source or target data store, determine the schema, automatically compute statistics and register partitions, and then create metadata table in the AWS Glue Data Catalog.
- Kafka -- to measure performance of specific kafka consumer and incoming rate.
SQL connectors divided into IN and OUT connector types with one-to-many relation (we can have one IN connector and several OUT connectors):
IN - connector for input data source. IN metric will be fetched from it (input rate).
OUT - list of connectors for output data sources. OUT metrics will be fetched from it (output rate).
You can use IN or OUT connector separately according to your requirements (like in quick start examples).
SQL connector configuration:
in-connector {
  type = "presto"                   # data source type (vertica, presto)
  config-id = "presto-config"       # reference to the data source config id
  tag = "presto-tag-name"           # reporting tag value
}
out-connectors = [{
  type = "vertica"                  # data source type (vertica, presto)
  config-id = "vertica-config"      # reference to the data source config id
  tag = "vertica-tag-name"          # reporting tag value
}]
Bandar-Log App accepts list of bandarlog units that works in parallel.
One Bandar-Log App instance can run all required stuff.
bandarlogs {               # bandarlogs list, every bandarlog should be inside it (can't be renamed)
    <bandarlog-1> {        # bandarlog unit (can be renamed to any name)
        ...
    }
    ...

    <bandarlog-n> {
        ...
    }
}
Bandarlogs are isolated therefore any connection/semantics issues affected one bandarlog won't affect others.
Each bandarlog has several mandatory properties:
- Enabled - flag to enable/disable bandarlog unit
enabled = true
- Bandarlog type - can be
kafkaorsqlaccording to data source
bandarlog-type = "kafka"
- Column type - for
sqlbandarlog (see SQL section).
column-type = "timestamp"
-
Data source & Connector - see Data sources section.
-
Metrics - list of metrics which are should be calculated and reported (see Metric).
metrics = ["IN", "OUT", "LAG"]
-
Reporters - see Reporter section.
-
Scheduler - specifies bandarlog execution time
scheduler {
  delay.seconds = 0              # delay in seconds before bandarlog is to be executed
  scheduling.seconds = 60        # time in seconds between bandarlog executions
}
- Tables/Topics (according to the bandarlog type) - each metric will be calculated and reported for each table/topic from the list.
SQL tables:
tables = [                                                 # example of config for table when column-type = datetime
  {
    in-table = "in_table_1"                                # table name for for the IN metric
    in-columns = ["year=yyyy", "month=MM", "day=dd"]       # <column>=<format> pairs for the IN metric
    out-table = "out_table_1"                              # table name for for the OUT metric
    out-columns = ["year=yyyy", "month=MM", "day=dd"]      # <column>=<format> pairs for the OUT metric
  },
  {
    in-table = "in_table_n"
    in-columns = ["date=yyyy-MM-dd HH:mm:ss"]
    out-table = "out_table_n"
    out-columns = ["date=yyyy-MM-dd HH:mm:ss"]
  },
  ...
]
tables = [                                                 # example of config for table when column-type = timestamp
  {
    in-table = "in_table_1"                                # table name for for the IN metric
    in-columns = ["in_column_1"]                           # column name for the IN metric
    out-table = "out_table_1"                              # table name for for the OUT metric
    out-columns = ["out_column_1"]                         # column name for the OUT metric
  },
  ...
]
Kafka topics:
topics = [
  {
    topic-id = "topic_id"                     # user-friendly topic id, every metric will be tagged with this value
    topic = ["topic_1", "topic_2"]            # kafka topics
    group-id = "group_id"                     # kafka group id
  },
  ...
]
Bandar-Log measures three fundamental metrics IN, OUT, LAG whose semantics depends heavily on bandarlog-type (kafka, sql).
Bandarlog object contains section metrics to specify either all of them or just required subset.
metrics = ["IN", "OUT", "LAG"]
Note
Bandar-Log assumes that Kafka consumer component that require to me monitored, commit their offsets back to Kafka using Kafka API.
The following metrics are available for bandarlog with type kafka :
| Metric | Reporting metric name | Value type | Required params | Description |
|---|---|---|---|---|
IN |
*.in_messages |
incoming messages (long) | topic |
Number of incoming messages across all topic partitions calculates as SUM of leader offsets ** for all topic partitions fetched from Kafka API (getLatestLeaderOffsets) using topic from topics list |
OUT |
*.out_messages |
consumed messages (long) | topic, group-id |
Number of consumed messages across all topic partitions calculates as SUM of consumer offsets ** for all topic partitions fetched from Kafka API (getConsumerOffsets) using topic and group-id from topics list |
LAG |
*.lag |
unconsumed messages (long) | topic, group-id |
Number of unconsumed messages, calculates as Sum(leader offsets - consumer offsets) ** per topic |
* reporting prefix
** according to kafka architecture, offset is an order of messages
Note
Bandar-Log assumes:
- ETL components use dedicated column(s) to mark and isolate specific piece of processed data.
- Column can be of several types according to data type of partition column:
timestampordatetime.- The semantics of
timestampcolumn (here and futher calledbatch_id[name is configurable]) is Unixtime timestamp measured in milliseconds (UTC by definition) which determines a moment of time when piece of data has been processed.- This column must be fetched using query
SELECT MAX(batch_id) FROM :table.- The semantics of
datetimeis Date/Timestamp (e.g., '2013-01-01' or '2015-04-09 14:07'). There can be several columns of typedatetime. Along with the column name the appropriate format must be provided via config for parsing the partition values to date represented by milliseconds. The format is according to Date and Time Patterns in Java SimpleDateFormat.- These columns must be fetched using query
SELECT DISTINCT year, month, day FROM :table- In case of the AWS Glue connector, a dedicated column (for example, batch_id) should be a partition column. Thus, having a metadata table generated by AWS Glue crawler, Glue client can extract maximum value for partition column without the need for scanning the whole table in AWS Athena.
(for presto with optimize_metadata_queries=true connection setting)
The following metrics are available for bandarlog with type sql :
| Metric | Reporting metric name | Value type | Required params | Description |
|---|---|---|---|---|
IN |
*.in_timestamp |
timestamp (long) | in-table |
Timestamp fetched from in-connector data source using <table>:<column> pair from in-table property |
OUT |
*.out_timestamp |
timestamp (long) | out-table |
Timestamp fetched from out-connectors data sources using <table>:<column> pair from out-table property |
LAG |
*.lag |
diff in milliseconds (long) | in-table, out-table |
Difference between IN and OUT timestamps (LAG = IN - OUT) |
REALTIME_LAG |
*.realtime_lag |
diff in milliseconds (long) | out-table |
Difference between current timestamp in UTC and OUT timestamp (REALTIME_LAG = System.currentTimeMillis() - OUT) |
* reporting prefix
Reporter API for the specific monitoring service like Datadog.
Reporters configuration:
report {                                           # each metric will be reported using these properties
  prefix = "vertica_metrics"                       # report prefix which should be used for reported metrics (kafka_metrics.in_messages..)
  interval.sec = 180                               # reporter running interval
}

reporters = [                                      # list of reporters, where each metric should be reported
  {
    type = "datadog"                               # reporter type
    config-id = "datadog-config"                   # reference to reporter config
  }
]
Currently, we are using Datadog reporter as a single reporter for bandarlog metrics.
Inside datadog reporter configuration you can specify host, metrics prefix and running interval for datadog reporter.
Also, we are using Datadog tags to keep metrics data aggregated, look at Reporting Tags section for more details.
configuration:
datadog-config {                      # datadog reporter config id
  host = null                         # use 'null' to use local datadog agent or specify host value
}
Tags are a way of adding dimensions to metrics, so they can be sliced, aggregated, filtered.
| Metric | Tags |
|---|---|
IN |
topic:<topic-id> |
OUT |
topic:<topic-id>, group-id:<group-id> |
LAG |
topic:<topic-id>, group-id:<group-id> |
* <topic-id> and <group-id> are placeholders for topic values from topics=[...] list inside kafka bandarlog config
| Metric | Tags |
|---|---|
IN |
in_table:<in-table>, in_connector:<in-connector> |
OUT |
out_table:<out-table>, out_connector:<out-connector> |
LAG |
in_table:<in-table>, in_connector:<in-connector>, out_table:<out-table>, out_connector:<out-connector> |
REALTIME_LAG |
out_table:<out-table>, out_connector:<out-connector> |
* <in-table> and <out-table> are table placeholders from tables=[...] list inside sql bandarlog config.
<in-connector> and <out-connector> are placeholders from tag value inside in/out connector config.
env:<environment>
<environment> value will be fetched from APP_ENVIRONMENT variable if it does not exist - the tag will not be reported.
You can specify your own reporting tags, just add the following config to your bandarlog with a required key-value pair.
bandarlogs {
  example-bandarlog {
    ...
    tags = [
      {
        key = "<tag_name>"
        value = "<tag_value>"
      }
    ]
    ...
  }
}
-
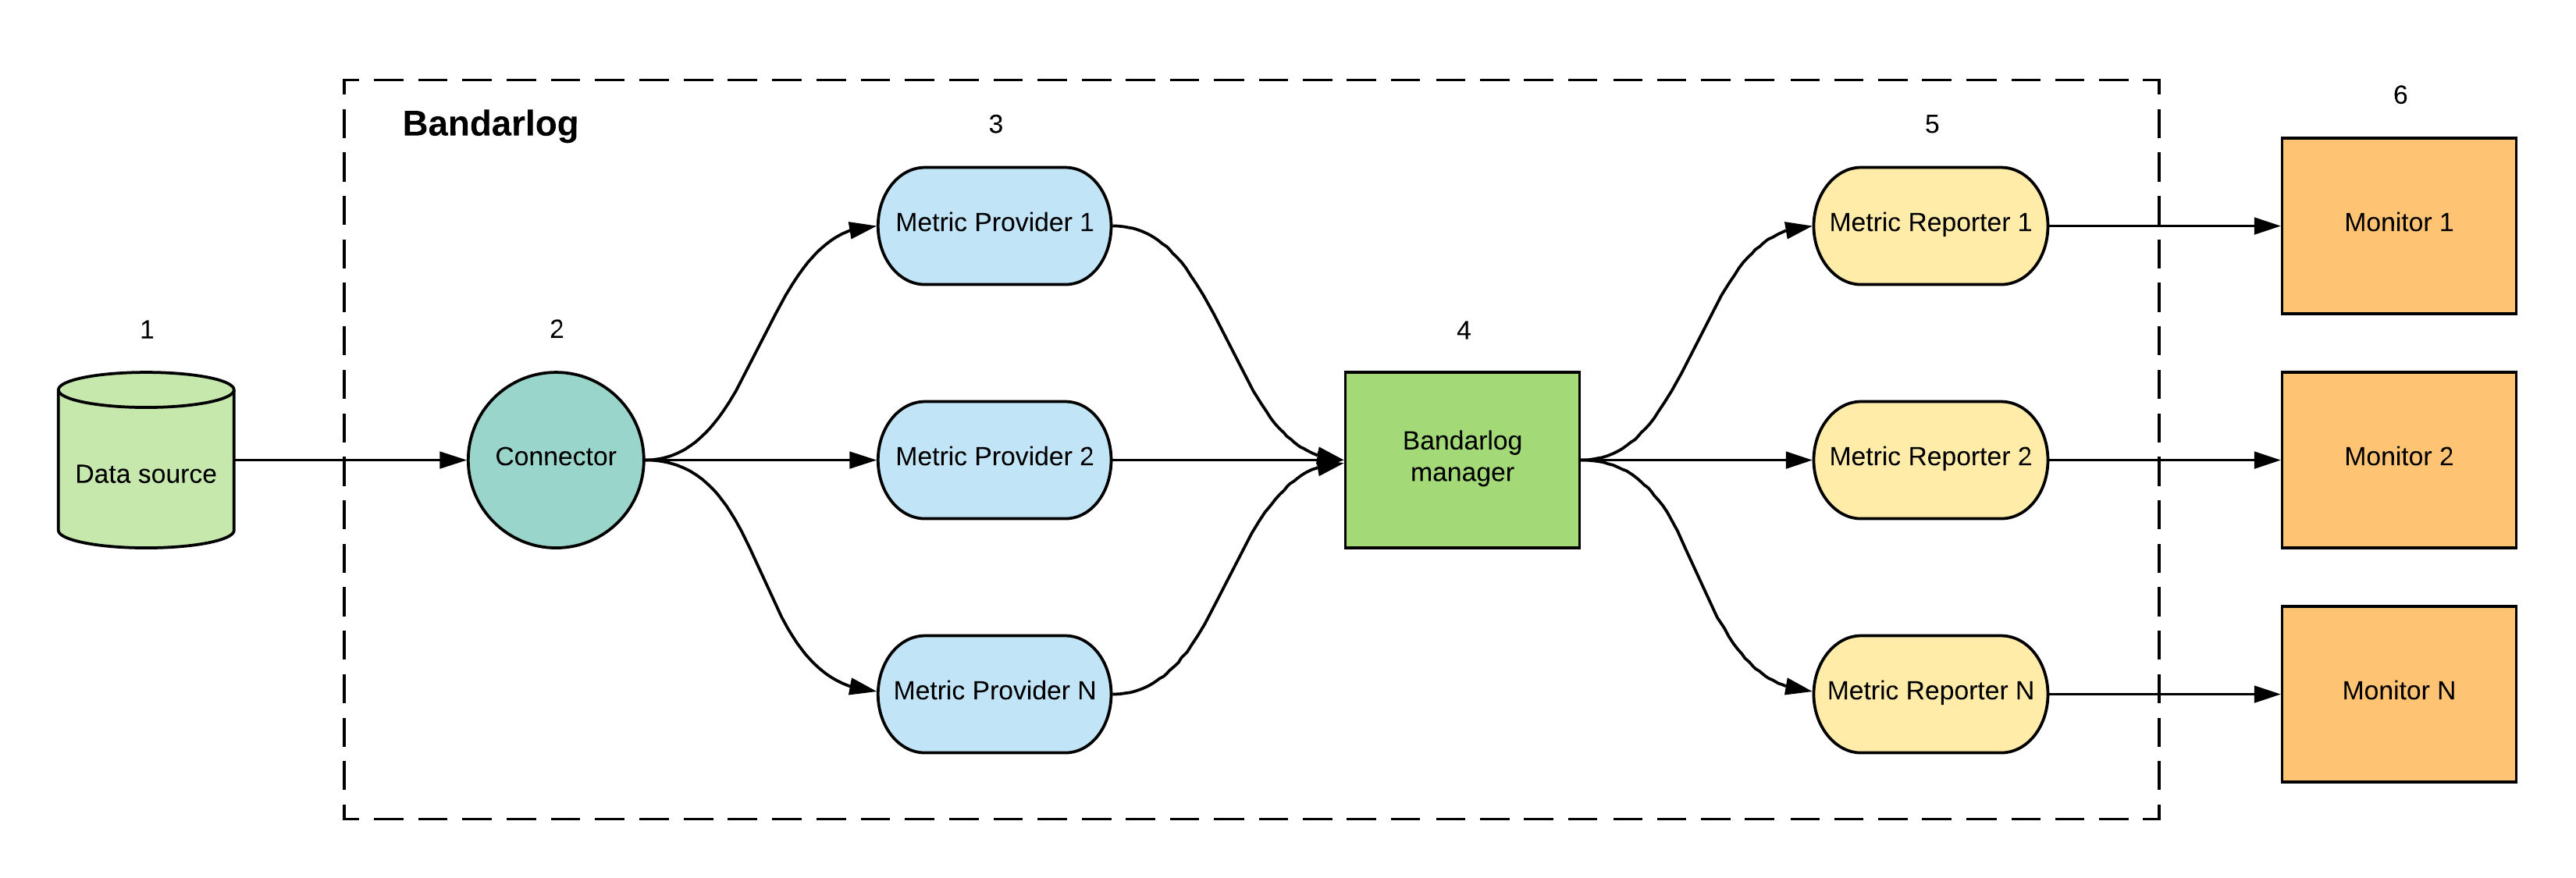
Data source
Kafka, Vertica, Presto, AWS Glue Data Catalog. -
Connector
API layer over data source. -
Metric Provider
Metric Provider calls connector API to fetch data from data source and calculates specific business metrics based on it. Each metric has appropriate metric provider accordingly tobandarlog-type.
For exampleINmetric forbandarlog-type = "kafka"will useKafkaInMessagesProviderbut forbandarlog-type = "sql"it will useSqlTimestampProvider. -
Bandarlog manager
Bandarlog is a monitoring unit for one or several data sources which is responsible for the managing data providers and reporters. -
Metric Reporter
Reporter API for the specific monitoring service like Datadog. -
Monitor
Metrics monitor in monitoring service.
Published as bandarlog
publish bandarlog image to the local machine:
sbt bandarlog/docker:publishLocal
push image to docker registry:
docker login -u <docker_user> -p <docker_password> <docker_registry>
docker push <image>
Bandar-Log is released under the Apache License, Version 2.0


