This application implements Kalaha Game (See Mancala Game Definition)
The complete walk-through tutorial about this implementation provided in the series of articles I've published here:
Building Mancala Game in Microservices using Spring Boot (Part 1)
Building Mancala Game in Microservices using Spring Boot (Part 2)
Building Mancala Game in Microservices using Spring Boot (Part 3)
Building Mancala Game in Microservices using Spring Boot (Part 4)
The solution uses Microservices architecture for building the game mostly for demonstration purposes!
The implementation consists of two microservices implemented in Java using Spring Boot and Spring Cloud:
-
mancala-api: A TDD based implementation of Mancala Game API with two endpoints:CreateGame Endpoint: To create a new GameSowGame Endpoint: To sow specific pit index of the Game
You can find several Tests created to make sure the implementation covers all possible cases within Kalah Game.
-
mancala-web: provides a simple User interface as a web application to consume Manacala API
Spring BootSpring Cloud, used for building Microservics applications in JavaSpring MVC, for creating RESTful APIVaadin, A modern UI components for building web applications in JavaMongoDB, NoSQL database for persisting the Game informationRedis, Key-Value in-memory data structure for caching the Game instancesCassandra, distributed NoSQL database used as Zipkin storageDocker, for containerization of servicesDocker-Compose, to link the containersConsul, service lookup/discoveryRibbon, client load balancingApache Httpd, request routing and http load balancer.Swagger, Swagger-UI, for API documentationMicrometer, Spring boot default metrics export engineActuator, Monitoring the app, gathering metrics, understanding trafficSpring Sleuth, distributed tracing solution for Spring CloudZipkin, distributed tracing system for tracing service calls and visualizing the traces.WireMock, inter-service communication testingSpring Cloud Contract, Contract Based Testing for Microservices
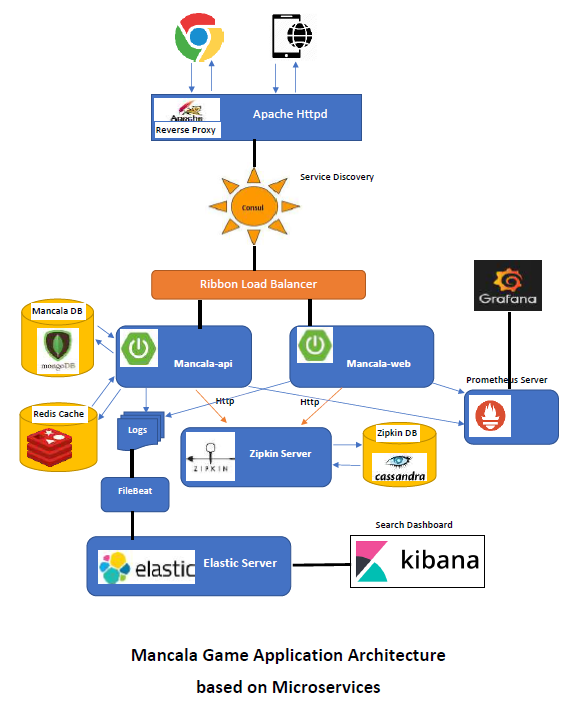
The overal architecture of Mancala Game weill be as below:
This application uses Hashicorp Consul for service registry/discovery and Apache httpd as a reverse proxy to route the calls to the services and as a load balancer. All the Spring Cloud microservices (mancala-api, mancala-web) register themselves in the Consul server.
Consul has a Web UI. You can access it at port 8500 of your Docker host and there is also a link at homepage of this application directing you to the Consul web UI.
Apache HTTP is used to provide the web page of the application at
port 80. It also forwards HTTP requests to the microservices whose ports
are not exposed! Apache HTTP is configured as a reverse proxy for this - and
as a load balancer i.e. if you start multiple instances of a microservices
e.g. via docker-compose scale mancala-api=3, Apache will recognize the new instances.
[.\mancal-game\docker]

    docker-compose scale mancala-api=3
Swagger provides documentation for API. You can check the Mancala Game API at home page.
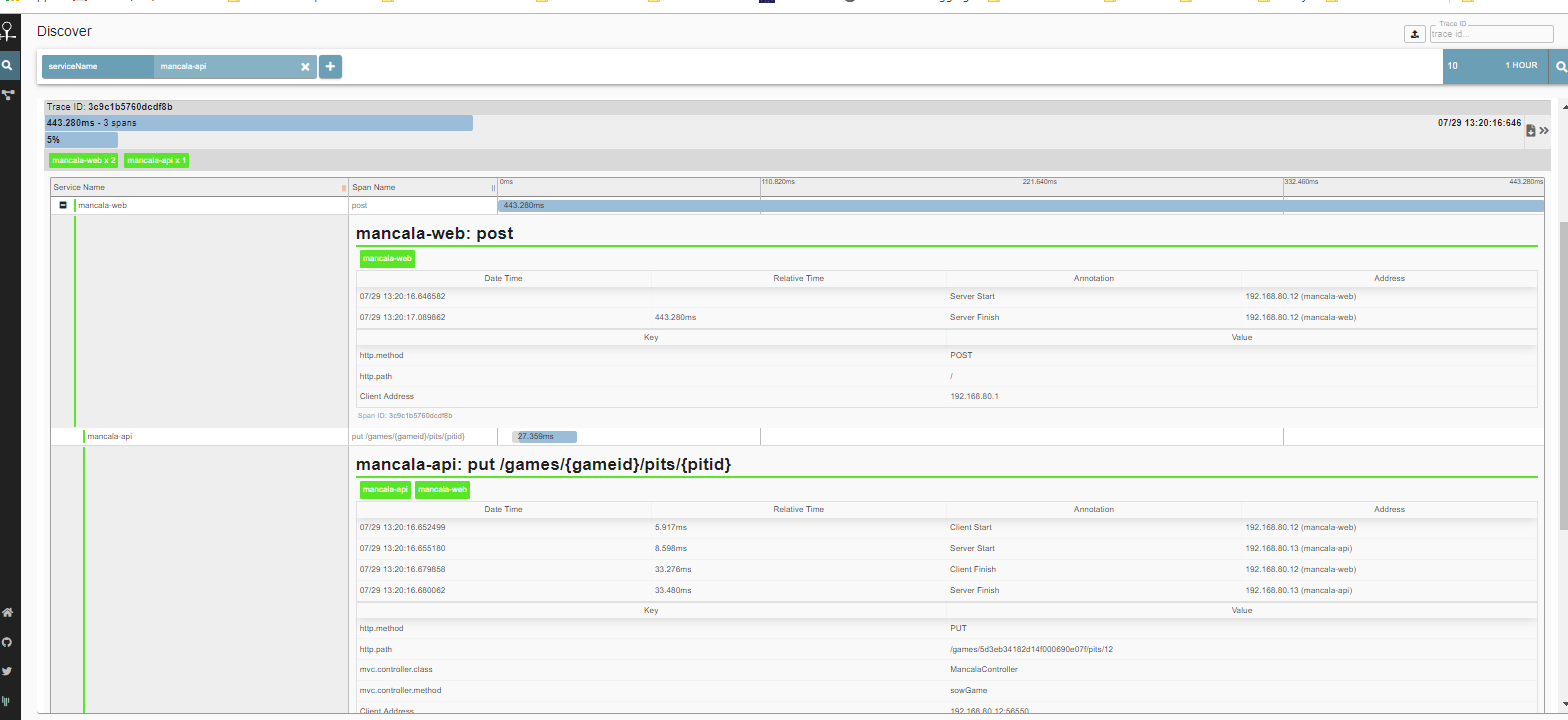
Zipkin is a tool to trace calls across
microservices. Distributed Tracing can be used to measure the performance of the microservices.
In this application, you can access Zipkin dashboard to trace calls between mancala-web and Mancala-api
microservices. These microservices are configured to provide trace information.
You can access Zipkin at http://localhost:9411
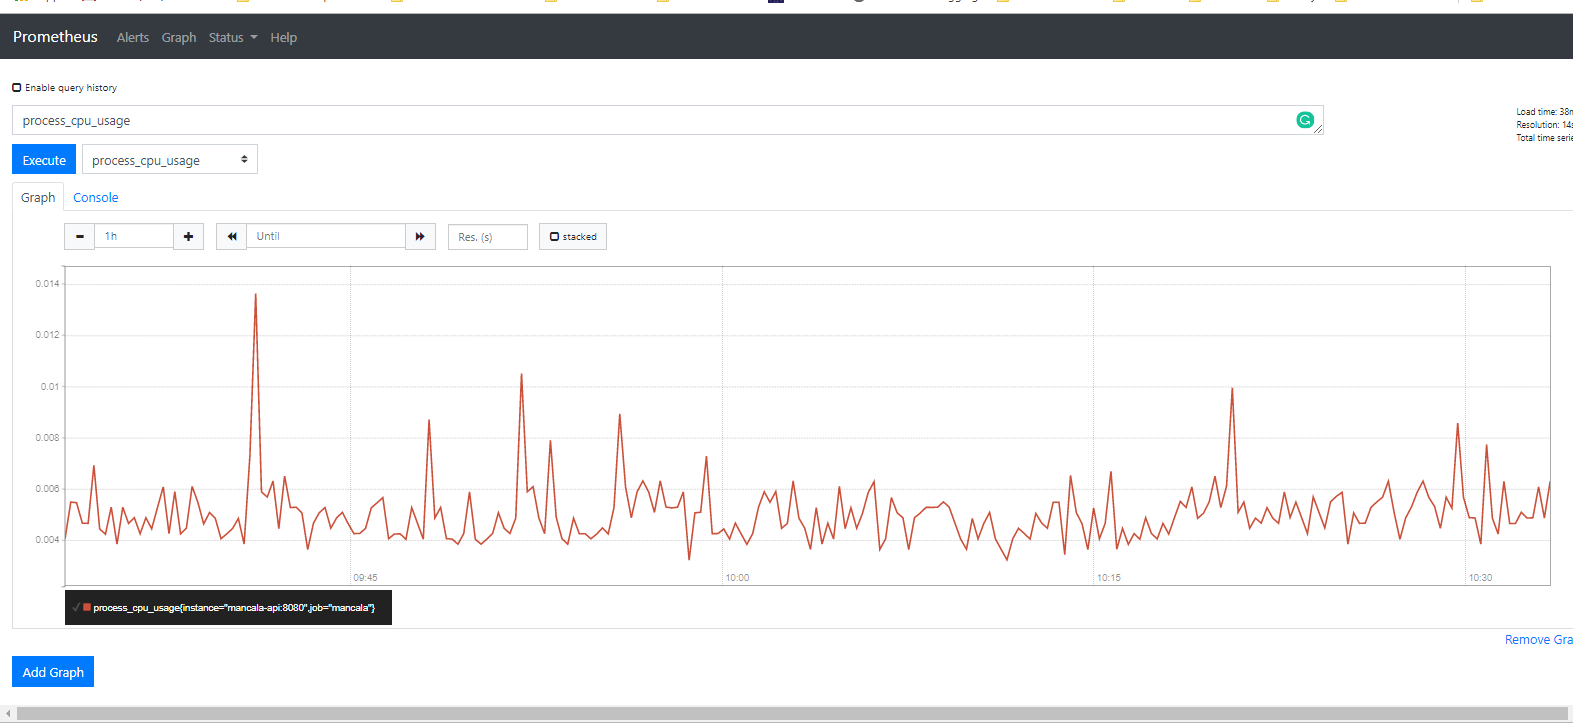
Prometheus is an open-source monitoring system with a dimensional data model, flexible query language, efficient time series database and modern alerting approach.
In this application, microservices are configured to send metrics to Prometheus server for monitoring which can be seen at http://localhost:9090
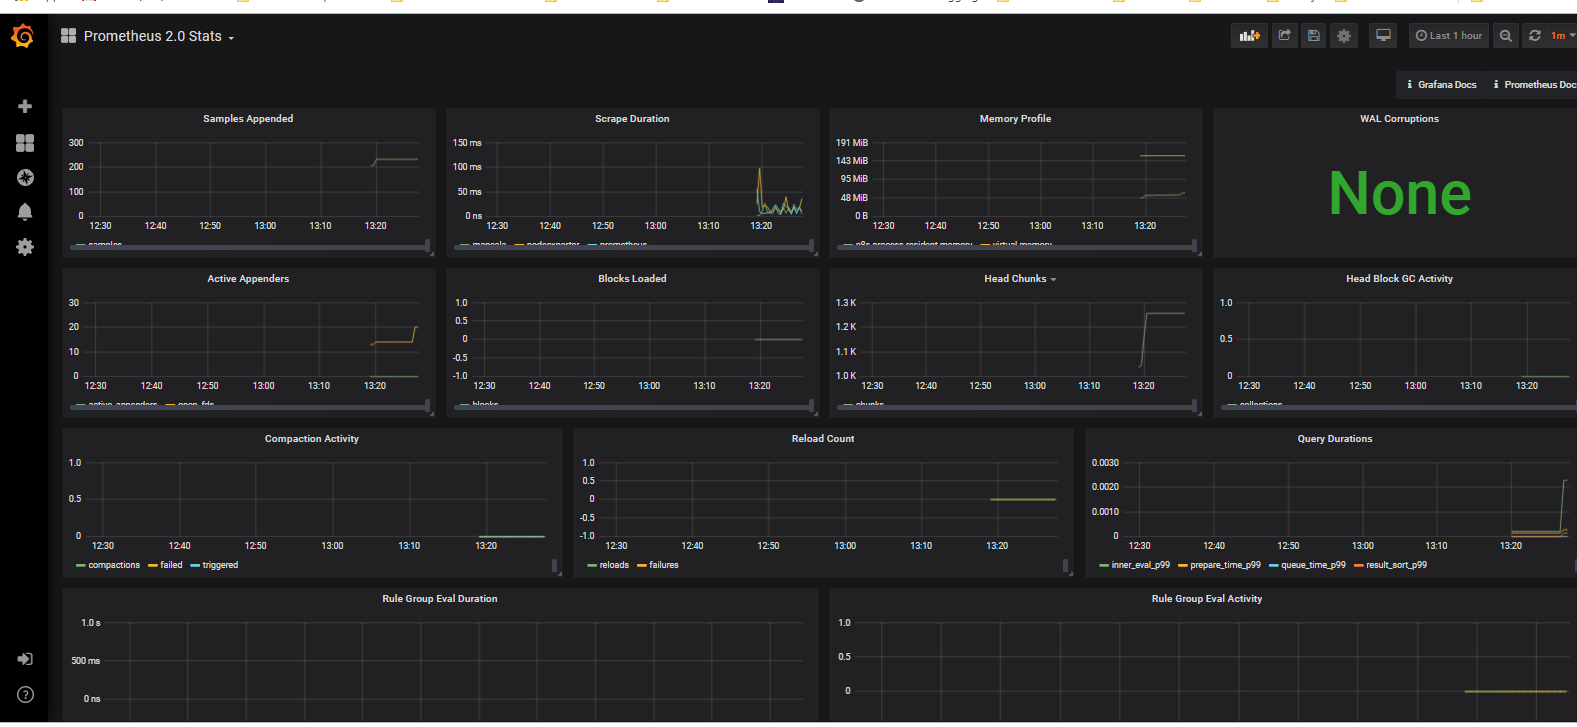
There is also a better tool for monitoring called Grafana which can be used to have better visualization on collected metrics provided by Prometheus server.
You can access to Grafana dashboard at http://localhost:3000
"ELK" is the acronym for three open source projects: Elasticsearch, Logstash, and Kibana which together provides centralized search and analytical solution to our application.
In this application, we have configured Filebeat to send logs generated by our Microservices to Logstash which in turn are transferred to Elastic search server.
You can access to Kibana dashboard at http://localhost:5601
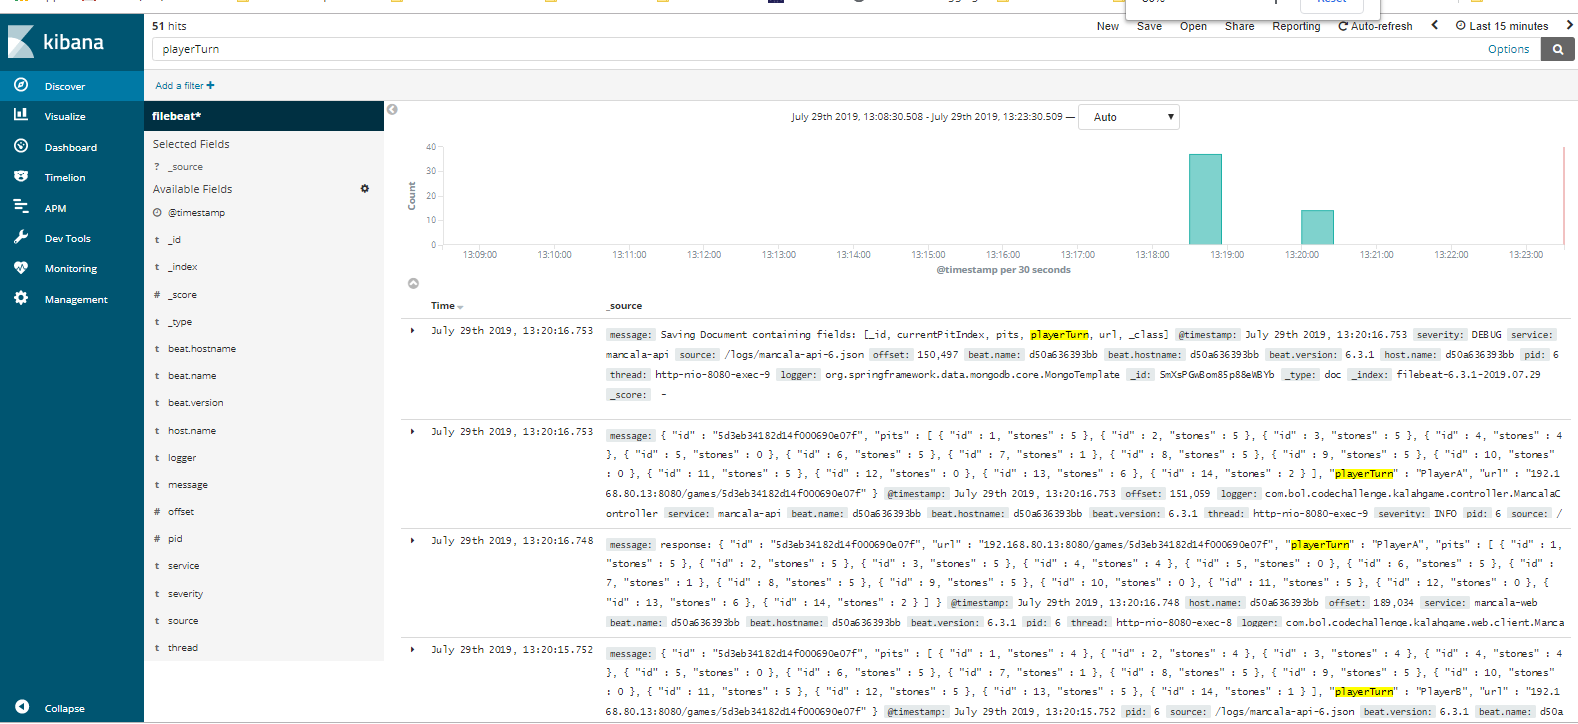
After you configure the Kibana dashboard, you can search on Logs for any data collected by our application, e.g. 'PlayerTurn' to see how playerTurn parameter has changed over several Mancala-api calls to sow() Endpoint.
Before building the game, there is an environment variable called MANCALA_PIT_STONES within docker-compose.yml file for
mancala-api service which allows you to customize the Mancala game based on number of stones. The default value for this
variable is 6 .
See How to build and_run for details.
Once you run the server you can access the Game at this address: http://localhost
Your valuable feedback is highly appreciated.

