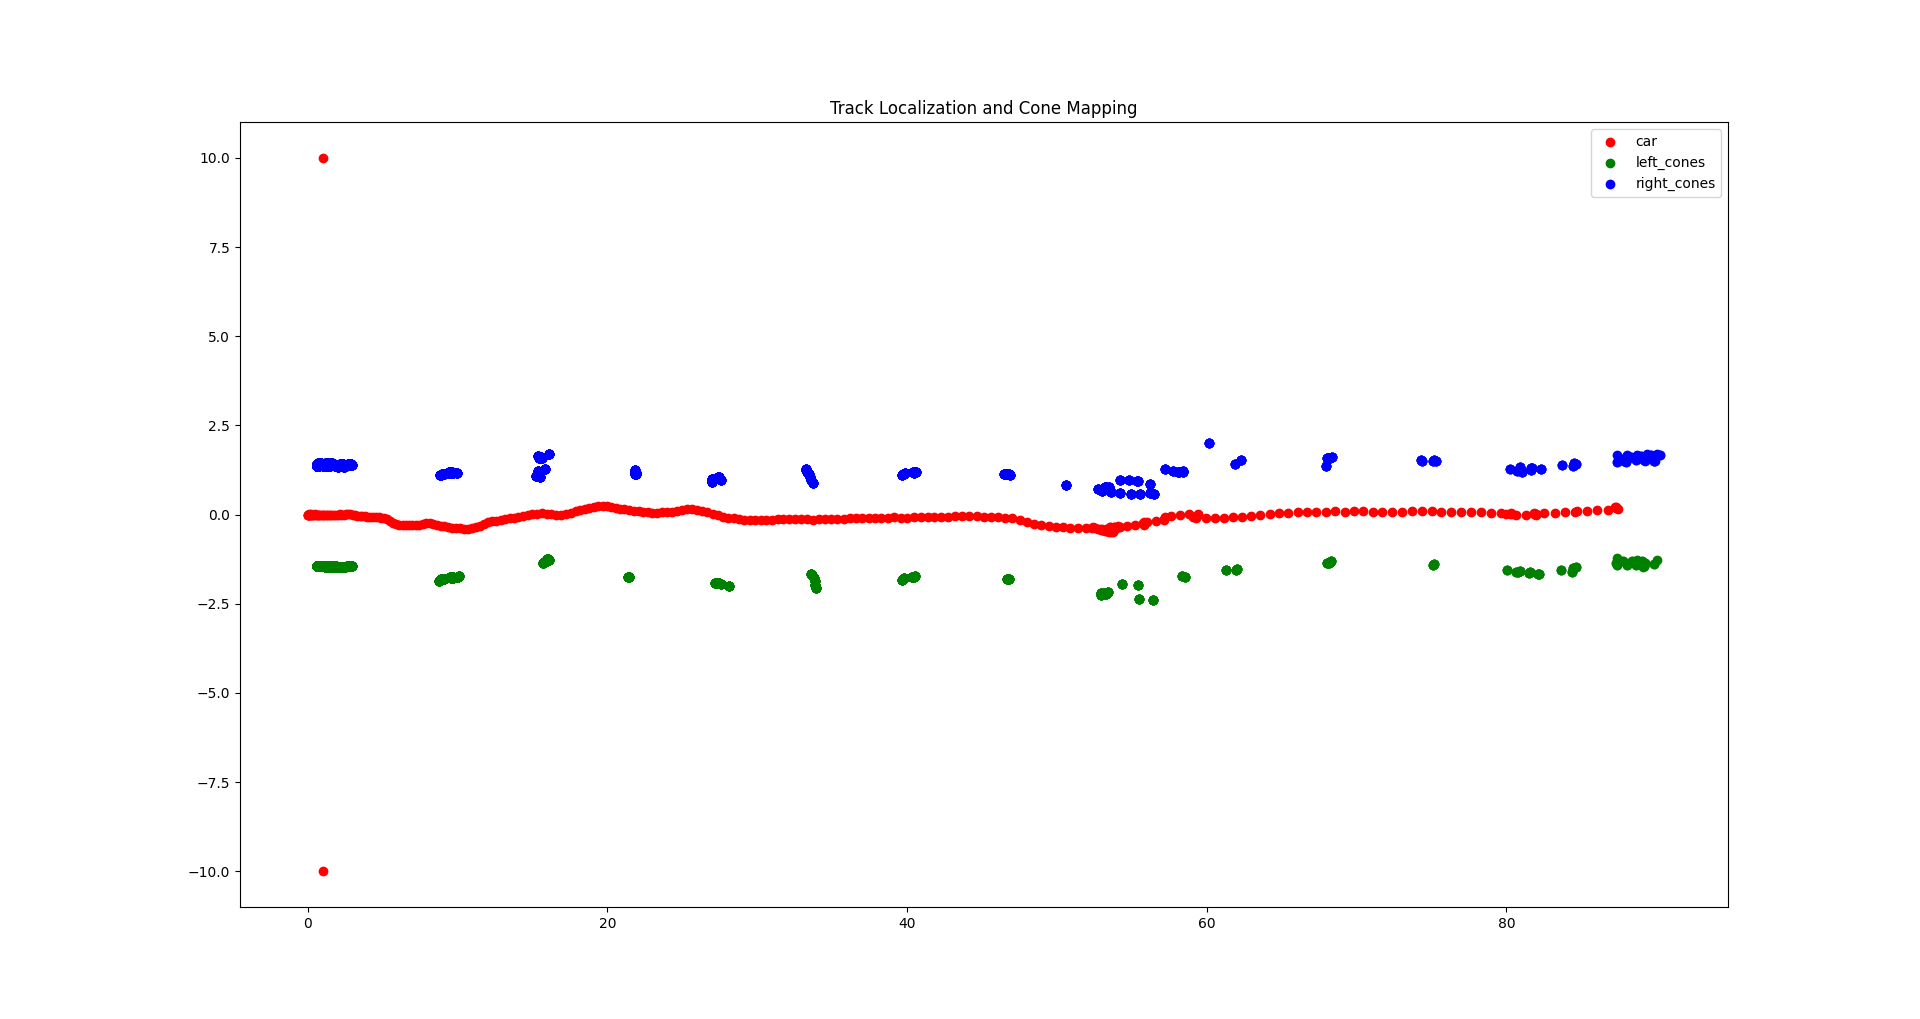
This SLAM implementation leverages the localization module laser_scan_matcher. The placing of the cones is performed by mapping the cones' relative positions with respect to the car using its absolute position pose_stamped generated by laser_scan_matcher.
Hereby follows a concise guide on how to assembly the various components:
foo@bar:~$ git clone https://github.com/unipi-smartapp-2021/SLAM
foo@bar:~$ cd SLAM
foo@bar:~$ git submodule update --init --recursive
foo@bar:~$ sudo apt-get install libgsl0-dev
If catkin_make fails due to missing csm package, install it:
foo@bar:~$ cd src
foo@bar:~$ git clone https://github.com/AndreaCensi/csm
You can install also using
apt install ros-noetic-csm
Overwrite the following files:
foo@bar:~$ cp utils/pointcloud_to_laserscan_nodelet.cpp src/pointcloud_to_laserscan/src/pointcloud_to_laserscan_nodelet.cpp
foo@bar:~$ cp utils/sample_node.launch src/pointcloud_to_laserscan/launch/sample_node.launch
foo@bar:~$ cp utils/laser_scan_matcher.cpp src/scan_tools/laser_scan_matcher/src/laser_scan_matcher.cpp
Try and pray that everything builds:
foo@bar:~$ catkin_makeYou can run the implemented slam node by running the slam.launch launch file:
foo@bar:~$ roslaunch cone_mapping slam.launchIn a different terminal play the desired rosbag:
foo@bar:~$ rosbag play <bag> --clockThe launch file will run the following nodes:
- pointcloud_to_laserscan_node
- laser_scan_matcher_node
- cone_mapping.py
- cone_drawing.py
If you are interested in running individually the nodes just do as follows.
Important You should follow this exact same order in order to succesfully launch the SLAM:
foo@bar:~$ roscore
foo@bar:~$ rosrun pointcloud_to_laserscan pointcloud_to_laserscan_node
foo@bar:~$ rosrun cone_mapping cone_mapping.py
foo@bar:~$ rosparam set use_sim_time true
Then launch the bag, localization and set the simulation clock:
foo@bar:~$ rosbag play <bag> --clock
foo@bar:~$ rosrun laser_scan_matcher laser_scan_matcher_node
Prints the output topics:
foo@bar:~$ rostopic echo /pose_stamped
foo@bar:~$ rostopic echo /cone_right
foo@bar:~$ rostopic echo /cone_leftIf you want to plot the cones, you must create a bag recording the topic /cone_left /cone_right /pose_stamped and then launch utils/visualize_cones.py and passing to it the recorded bag file. Example:
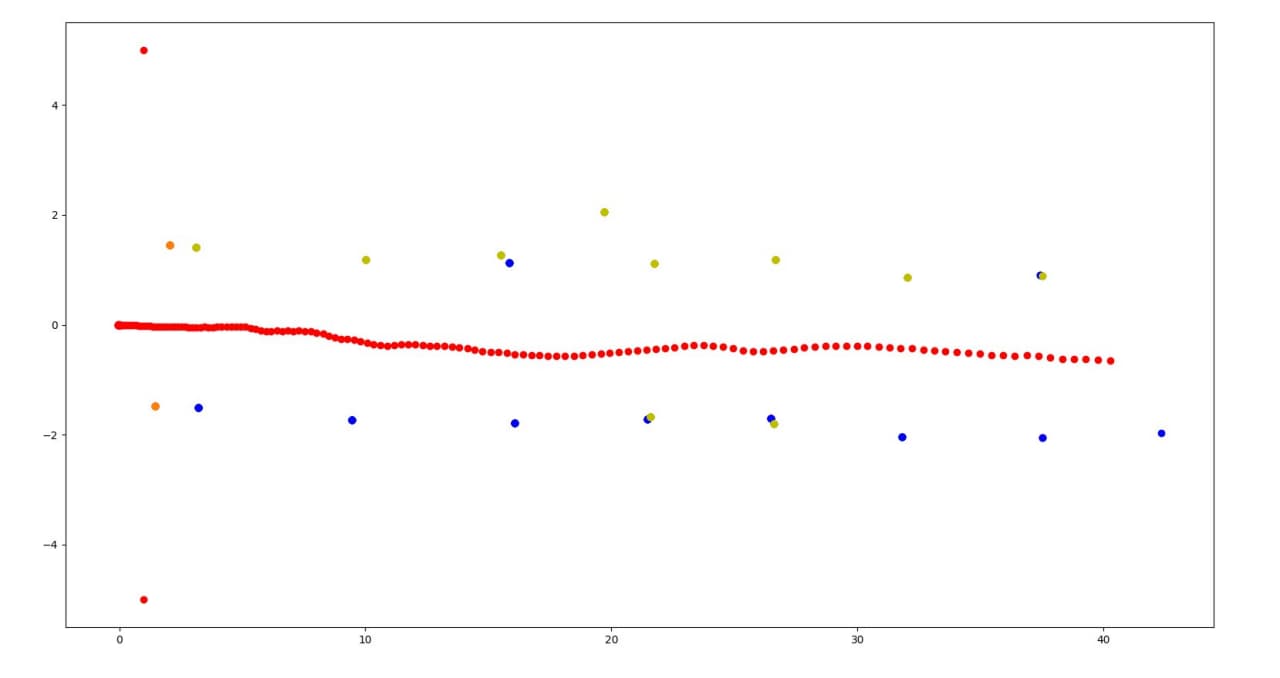
We decided to apply a identity function in order to clean up noisy points. The result is the following:
The identity function relies on the following assumption: a cone can be detected more than one time by the lidar but its absolute position will not vary too much. So, we apply the following tranformation: if the new cone is at distance d from the closer cone c between the already discovered ones, and d < distance_threshold, the new cone is associated to c and thus, only c is returned in output by the algorithm.
However in this way the position of the cone is never updated and tipically in real case scenarios the first detection of a cone is very noisy and must be updated during the run.
So, we decided to apply a transformation of the cone's position by taking all the positions associated to a cone and averaging them. The new position will be the position which represent the cone and ideally it will be very close to the real absolute position of the cone.
We also applied a confidence threshold c_r which will discard all the cones that are detected less than c_r times. This should improve data quality by removing false detections.
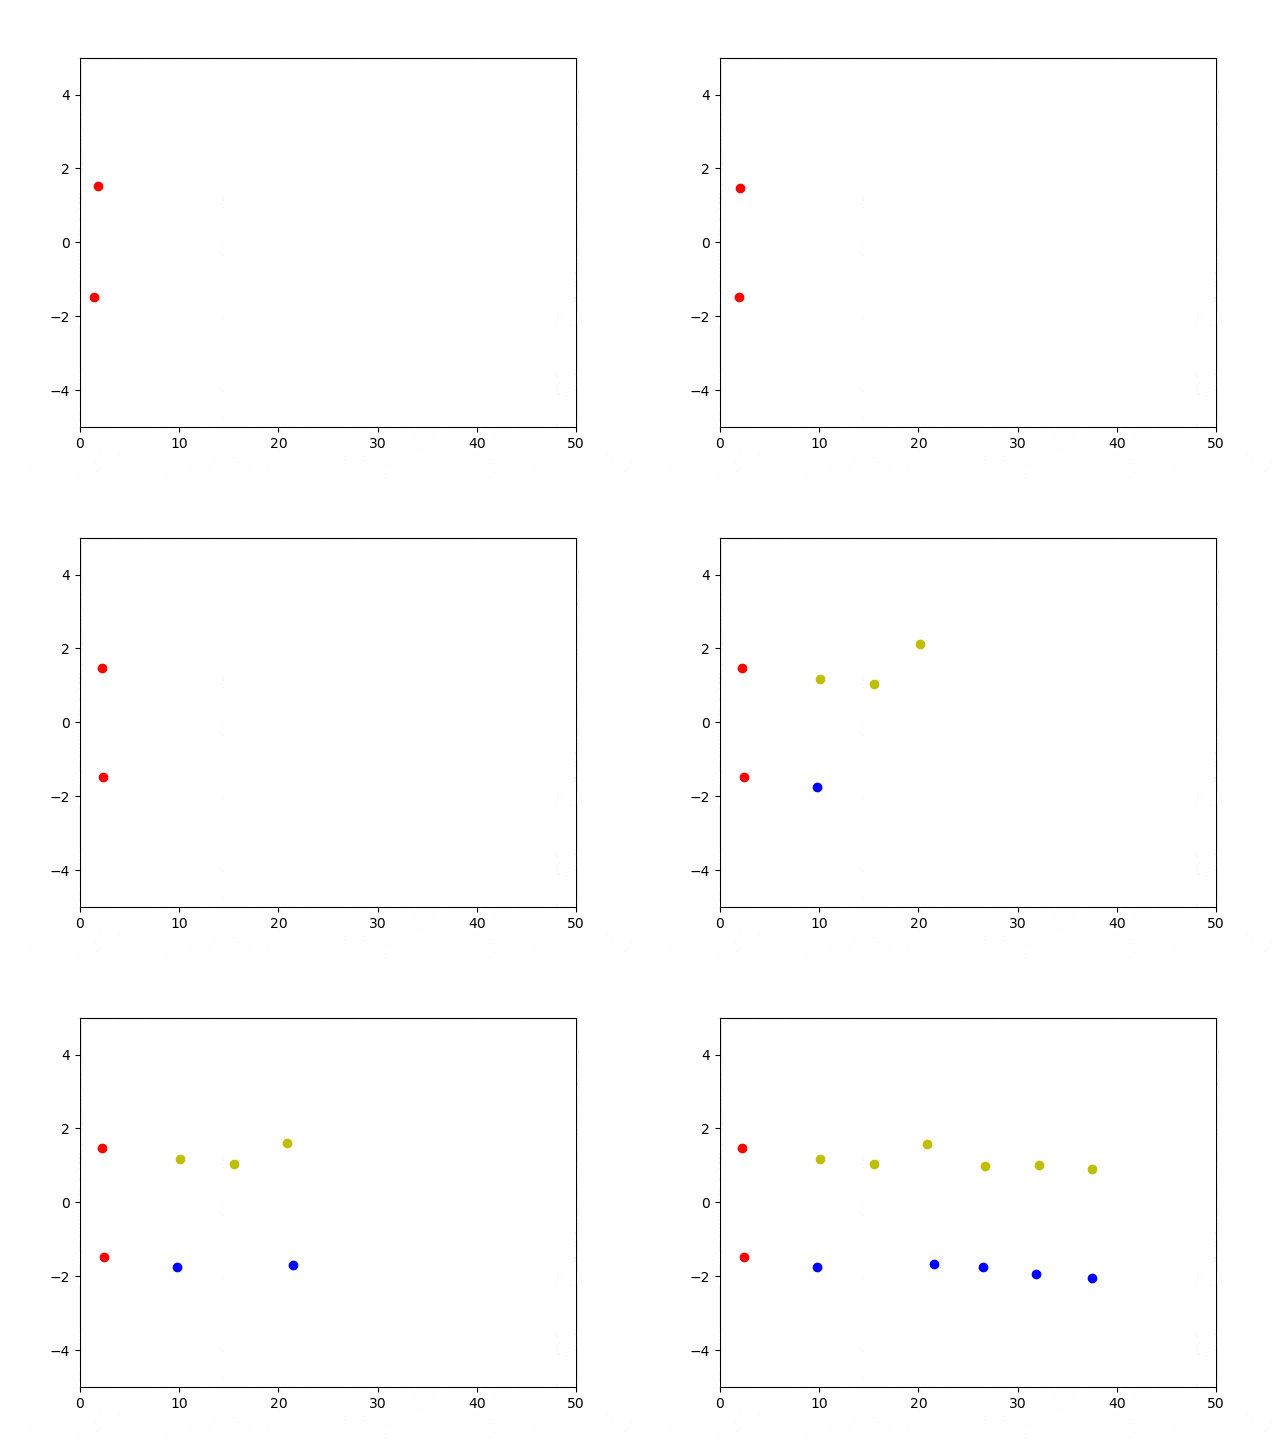
In the following animated GIF we show an example of the cones' positions that are updated during the simulation time. New detections for a specific cone cause a new adjusted position for that cone. Ideally, the more the detections the more the average position will lead to a position close to the reality.
The cone_mapping algorithm also applies an average over the colors detected for a specific cone. This is due to the fact that a cone, especially during the first detections, can be mis-classified with the wrong color. The algorithm given a cone will paint the cone with the most frequent detected color for that cone.
In the TODO list there also some other interesting possible improvements.
You can run the cone_drawing node to visualize at runtime the published cones. Just run
foo@bar:~$ rosrun cone_mapping cone_drawing.pybefore playing the rosbag.
Otherwise you can run visualize_cones.py passing to it a bag file which contains the output of the slam topics in order to visualize the final result of the slam.
Record the slam output:
foo@bar:~$ rosbag record /pose_stamped /cone_orange /cone_right /cone_leftvisualize_cones.py usage:
foo@bar:~$ python utils/visualize_cones.py <output.bag>- Make launchfile
- Use directly Pointcloud instead of converting to Laserscan
- Test on the simulator
- Averaging color detections
- Averaging points of detected cones


