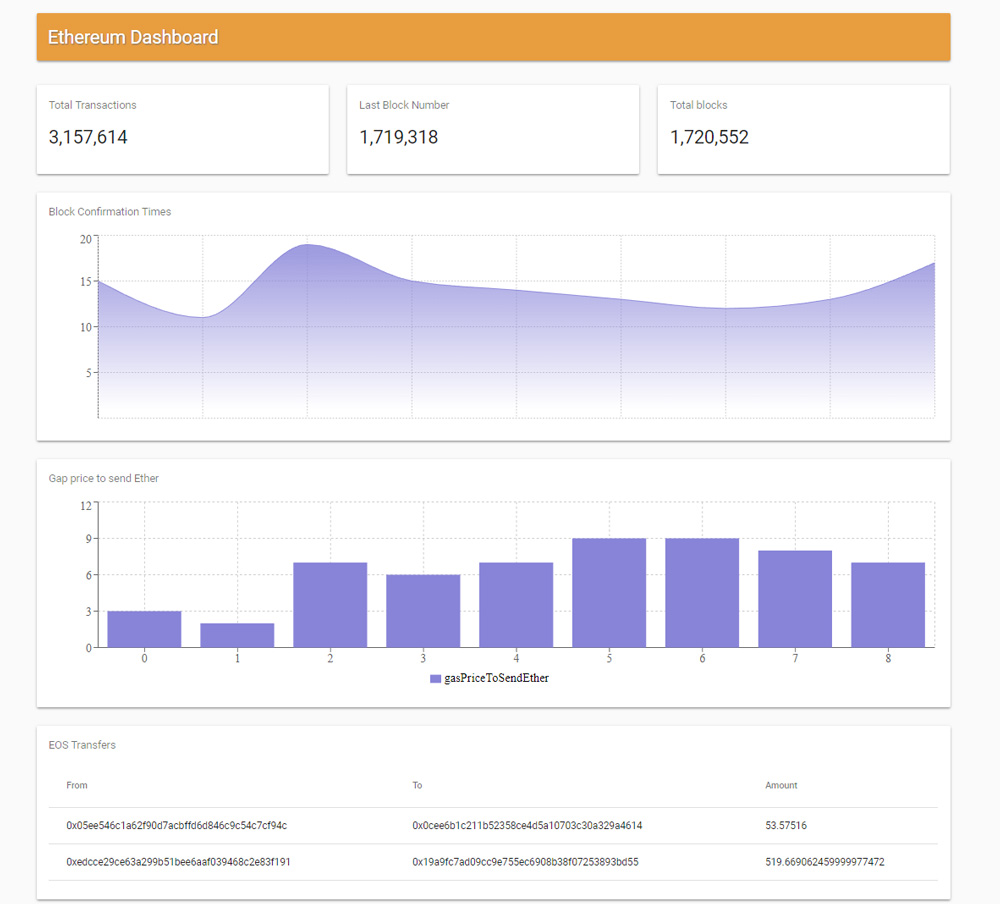
A simple dashboard to view (real-time) metics about the ethereum network.
- The total number of transactions
- The total number of blocks
- more...
NodeJS that serves the client static files, an api layer, and web-sockets for real-time data.
The server communicates with a geth server using JSON-RPC.
React with redux, with web-sockets for the real-time data.
- Install packages using
npm install - Build using
npm run build - Start
geth, make that json-rpc is active athttp://localhost:8545(Default). - Start the server using
npm start - Navigate to http://localhost:3000
- Make sure your
gethis fully synced with the network. - Make sure that
gethhas at least one peer connected, (Issue) - In order to calculate all the transactions, I am querying the entire blockchain. At first, thing might take some time.
- A json file is saved locally with the latest data, to prevent re-querying the blockchain.
- The client opens with some dummy data, it should load the initial state from the server.
- Graph of the gas prices required to get into blocks
- Visualize real time ERC20 token transfers
