This method helps classify different demand patterns (time-series patterns) into groups in order to fit the most appropriate model. More info could be found here and here
This is a Python version of the tsintermittent package in R. At the moment, only the SBC method is available.
pip install sbc-classification
Test data is the clean version of the data from M5 Forecasting Challenge competition on Kaggle. Details can be found here. The dataset was processed to make it easier to test the function.
Note: This function will not treat NA values. All the null values in the time-series should be treated separately.
from sbc import sbc_class.sbc_class

df = pd.read_csv("./tests/data/sales_train_clean.csv")
## multiple targets
out = sbc_class.(df.iloc[:, 1:], plot_type = 'summary')
## 1 target
out1 = sbc_class.(df.iloc[:, 1], plot_type = 'summary')

print(out)
print(out1)
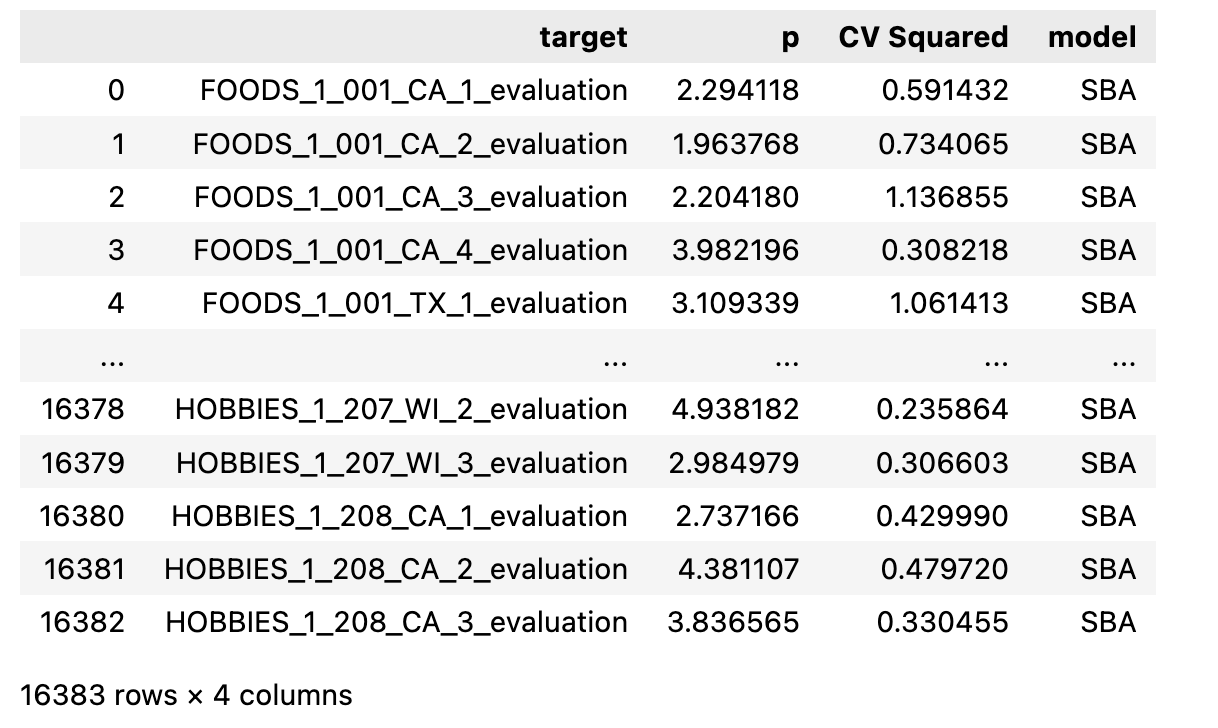
If plot_type is not None, output would be a plot and a dataframe of target_name, p, CV squared and classified model type for multiple targets
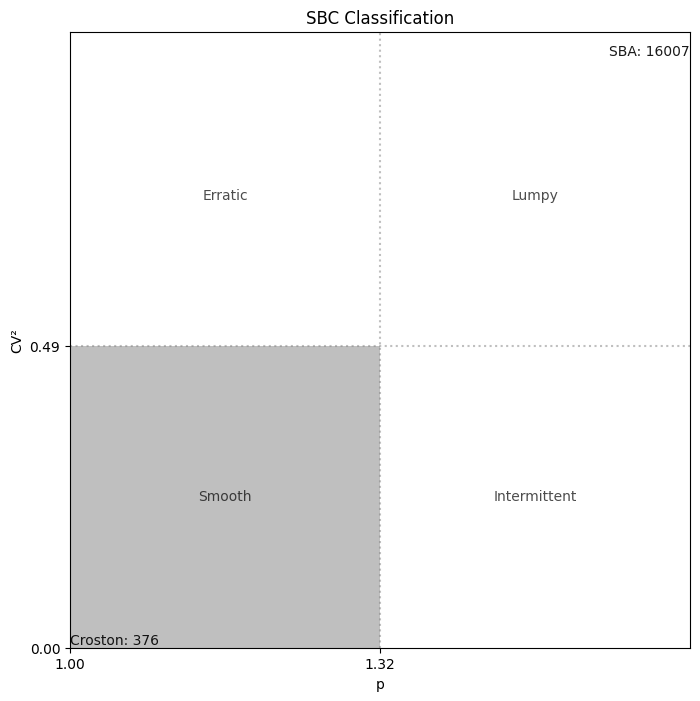
If plot_type is summary then the plot would be a matrix diagram of numbers of time-series in each category
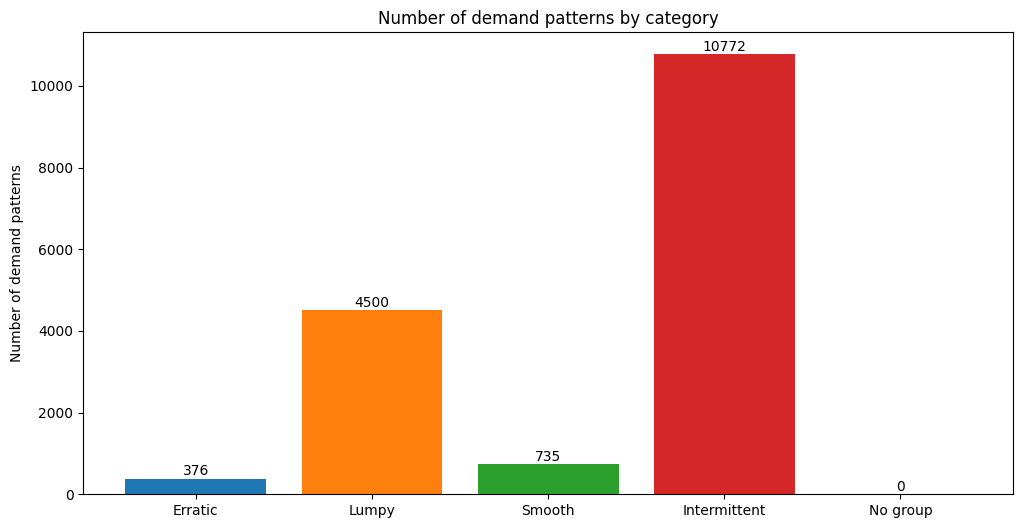
If plot_type is bar then the plot would be bar chart of numbers of time-series in each demand patterns
Please give the package a star if you find it helpful :)


