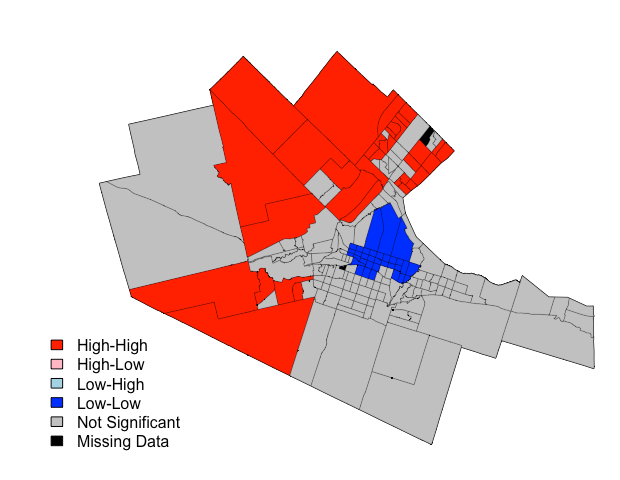
plot.local.moran, produces a cluster plot of Local Moran's I statistic generated by localmoran{spdep}.
| Argument | Description |
|---|---|
| x | spatialpolygonsdataframe |
| variable.name | double quote variable name, e.g. "houseValue" |
| local.moran | localmoran object from spdep |
| weights | spatial weights object from spdep |
| sig | p value, default is sig = 0.05 |
| plot.only.significant | Plot only the statistically significant clusters, default is TRUE |
| legend.location | A single keyword "bottomright", "bottom", "bottomleft", "left", "topleft", "top", "topright", "right" and "center". |
Example code in an Rmd file
This code is modified from https://aledemogr.com/2017/10/16/global-and-local-measures-of-spatial-autocorrelation/
