Reprort PDF
Dimensions of dataset : (2393, 13) Details of ambient air quality with respect to air quality parameters, like Sulfur dioxide, Nitrogen dioxide, Respirable Suspended Particulate Matter (RSPM) and Suspended Particulate Matter (SPM) etc. are given in the datasets.
International Federation of Health Information Management Associations
- To analyze the correlation between pollutants and area.
- Performing various statistical techniques for visualizing patterns in the air quality index.
- Predicting the type of the area depending upon the AQI.
- Exploratory data analysis using visualization tools.
- Clustering
- Predictive modeling
As the data is about the collection of pollution levels around many areas of Orissa and attributes like Agency is of no use for our analysis, it's a constant value attribute after examining the data we also found out the we could also make use the year quarters and season for our analysis, so we wrote the code in R to add those attributes to our dataset the we download from data.gov.
Date: 4th Feb, 2019
- Season column added according to the date in Orissa.
- Type of location ready for classification or regression.
Date: 5th Feb, 2019
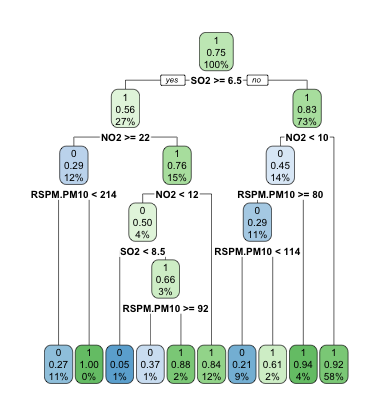
- Decision tree analysis
- Classes in the pollution dataset :


- To make a supervised learning model for TypeOfLocation.
- Clustering.
- Visualization, after calculating AQI.
- Exploratory data analysis.
Date: 11th Feb, 2019 Instustry wise Pollutants visualization.
Date: 20th Feb, 2019
- Visualization part
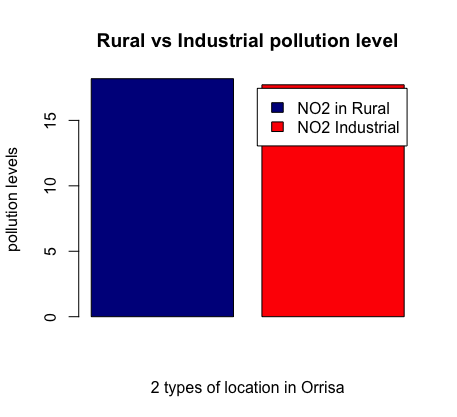
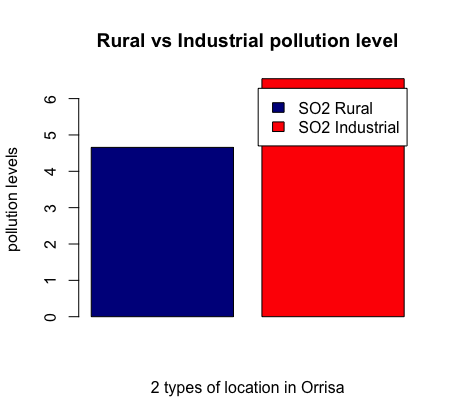
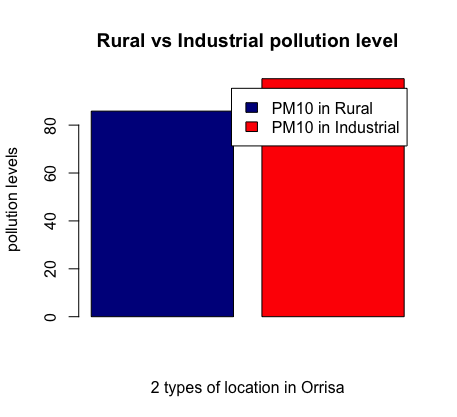


Here we can infer that major factor for SO2 and NO2 pollutants is industrail pollution and RSPM.PM10 pollutants concentration is almost same for industrail and rural areas in Orissa.
Date: 25th Feb, 2019
- Search for new dataset and associate it with data we have.
Date: 27th Feb, 2019


Date: 1st March, 2019


We have applied k-means clustering depending upon the values of the pollutants, so that we can get all those region that have simillar pollutants level


Decision tree for predicting the type of location from training set

Confusion matrix 0 - Industrial, 1 - rural

Confusion Matrix details

