
![]()


use Chart::ECharts;

my $chart = Chart::ECharts->new( responsive => 1 );

$chart->add_xAxis(
    type => 'category',
    data => ['Mon', 'Tue', 'Wed', 'Thu', 'Fri', 'Sat', 'Sun']
);

$chart->add_yAxis(type => 'value');

$chart->add_series(
    name => 'series_name',
    type => 'bar',
    data => [120, 200, 150, 80, 70, 110, 130]
);

# Render in HTML
$chart->render_html;

# Render chart image (require Node.js)
$chart->render_image(
    output => '/my-path/cool-chart.png',
    width  => 800,
    height => 600
);<div id="id_41781780b562926c2c4f3f5ef99f43b381d16726" class="chart-container" style="min-width:auto;min-height:300px;"></div>
<script>
let chart_41781780b562926c2c4f3f5ef99f43b381d16726 = echarts.init(document.getElementById('id_41781780b562926c2c4f3f5ef99f43b381d16726'), 'white', {"locale":"en","renderer":"canvas"});
let option_41781780b562926c2c4f3f5ef99f43b381d16726 = {"series":[{"data":[120,200,150,80,70,110,130],"name":"series_name","type":"bar"}],"xAxis":[{"data":["Mon","Tue","Wed","Thu","Fri","Sat","Sun"],"type":"category"}],"yAxis":[{"type":"value"}]};
option_41781780b562926c2c4f3f5ef99f43b381d16726 && chart_41781780b562926c2c4f3f5ef99f43b381d16726.setOption(option_41781780b562926c2c4f3f5ef99f43b381d16726);
</script>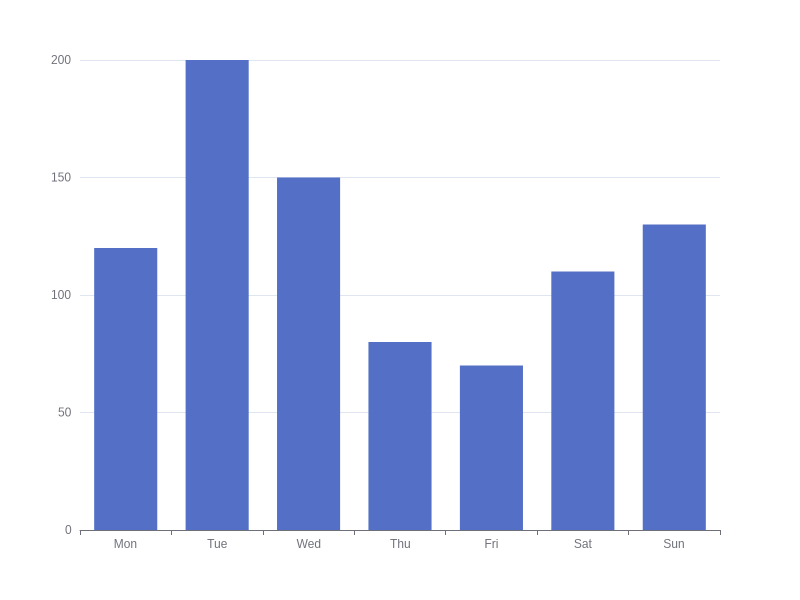
Using Makefile.PL:
To install Chart::ECharts distribution, run the following commands.
perl Makefile.PL
make
make test
make install
Using App::cpanminus:
cpanm Chart::ECharts
- Copyright 2024 © Giuseppe Di Terlizzi