Simple service that watches external URLs, exports custom metrics to Prometheus and finally shows those metrics in Grafana.
- App code (made using Golang), tests and Dockerfile are found in the app folder.
- Kubernetes Deployment specification for App is found in deploy folder.
- Kubernetes Deployment specification for Prometheus is found in deploy folder.
- Custom Grafana dashboard is found in grafana folder.
Code has been tested with the following tools:
- Docker 20.10.20
- Kind v0.17.0
- Kubectl v1.25.2
- Git 2.37.0
kind is a tool for running local Kubernetes clusters using Docker container “nodes”.
make kind-create-clusterAllow a couple of minutes while cluster nodes are running and ready. Use below command to check cluster node status:
kubectl get noUsing the community manifests from repo
Using release-0.10 for compatibility with Kubernetes 1.23. Check the compatibility matrix
make kube-prometheus-installAllow a couple of minutes while all the pods are running and ready. Use below command to check pods status:
kubectl -n monitoring get podsThis will use Docker to build image locally:
make docker-buildmake deploy-appAllow a couple of minutes while the App pod is running and ready. Use below command to check pod status:
kubectl -n apps get podsThen port forward App service:
kubectl -n apps port-forward svc/monitor-urls 8080Then navigate on localhost:8080/metrics
Note: Ctrl+C to finish port forwarding
make deploy-prometheus-monitorAllow a couple of minutes while Prometheus pod is running and ready. Use below command to check pods status:
kubectl -n apps get podsThen port forward to Prometheus service:
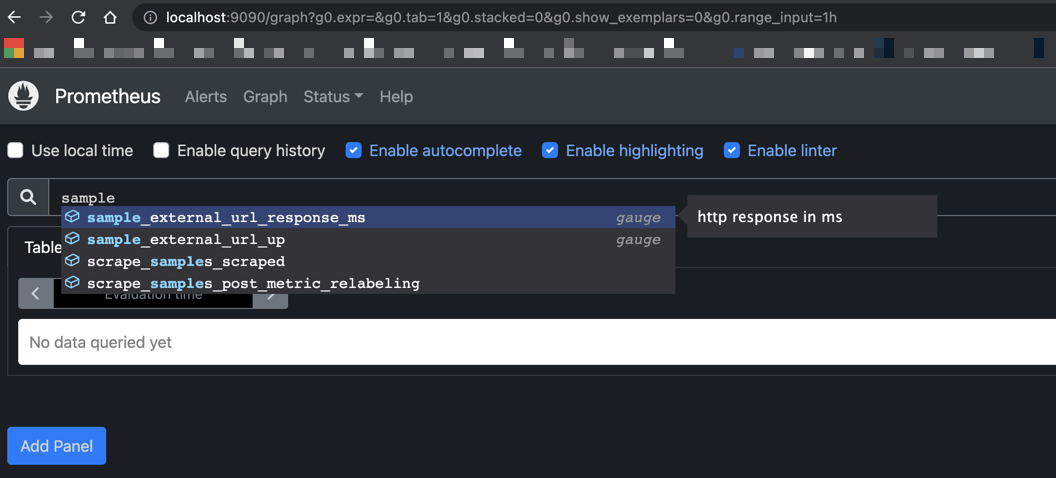
kubectl -n apps port-forward svc/prometheus 9090Then navigate on localhost:9090/targets
You should see how Prometheus is now scraping the App


Note: Ctrl+C to finish port forwarding
kubectl -n monitoring port-forward svc/grafana 3000Then navigate on localhost:3000
- Username:
admin - Password:
admin
It will force you to change password.
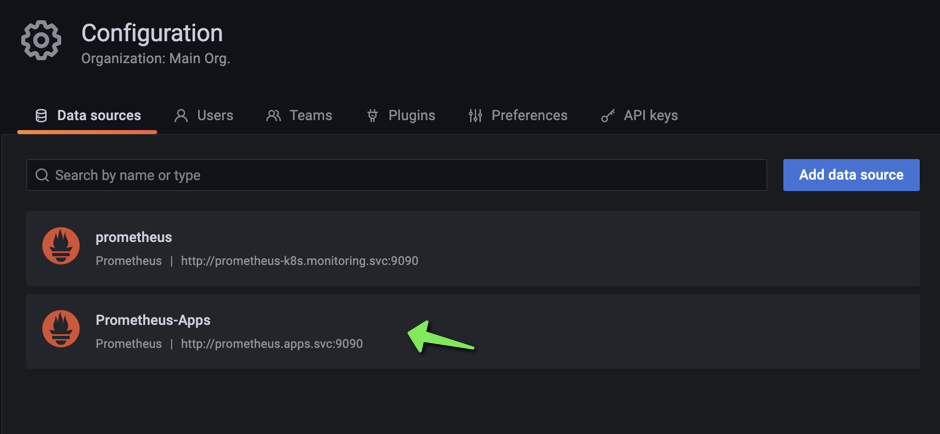
- Go to
Configuration->Data sources->Add data source - Select
Prometheus - Set Data Source Name:
Prometheus-Apps - Set URL:
http://prometheus.apps.svc:9090 - Click
Save & test
New Data source should show after successful completion:

- Go to
Create->Import->Upload JSON File - Open JSON file URL-Monitor-Dashboard
- Select Data Source:
Prometheus-Apps
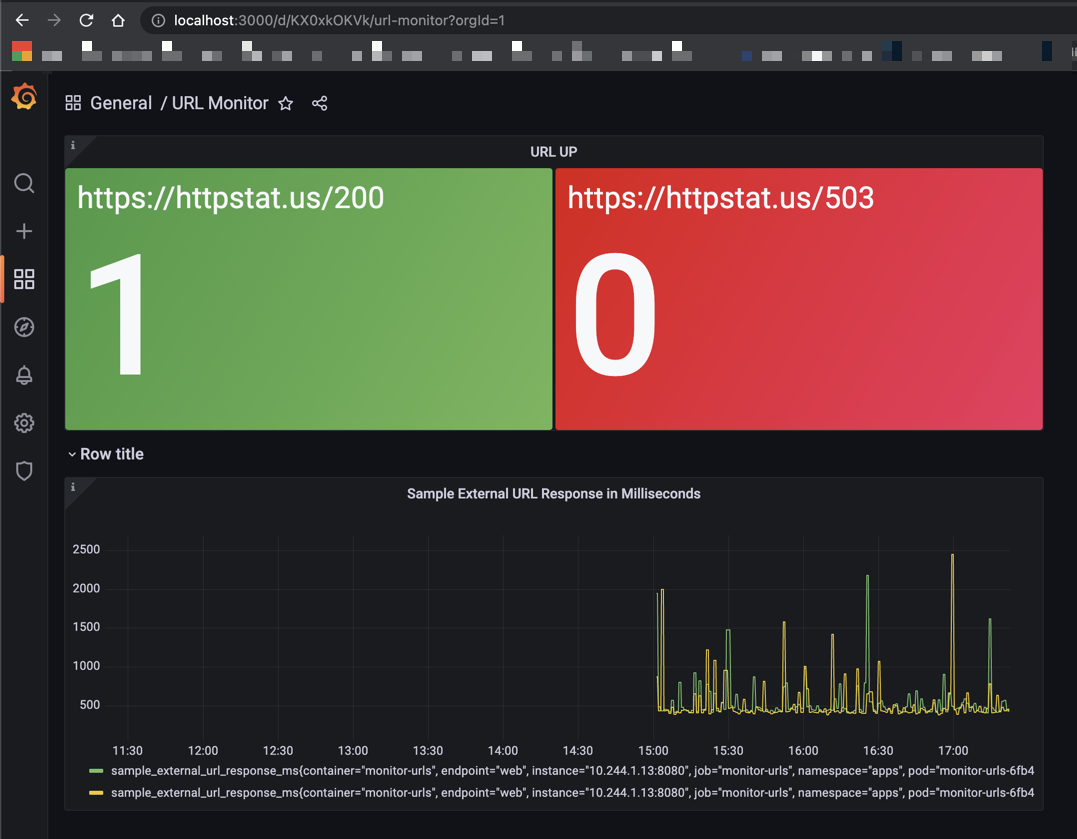
New Dashboard should show after successful completion:

Note: Ctrl+C to finish port forwarding
make kind-delete-cluster