Sample space - S&P500 top 12 tickers based on market cap [MSFT, APPL, TSLA, FB, NVDA, JPM, V, JNJ, UNH, WMT, BAC, PG]
- If prior day close price is more than 200 day exponential moving average:
- prior day 2 day RSI is below 20 and current price is less than camarilla S3:
- BUY
- prior day 2 day RSI is above 80 and current price is greater than camarilla R3:
- SELL
- prior day 2 day RSI is below 20 and current price is less than camarilla S3:
- EMA - Closing price for the last 200 days.
- 2 day RSI - Closing price for the last 3 days
- Camarilla - Previous day High, Low, and Closing
- R3 -> Closing + ((High -Low) x 1.2500)
- S3 -> Closing – ((High -Low) x 1.2500) To start with, all we need is the previous 200 days of Closing, High, Low prices for 12 tickers.
The overall return for strategy: CAGR (Compounded Annual Growth Rate) - Annual rate of return realized by the portfolio to reach its current market value from its initial value Sharpe Ratio - average return earned in excess of the risk-free rate per unit of volatility Max_DD - The largest percentage of drop in the asset price over a specified time period Absolute Return Win rate = number of profitable trades / total number of trades
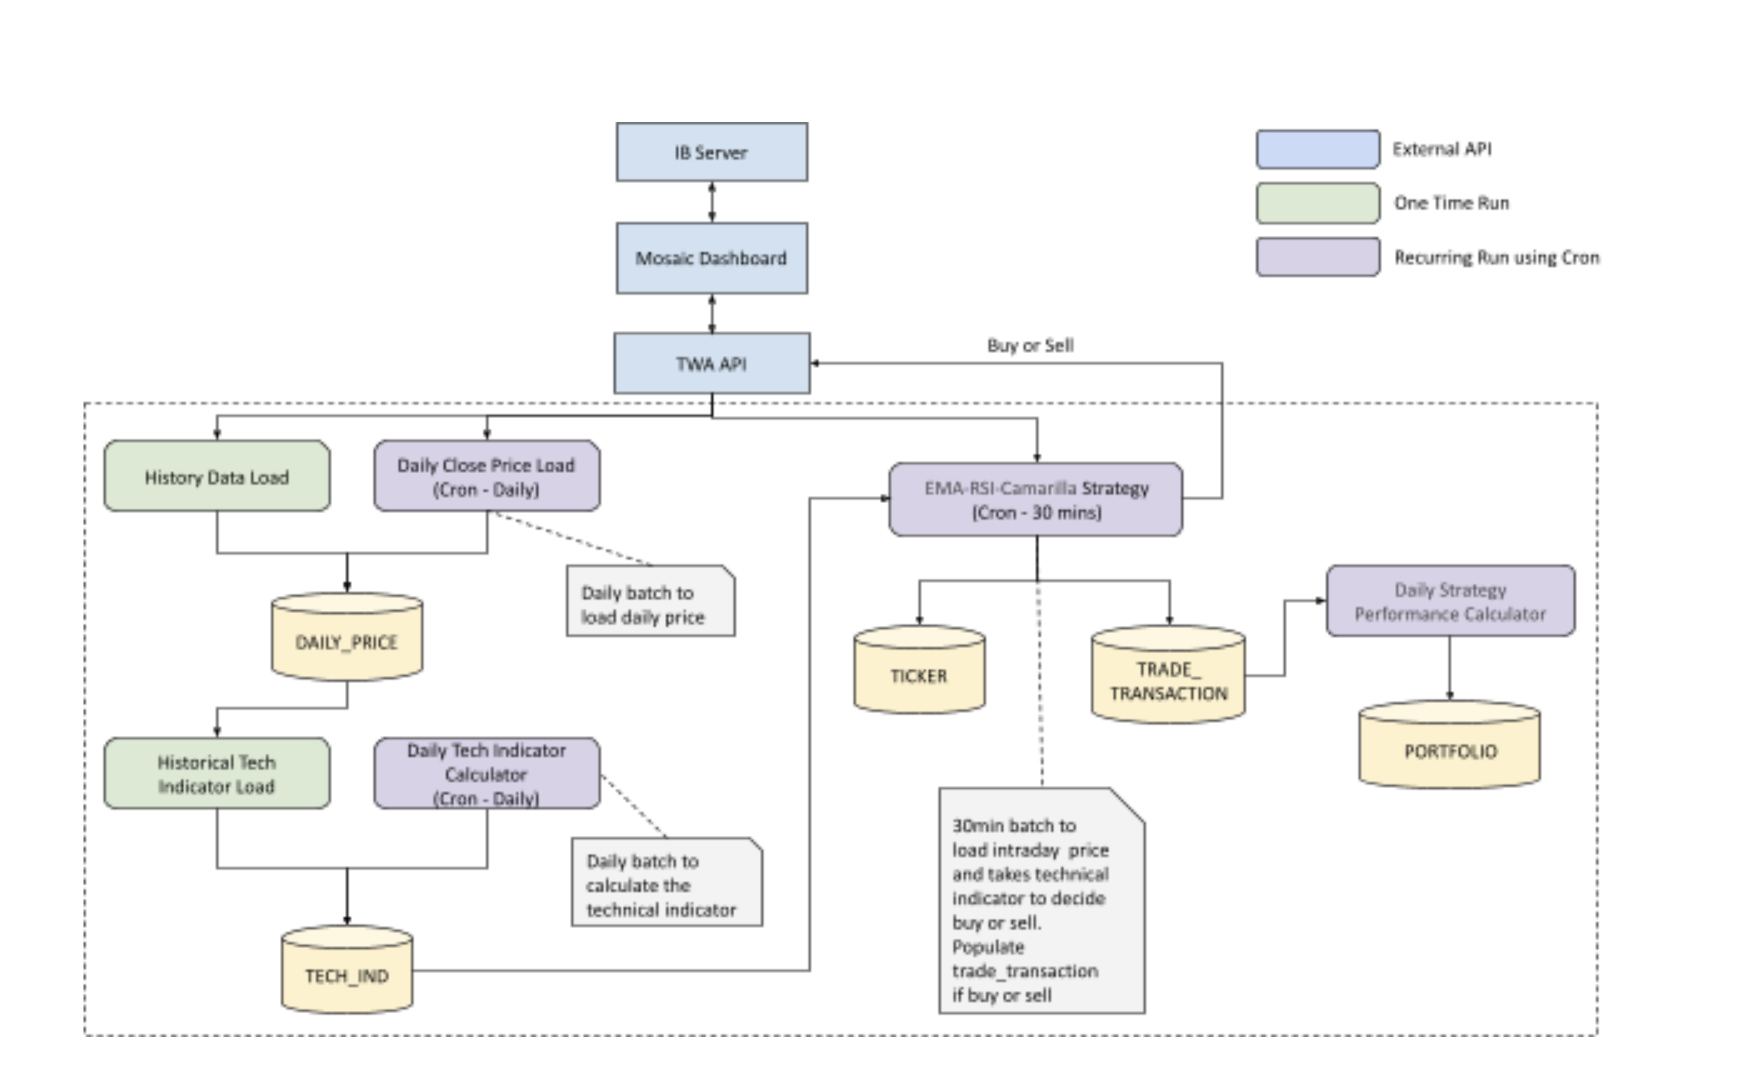
- Daily batch to get the prior day of closing, high and low price for 12 tickers and store it in the daily price table a. One time load of 200 days of prior data is needed
- Calculate the daily technical indicators and store them in the technical indicators table
- 15/30 mins batch to get the current price for all 12 tickers.
- 20/40 mins batch to get technical indicators and decide to buy or sell. a. If buy or sell happens, store in the transaction details table b. Update the portfolio table to keep a cap limit.
