This small project is an extension of my first assignment for my machine learning class. We were tasked with implementing and observing the perceptron algorithm. I was left in awe watching the classifying line inch closer and closer to the boundary line for the first time, and wanted to explore this a little further.
This repo sort of cleans up my past attempts with two-dimensional data, and generalizes it to n-dimensional with weight visualization and a 3D visualization.
The perceptron is an algorithm for linear classification. We feed it a set of input data D where every point in D contains a vector x and a classification ell. Assuming D is linearly separable, we can find a set of weights w that define the hyperplane to divide D.
Let's say we have floor of apples and oranges. We place the apples on one side of the room, and the oranges on another. The perceptron allows us to predict if a given point on this floor will rest on an apple or an orange.
- Point Class
- Benchmark Class (more like a namespace)
- Perceptron Function
- Visualize Class (more like a namespace)
Every Point instance has two attributes: a coordinate vector x and a label ell. The Point class also contains our theta function, which is our linear classifier.
To generate our training data, the Benchmark class holds one function to randomly generate a list of Point instances, and classify their data using a randomly generated hyperplane. This ensures that our data is always linearly separable. More parameters include the number of points N, the margin width gamma, the scale of the data scale, and the dimension of the data i.
Our perceptron function isn't anything special. (: We do have the option to visualize our data every epoch or point.
And last but not least, the Visualize class. There exists functions to plot 2-dimensional and 3-dimensional data, as well as a coefficient plotter for n>3 dimensional data.
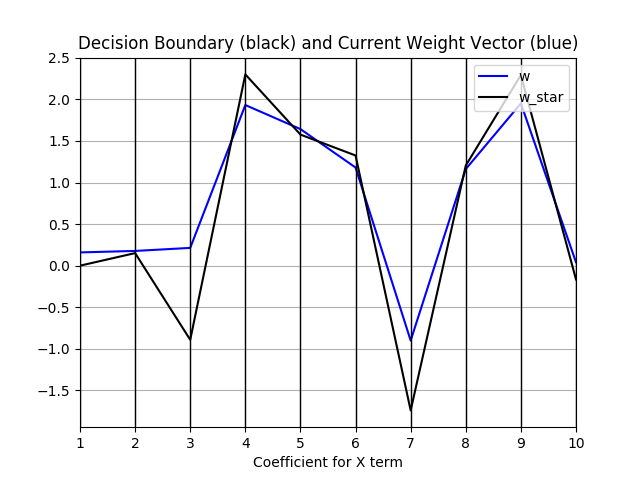
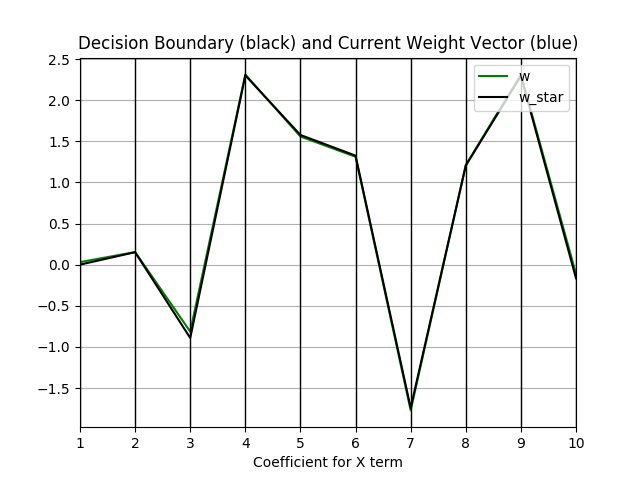
I initially wanted to produce a matrix of plots comparing every pair of dimensions with each other for n>3 data, but quickly realized that this doesn't produce anything meaningful (you can see my past commits for this). Instead, I opted for a parallel coordinate plot that tracks the hyperplane coefficients for our decision boundary and the weights from our perceptron.
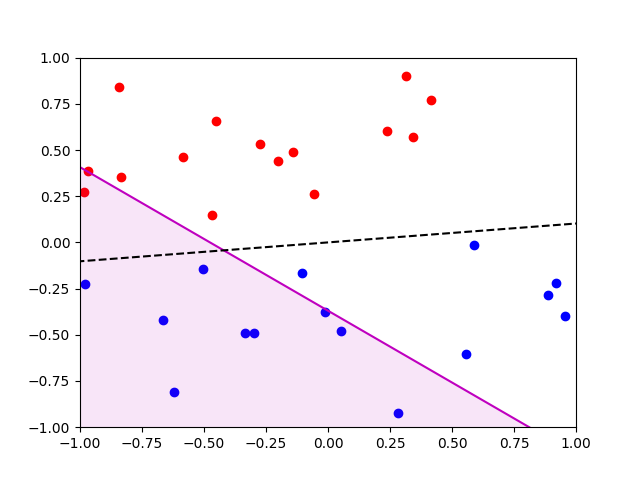
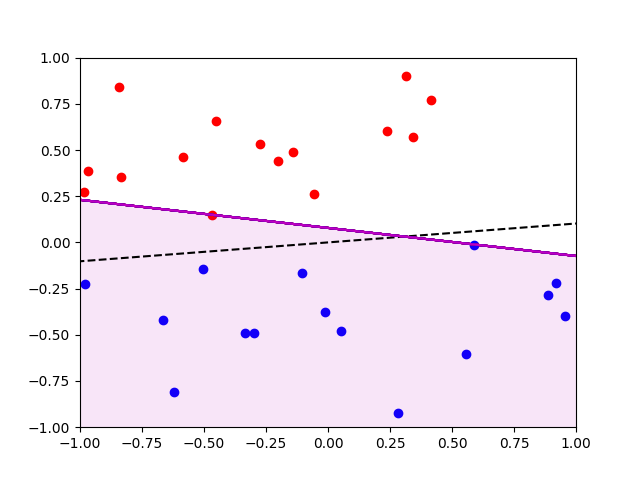
N = 30, C = 0.001, gamma = 0.01, scale = 1
The black dotted line represents our decision boundary line. The magenta line represents the current line formed by our weight vector (from perceptron). Note that our perceptron has not yet converged.
Our perceptron has now converged!
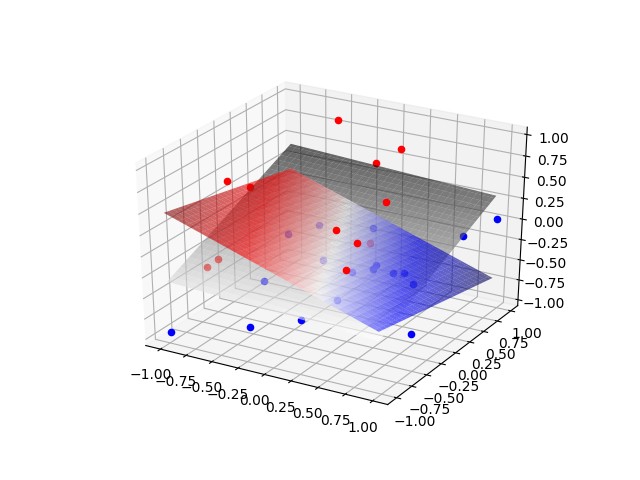
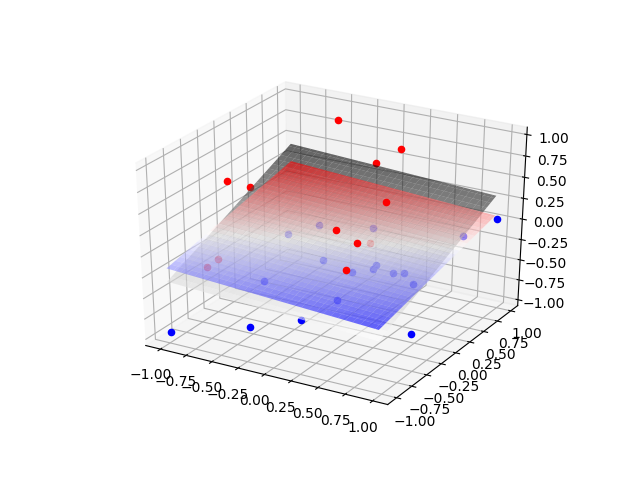
N = 30, C = 0.01, gamma = 0.01, scale = 1
The black plane represents our decision boundary plane. The magenta line represents the current plane formed by our weight vector (from perceptron). Note that our perceptron has not yet converged.
Our perceptron has now converged!
N = 1000, C = 0.001, gamma = 0.001, scale = 1
The black line represents our decision boundary coefficients (solving for highest dimension). The magenta line represents our current boundary coefficients (from perceptron). Note that our perceptron has not yet converged.
Our perceptron has now converged!
