Scientific Visualization – Python & Matplotlib, Nicolas P. Rougier
An open access book on scientific visualization using python and matplotlib to be released during summer 2020 (hopefully). Sources will be available in this repository, the PDF book will be open-access and the printed book will cost 50$.
If you want to support the book, you can:
- Star the project
- Tip a few euros (10 €)
- Access the private repository (25 €) during the writing
(and let me know about your github handle) - Sponsor me through GitHub sponsorship program
Note that in any case, the repository will be made public at the end of the writing and the PDF will be available for free.
In the meantime and if you're impatient, you can read:
- Python & OpenGL for Scientific Visualization
- From Python to Numpy
- 100 Numpy exercices
- Matplotlib cheat sheet
You can read them on them news issue and subscribe to this specific issue to get notified about new posts.
You can follow progress on the project tab
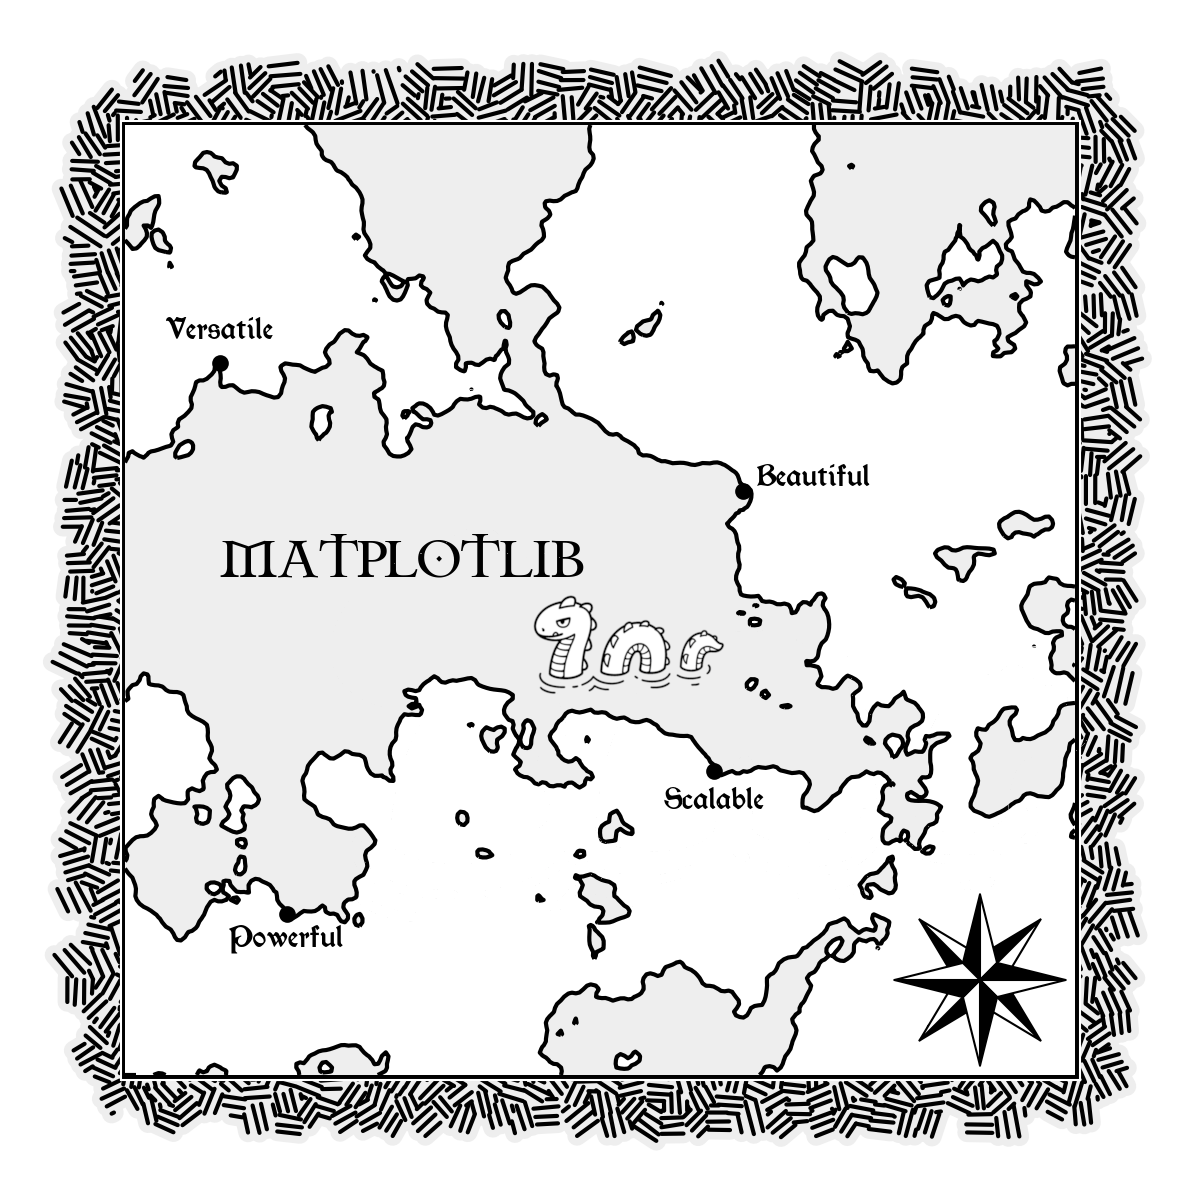
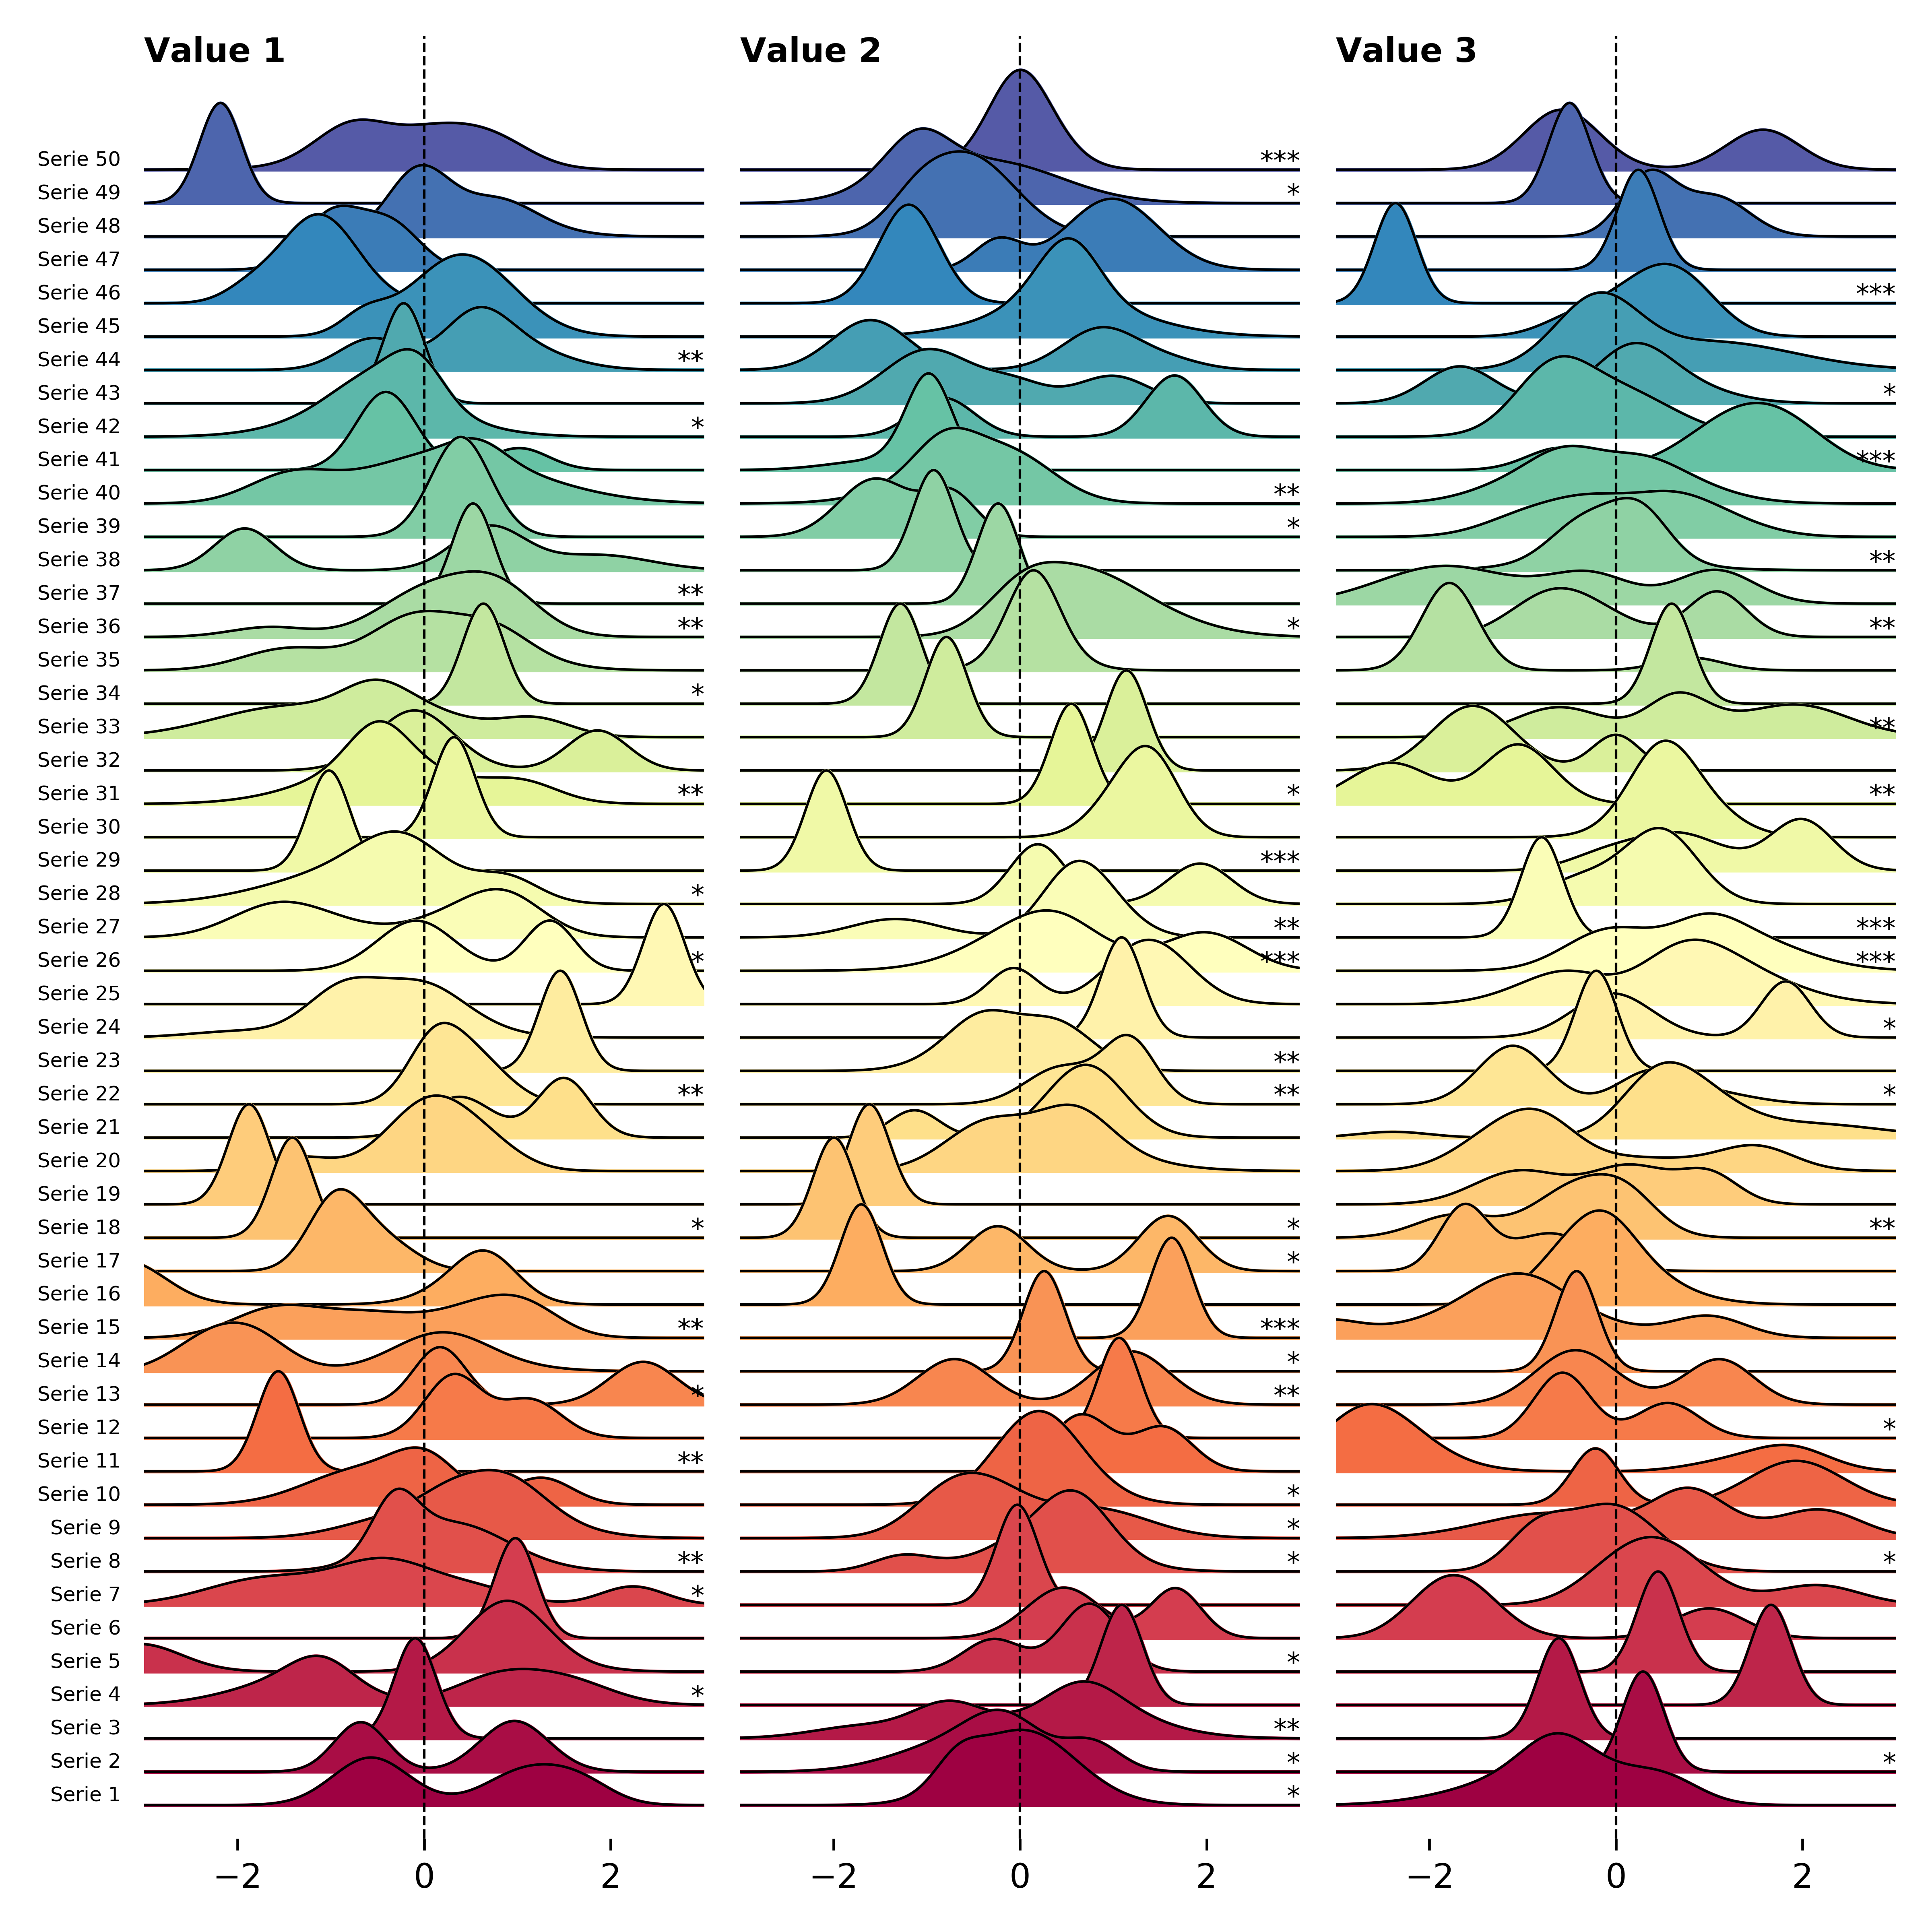
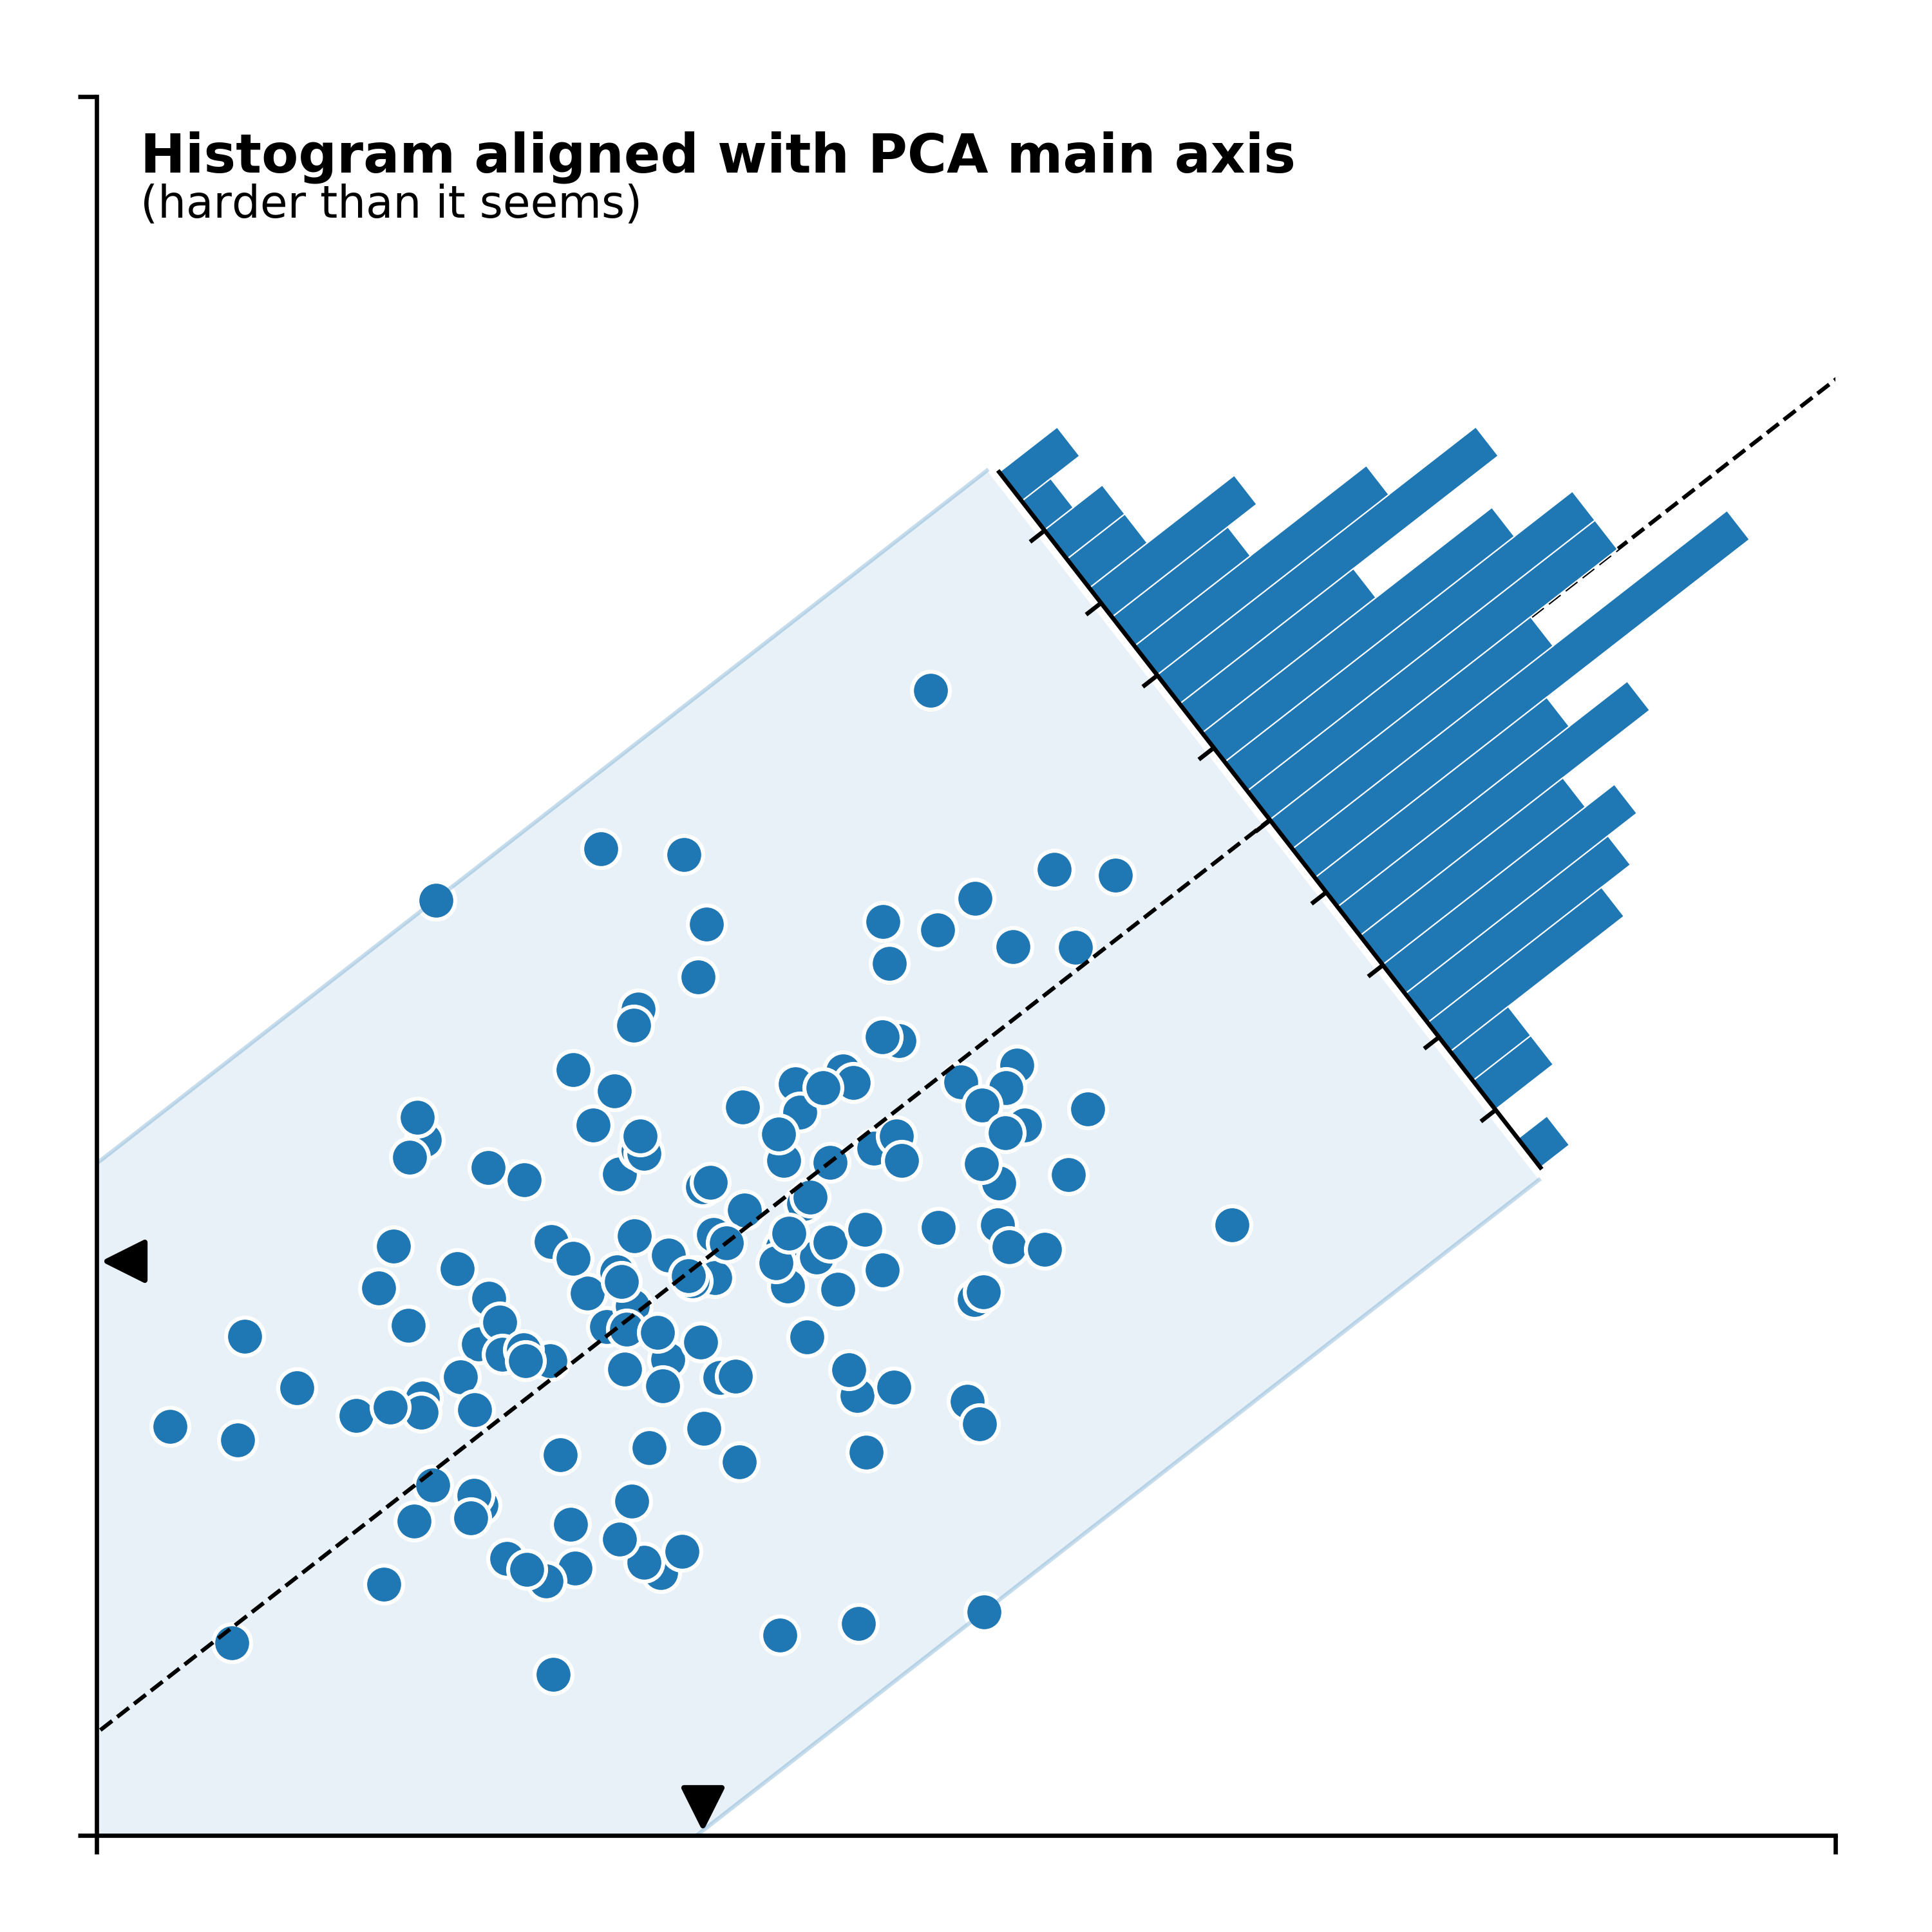
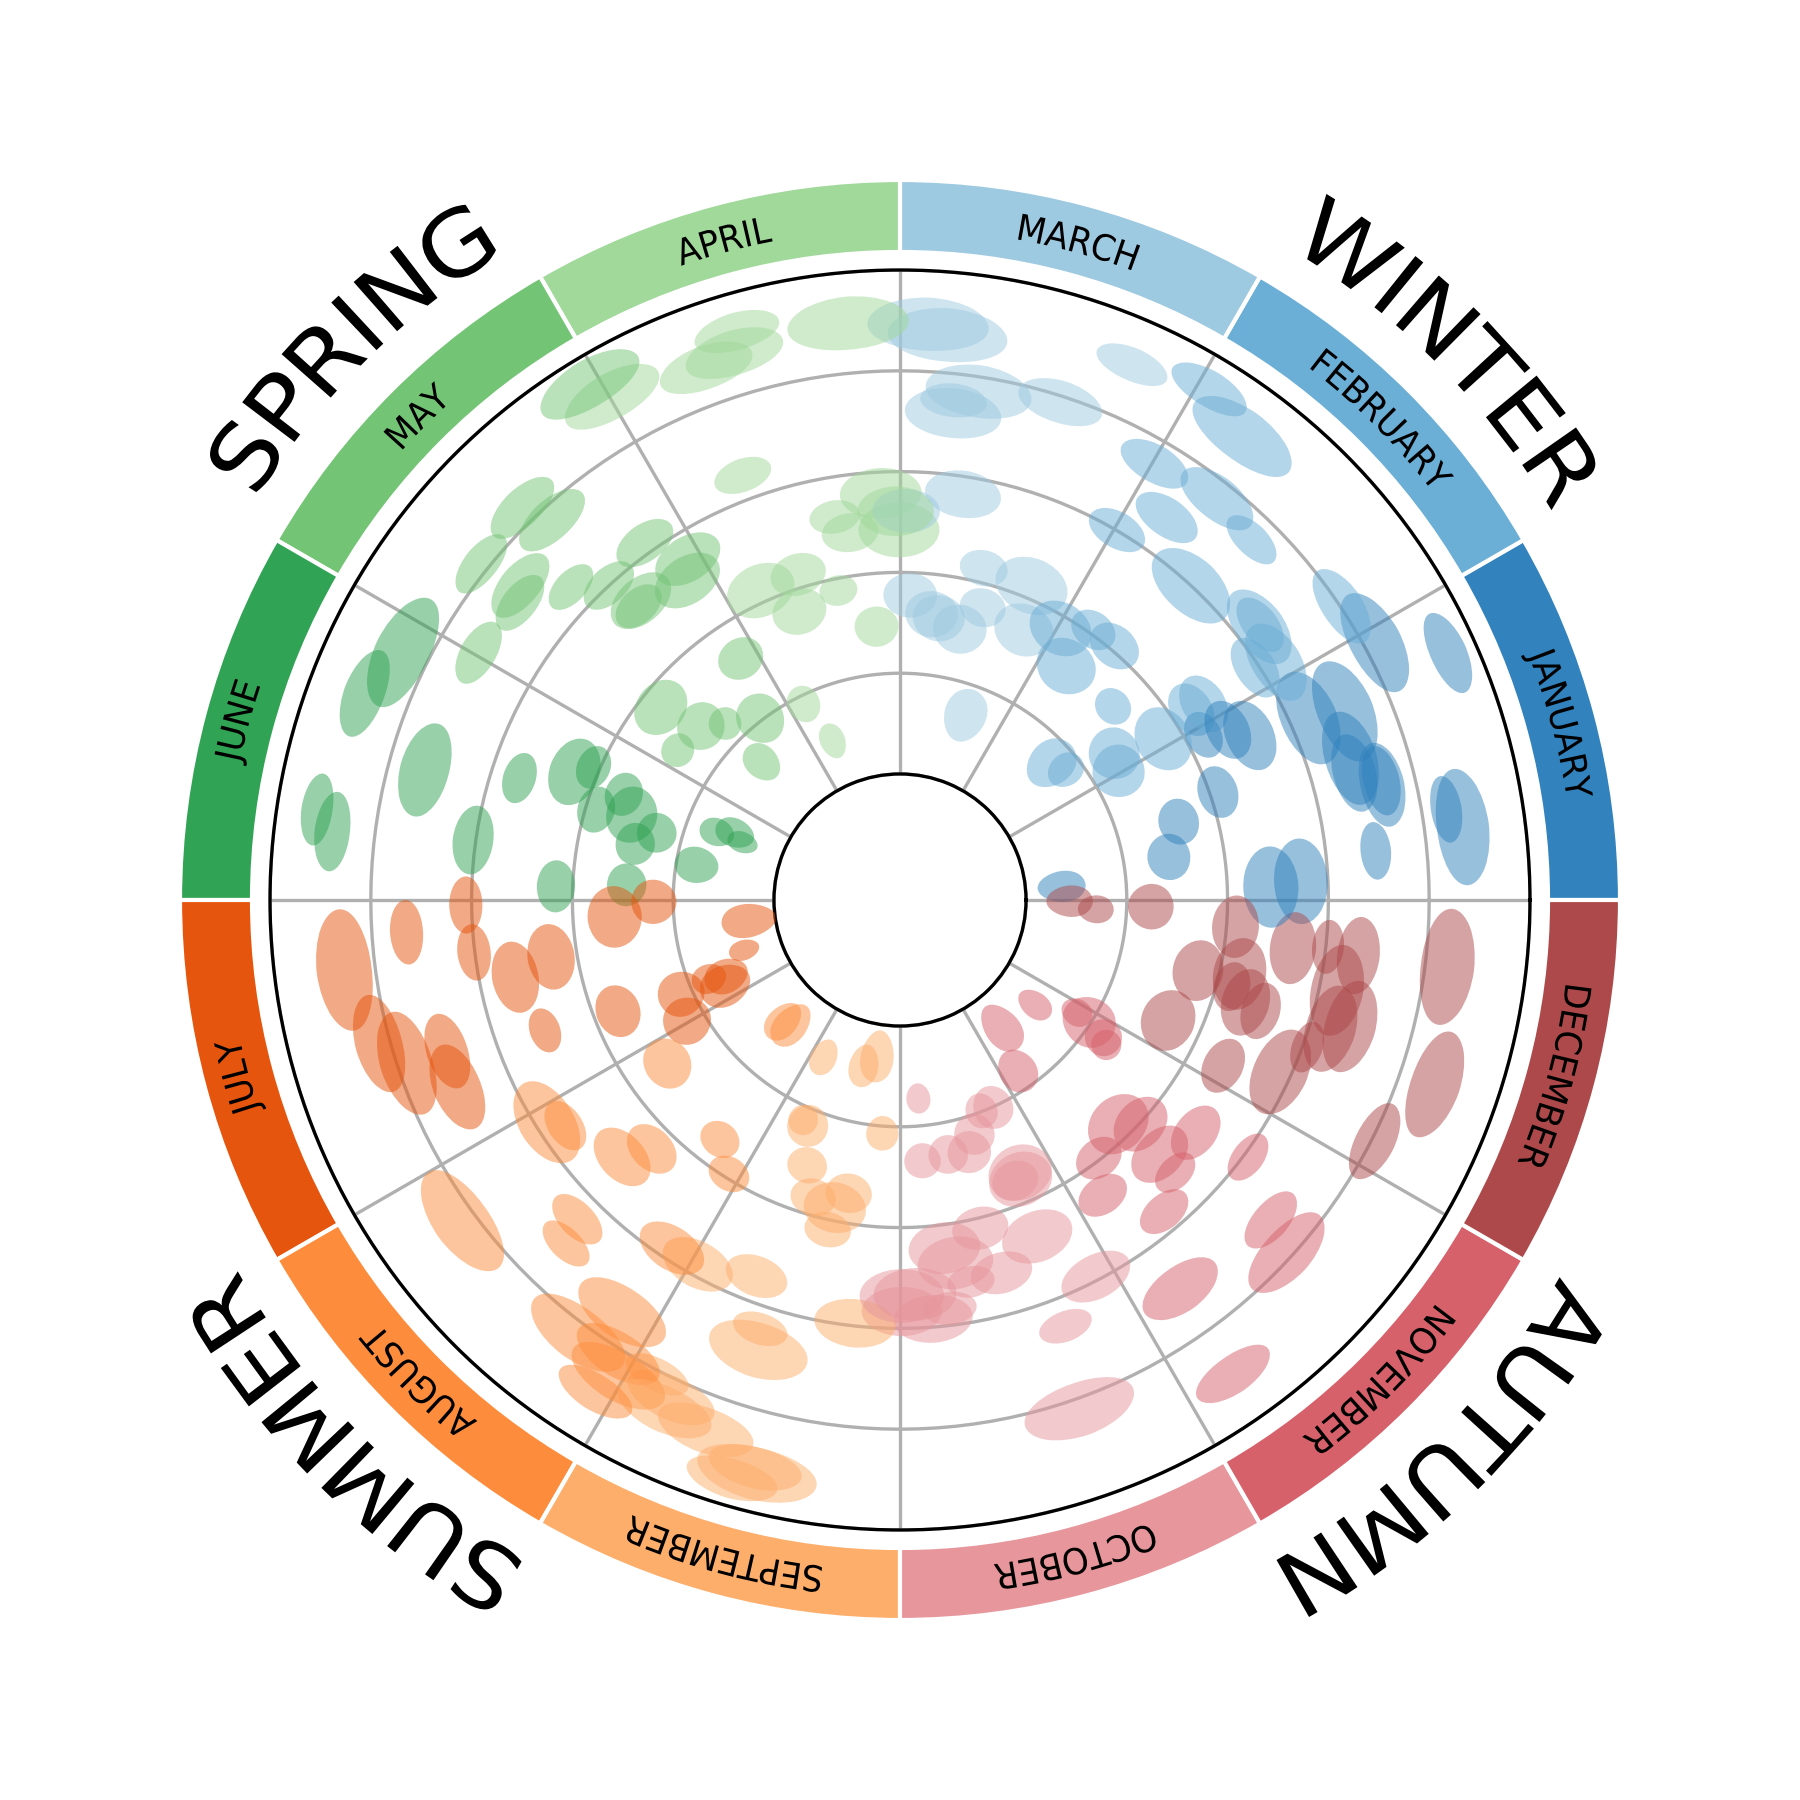
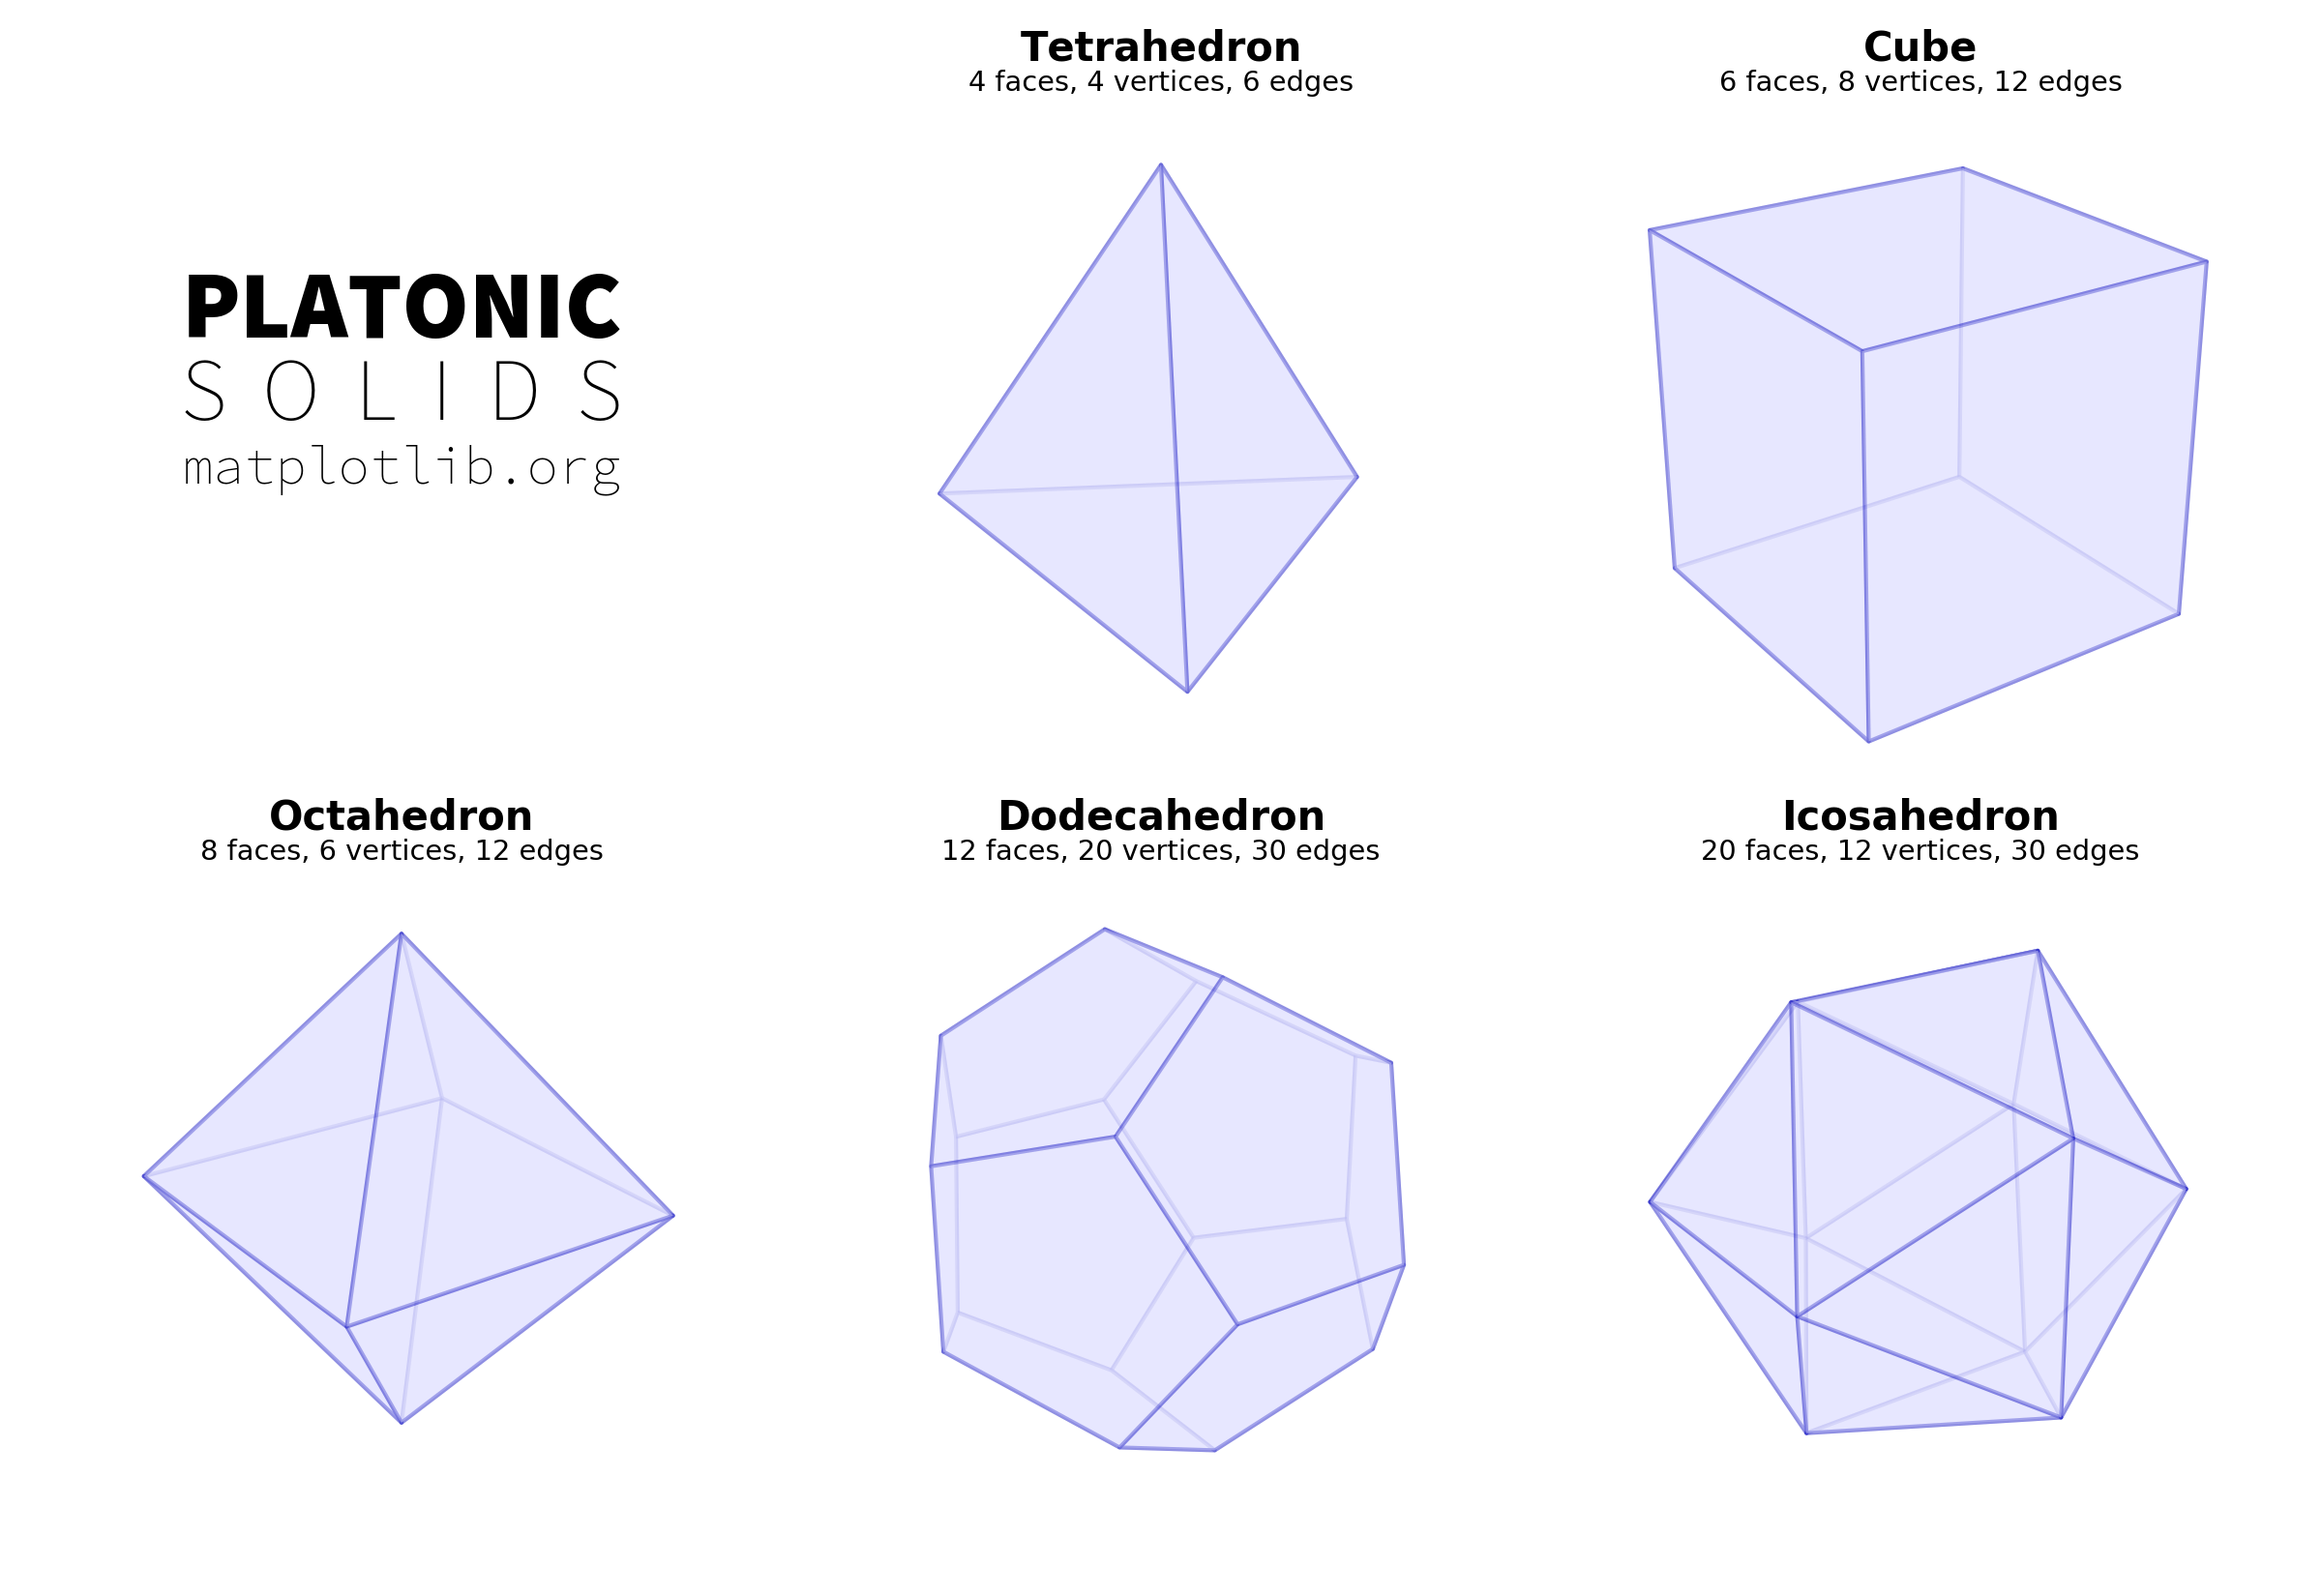
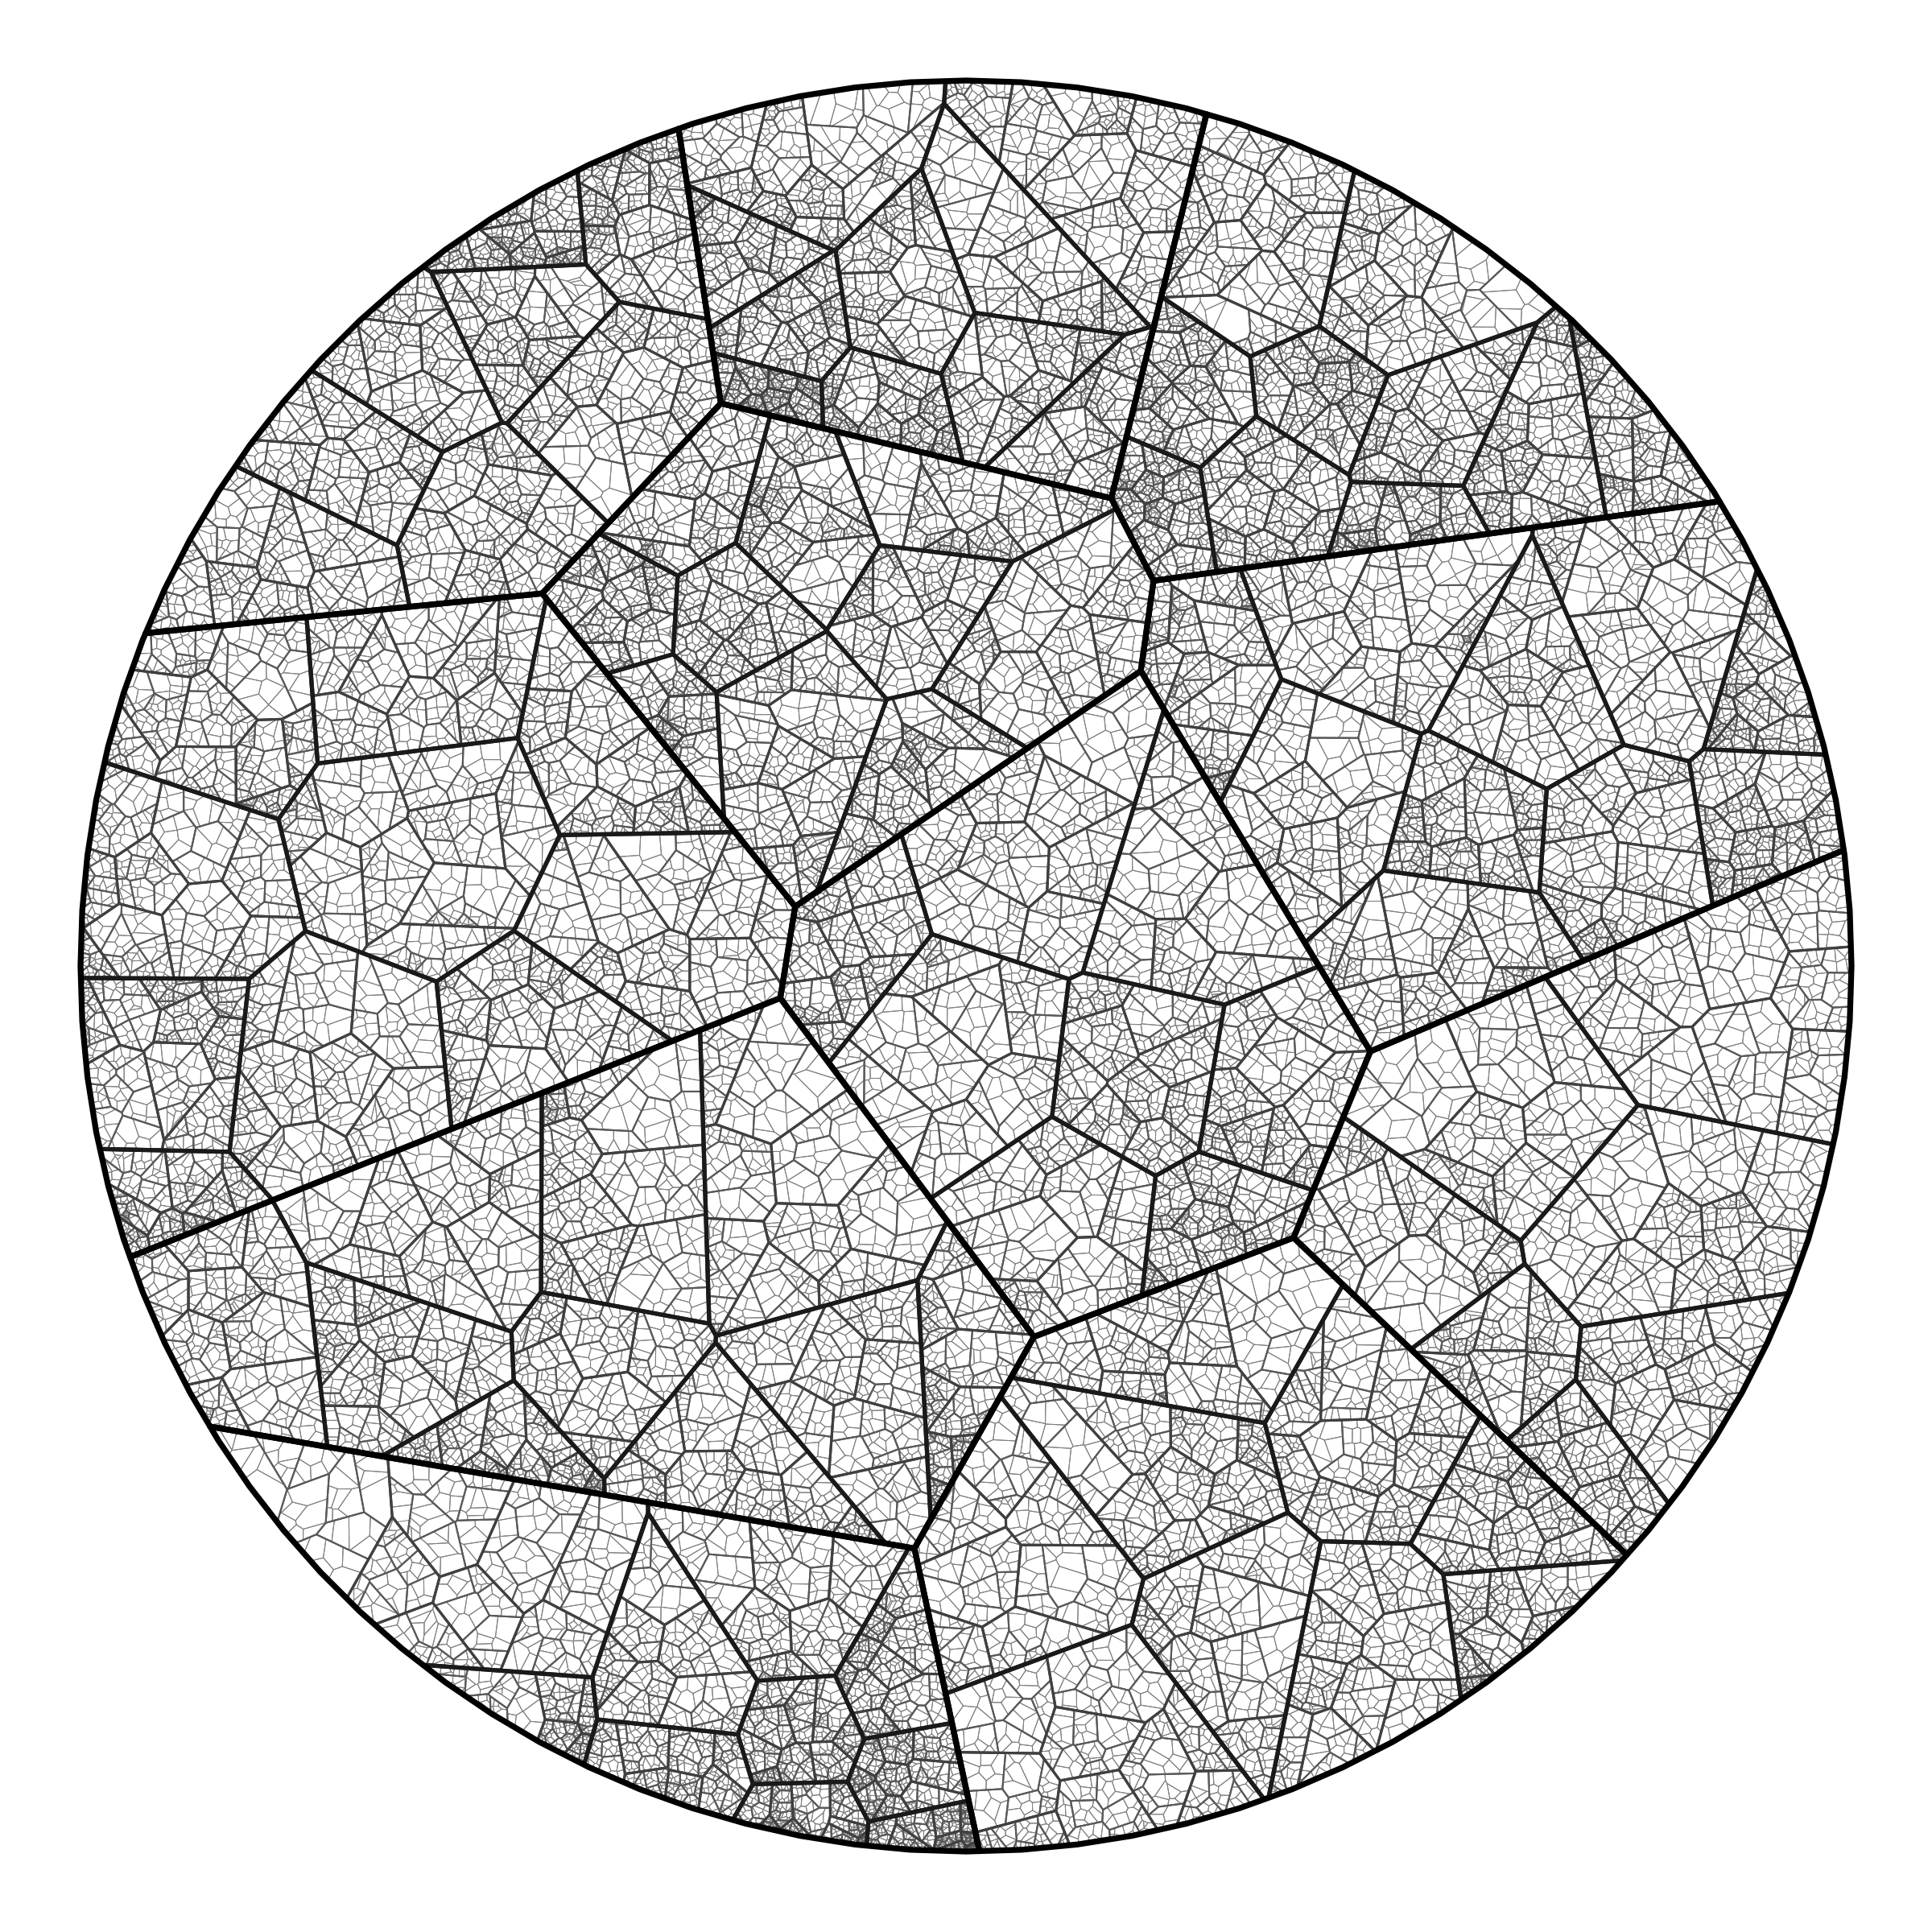
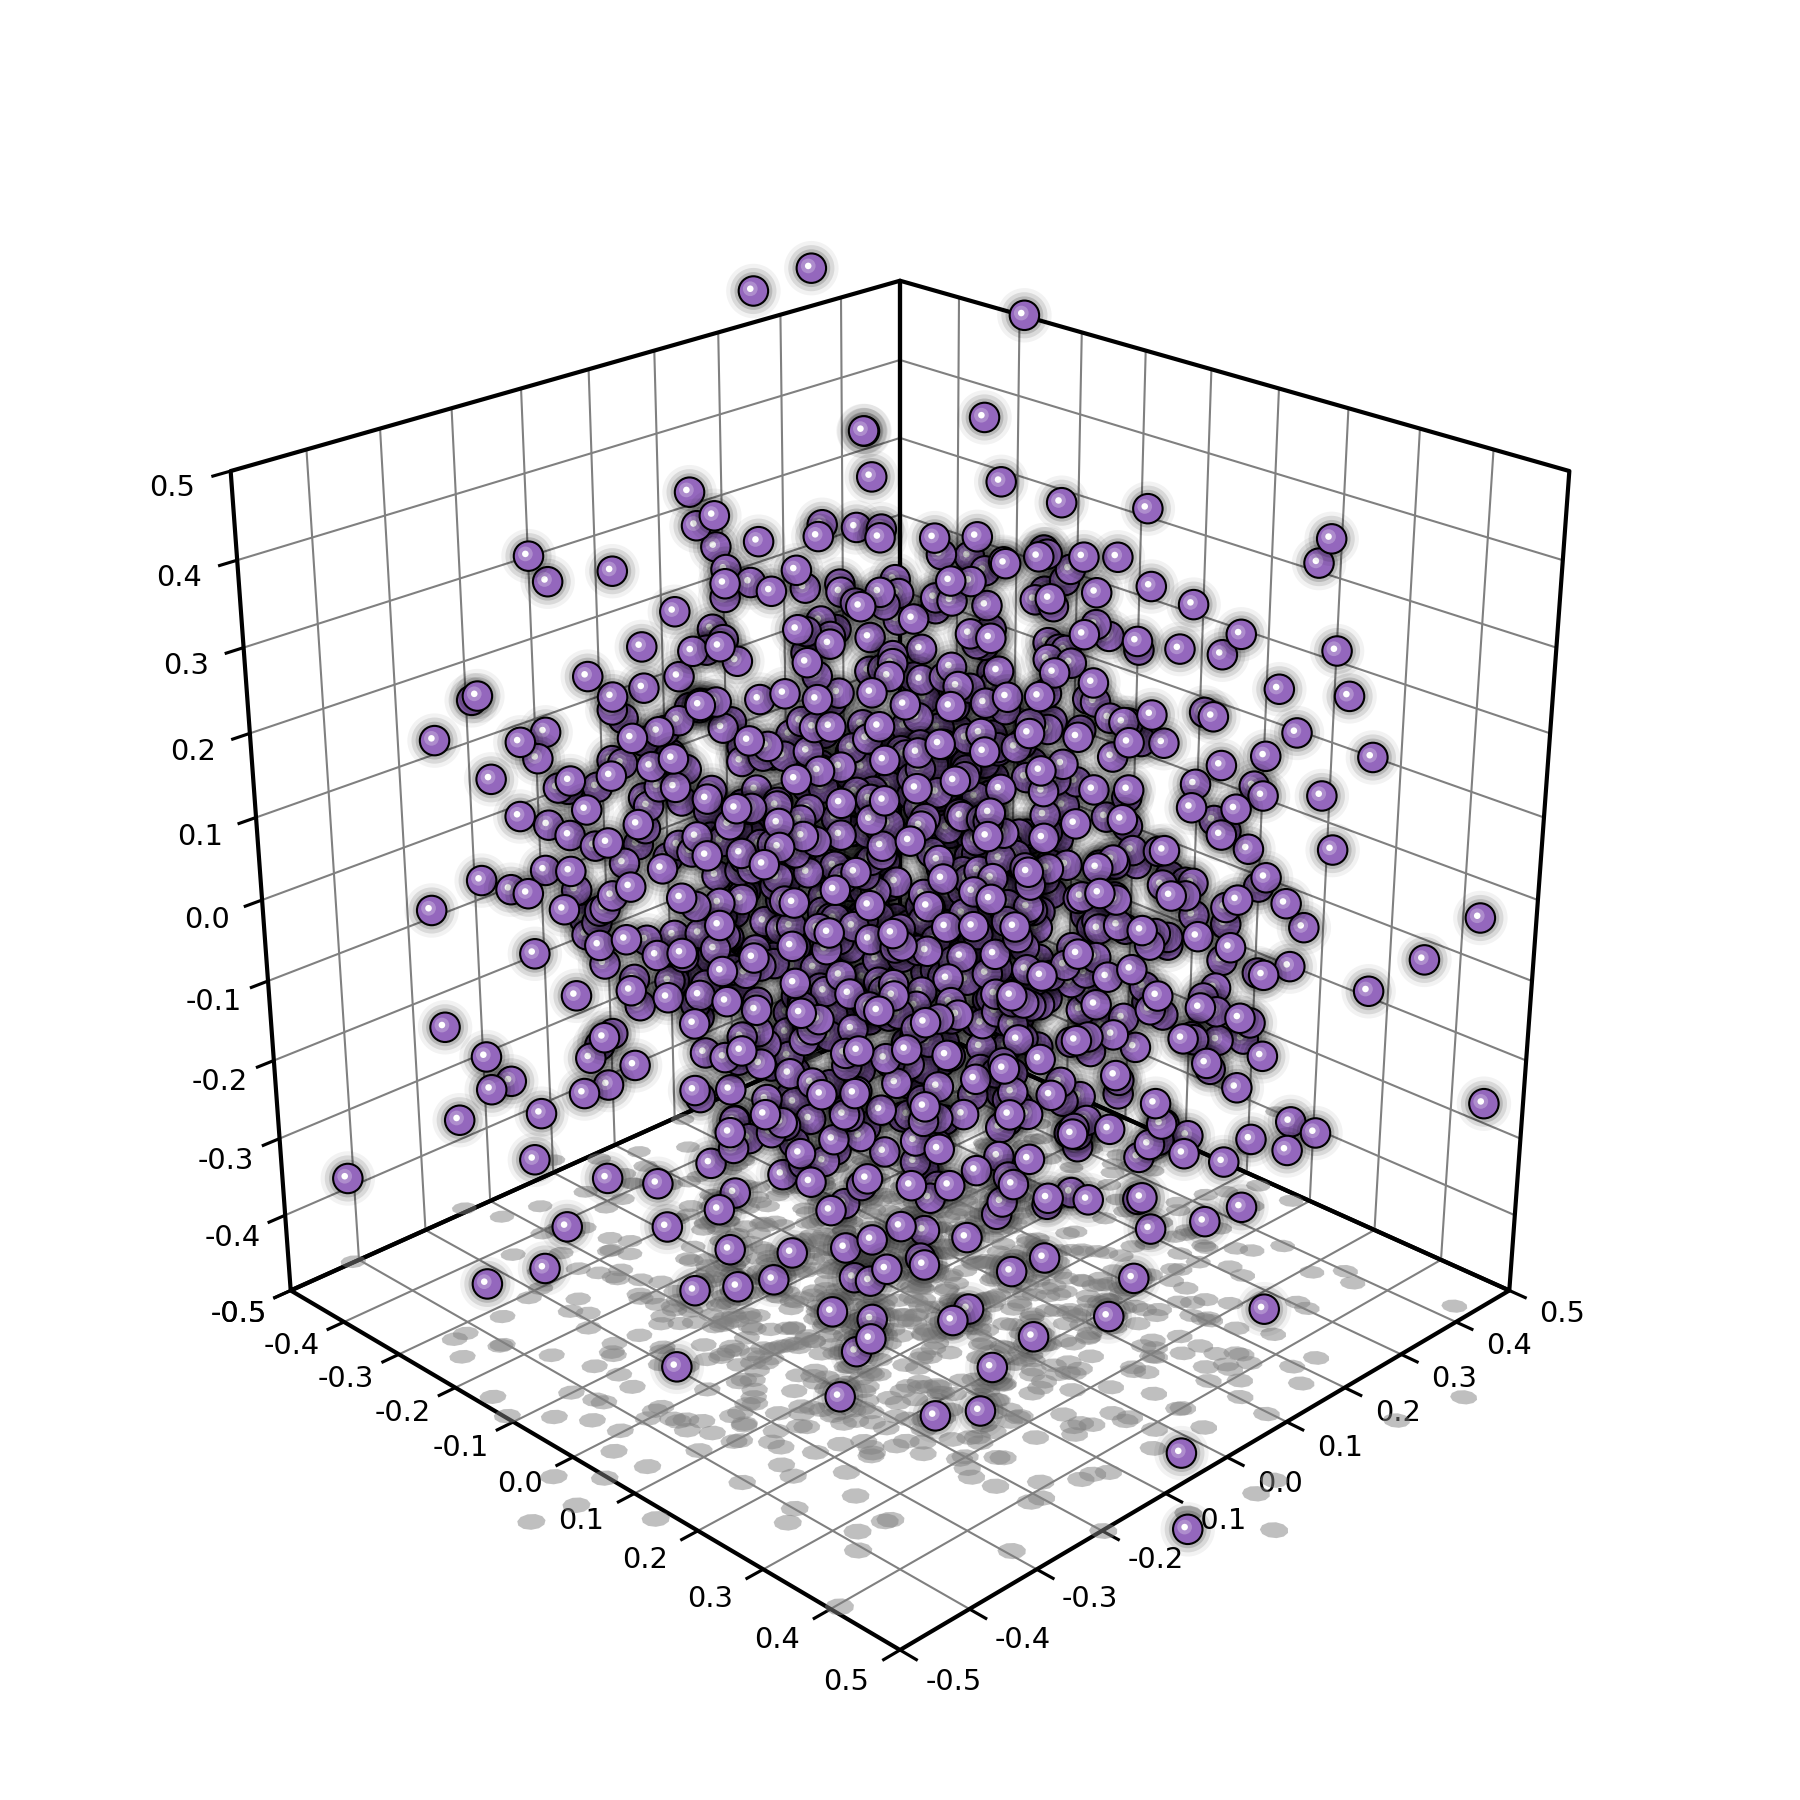
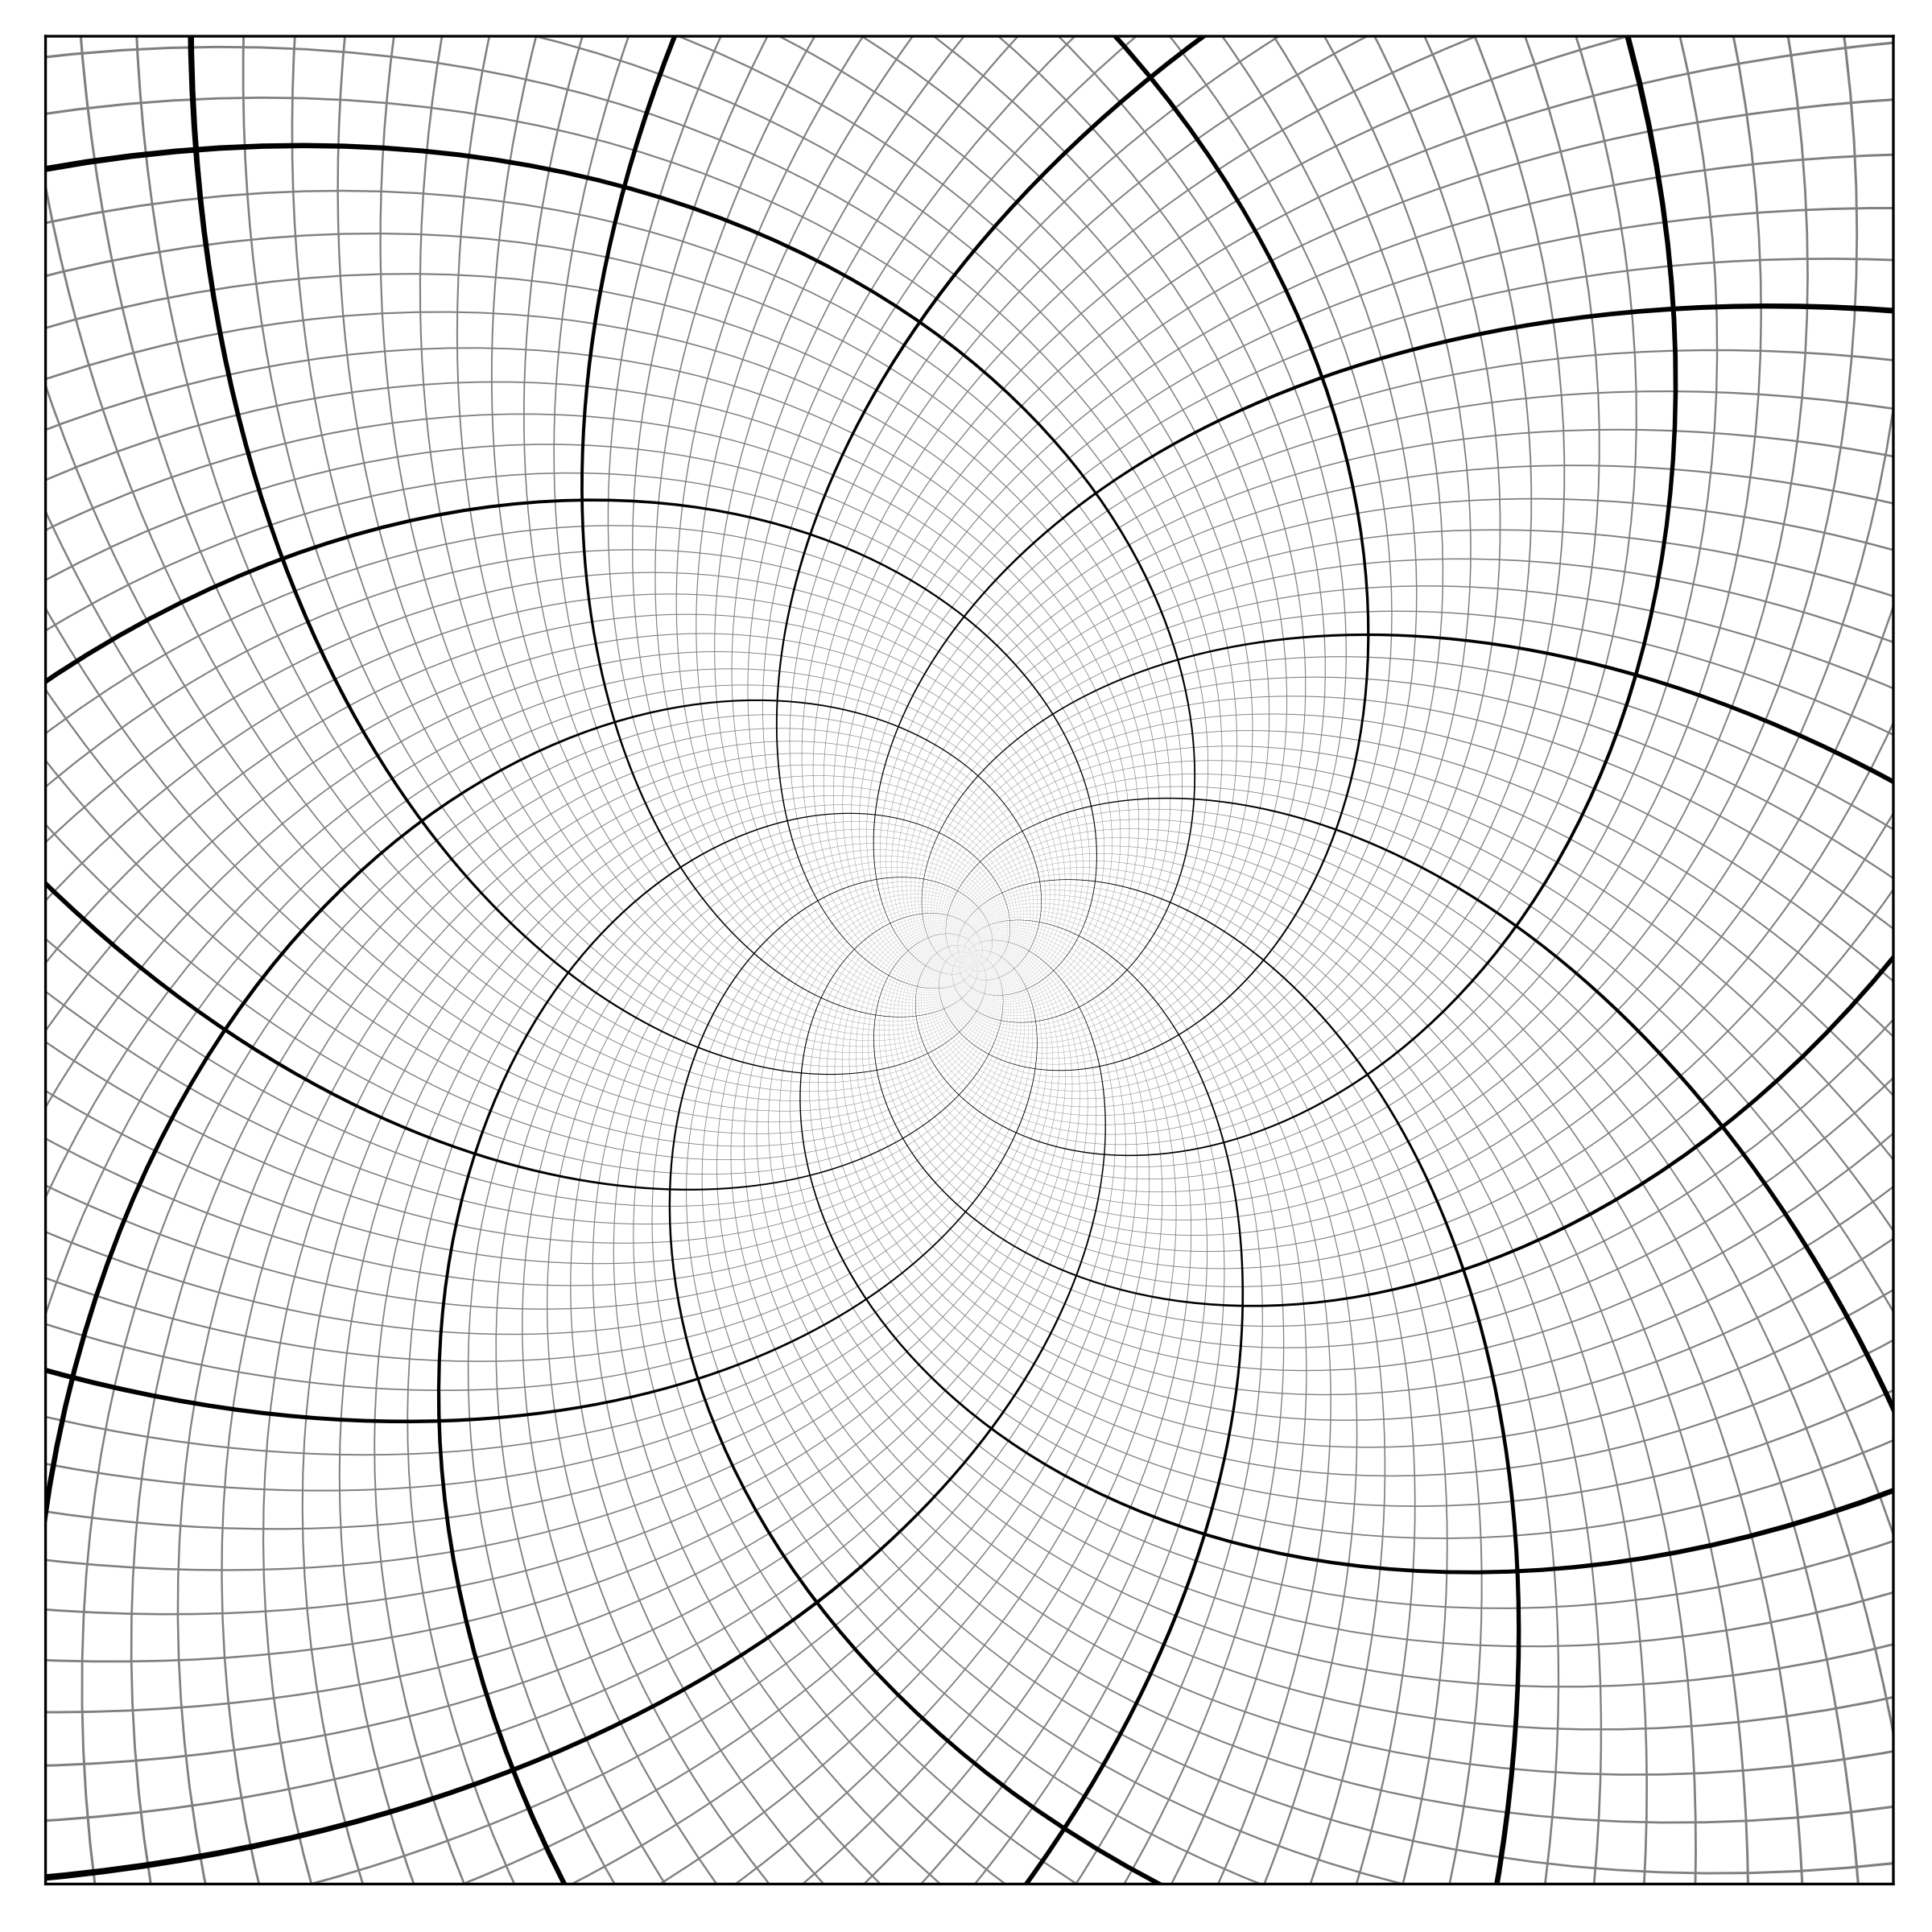
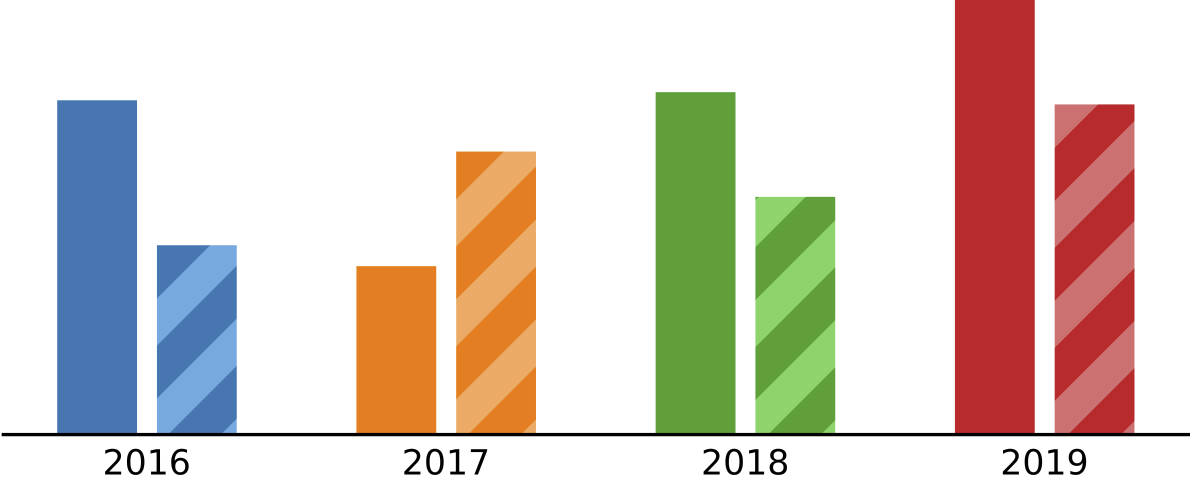
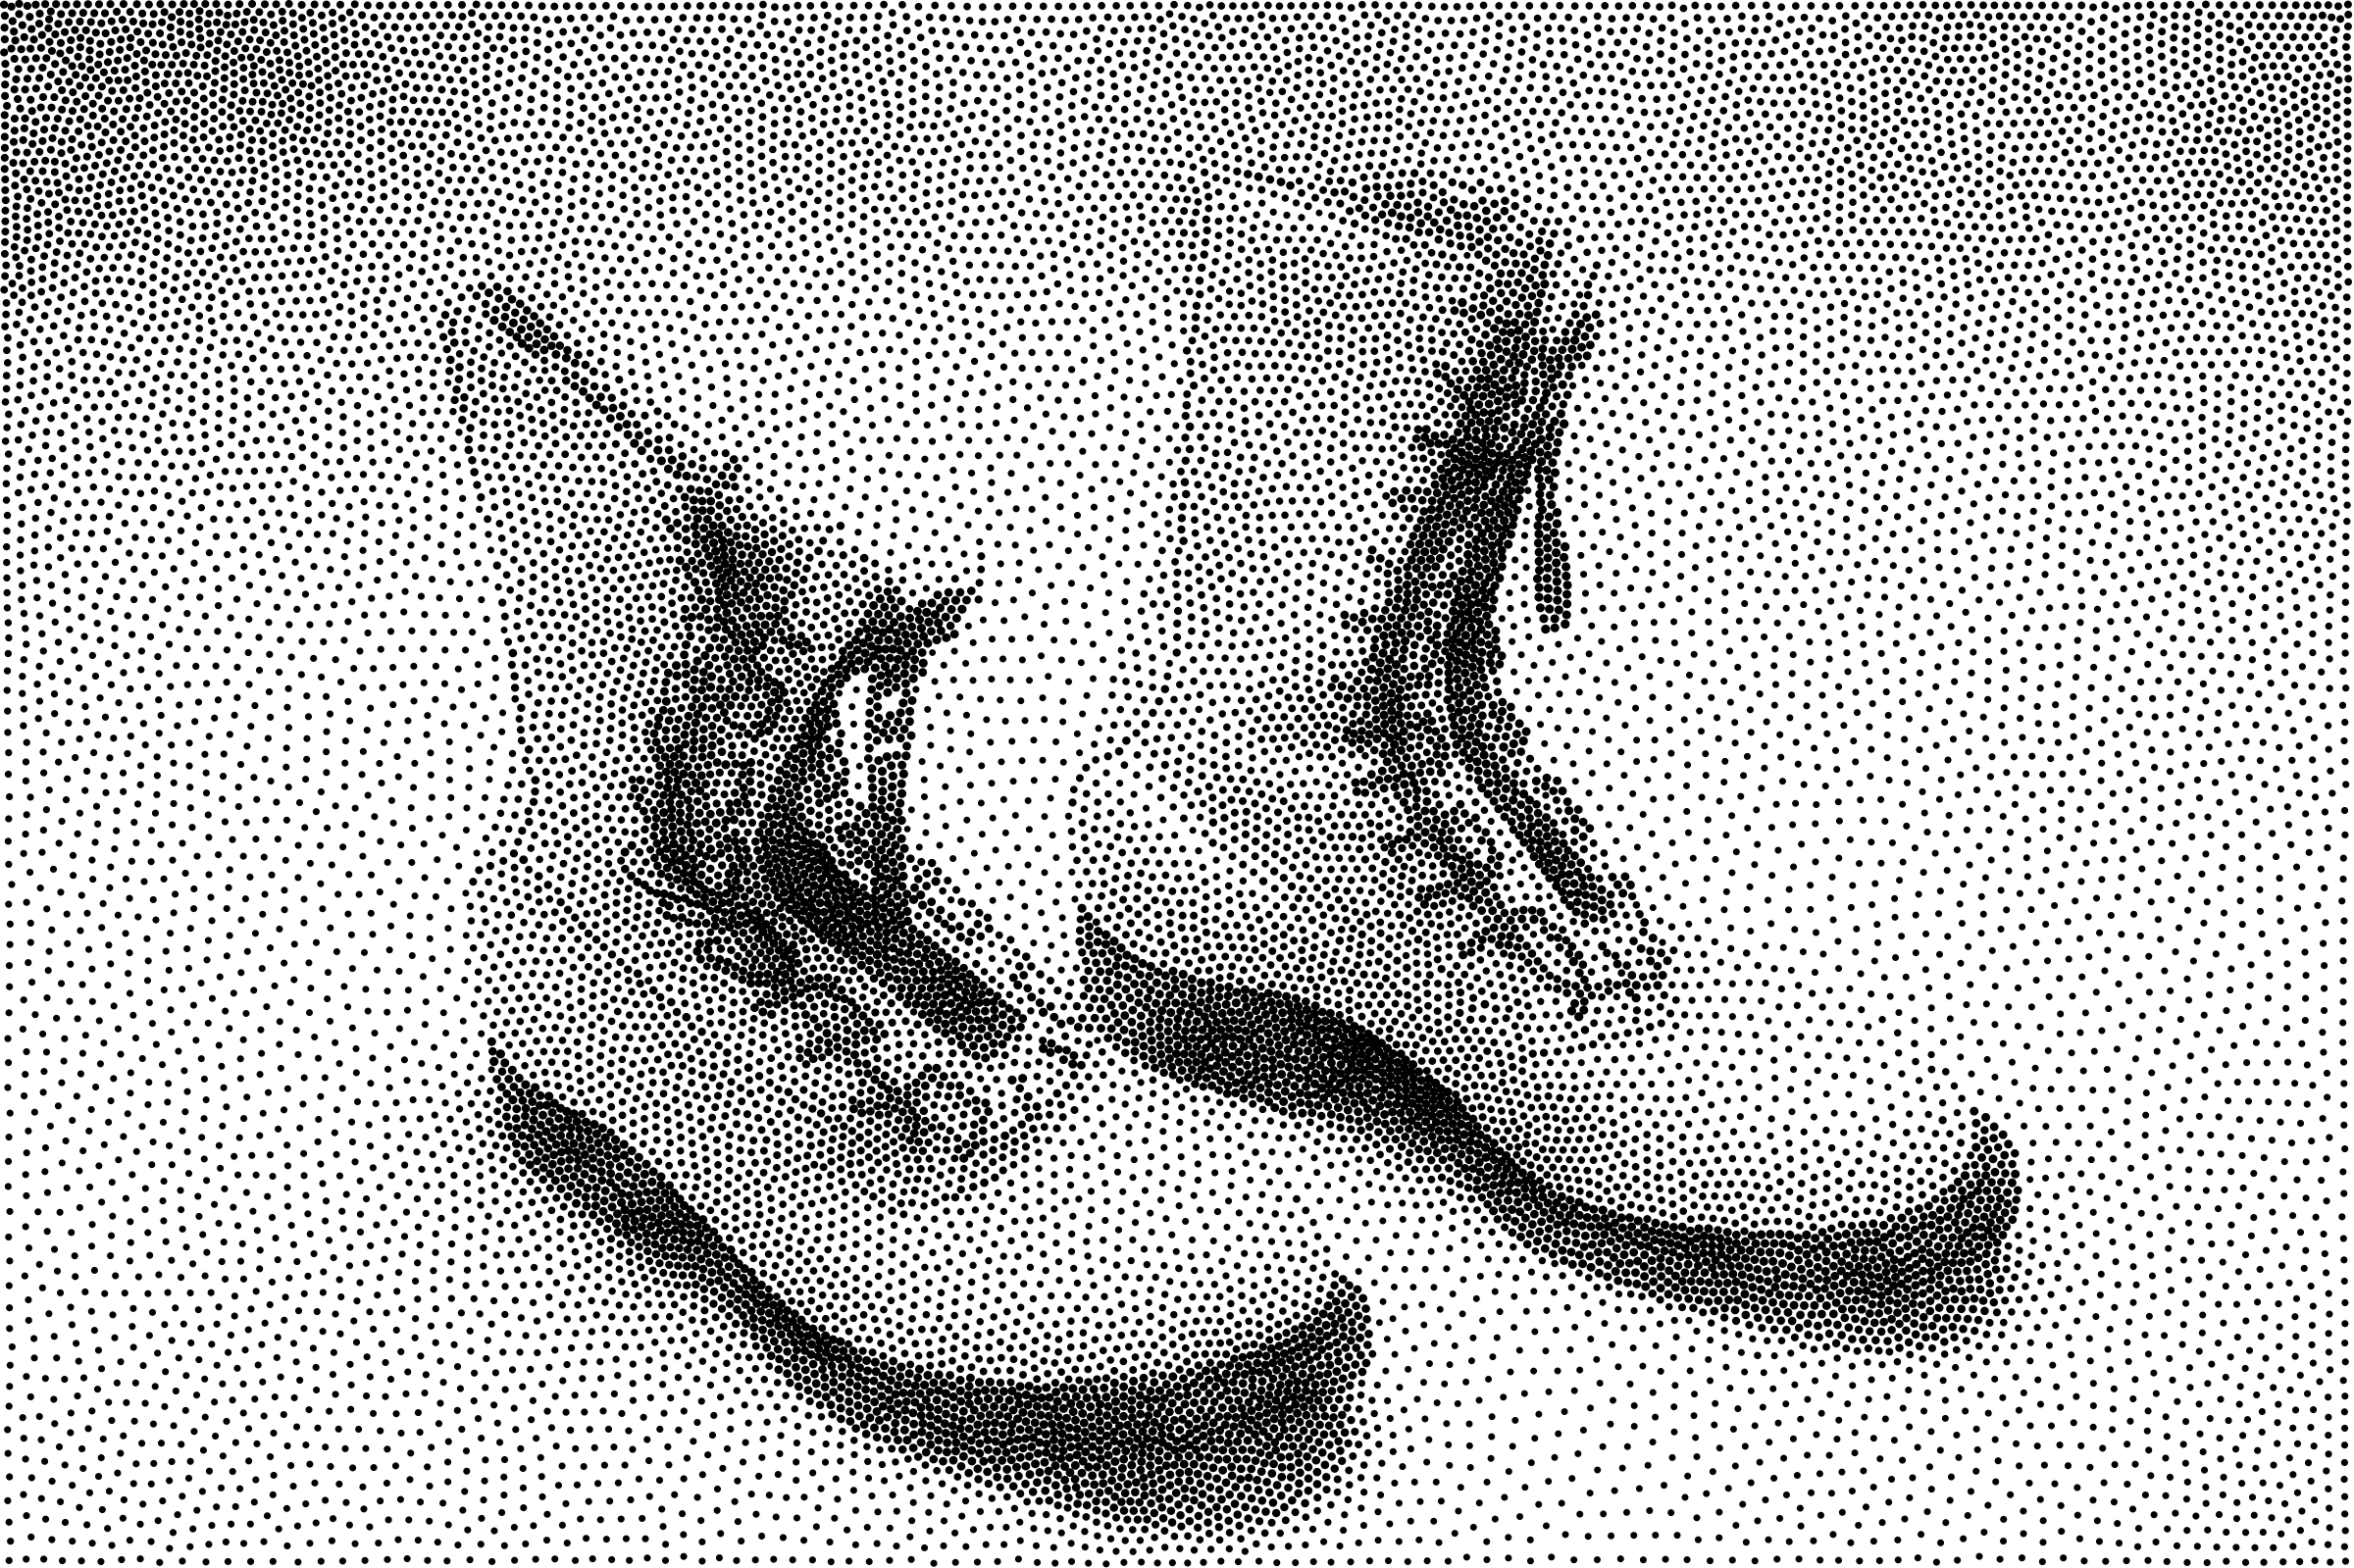
The images below come from the book and have been made using matplotlib, of course.

