Approximating a curve using the Ramer-Douglas-Peucker algorithm, and using DeCasteljau's algorithm to evaluate a Bezier curve
Python
Curve Algorithms
Introduction
Simple programs were made to approximate a curve using the Ramer-Douglas-Peucker algorithm, and to evaluate a Bezier curve using DeCasteljau's algorithm. They were made using Python 3.2.3.
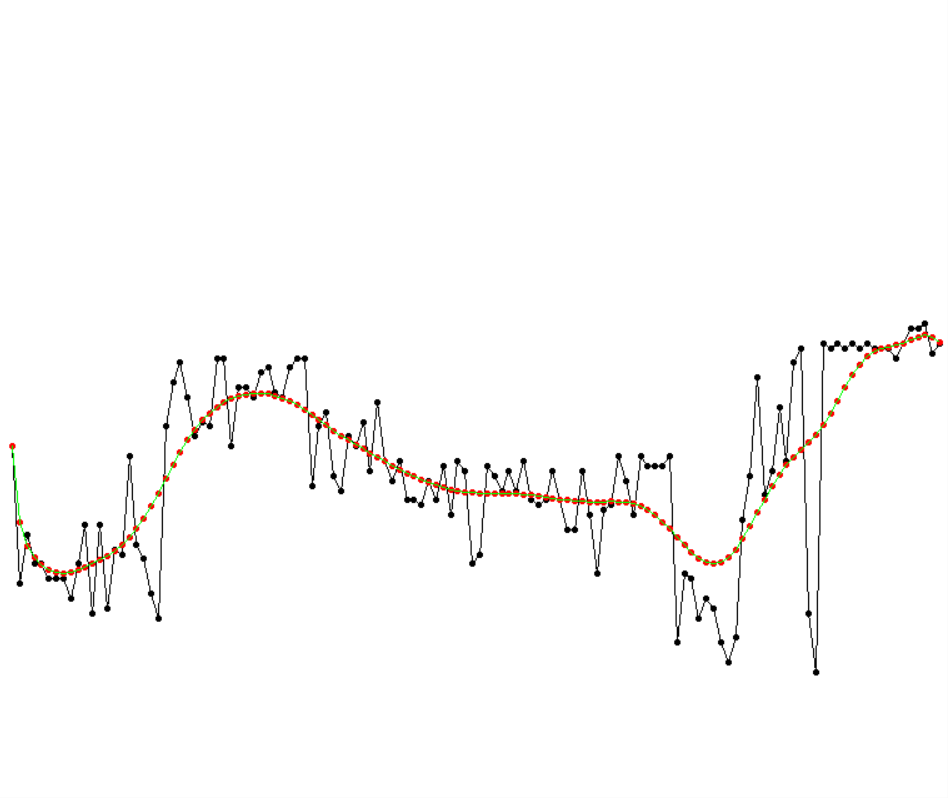
DeCasteljau's Algorithm and Bezier curve (Beziercurve.py)
This program uses DeCasteljau's algorithm to evaluate a Bezier curve. The black points represent the raw data, which is joined by the black curve. The raw data points are then evaluated into the red points through DeCasteljau's algorithm, which is then used to evaluate the green Bezier curve.
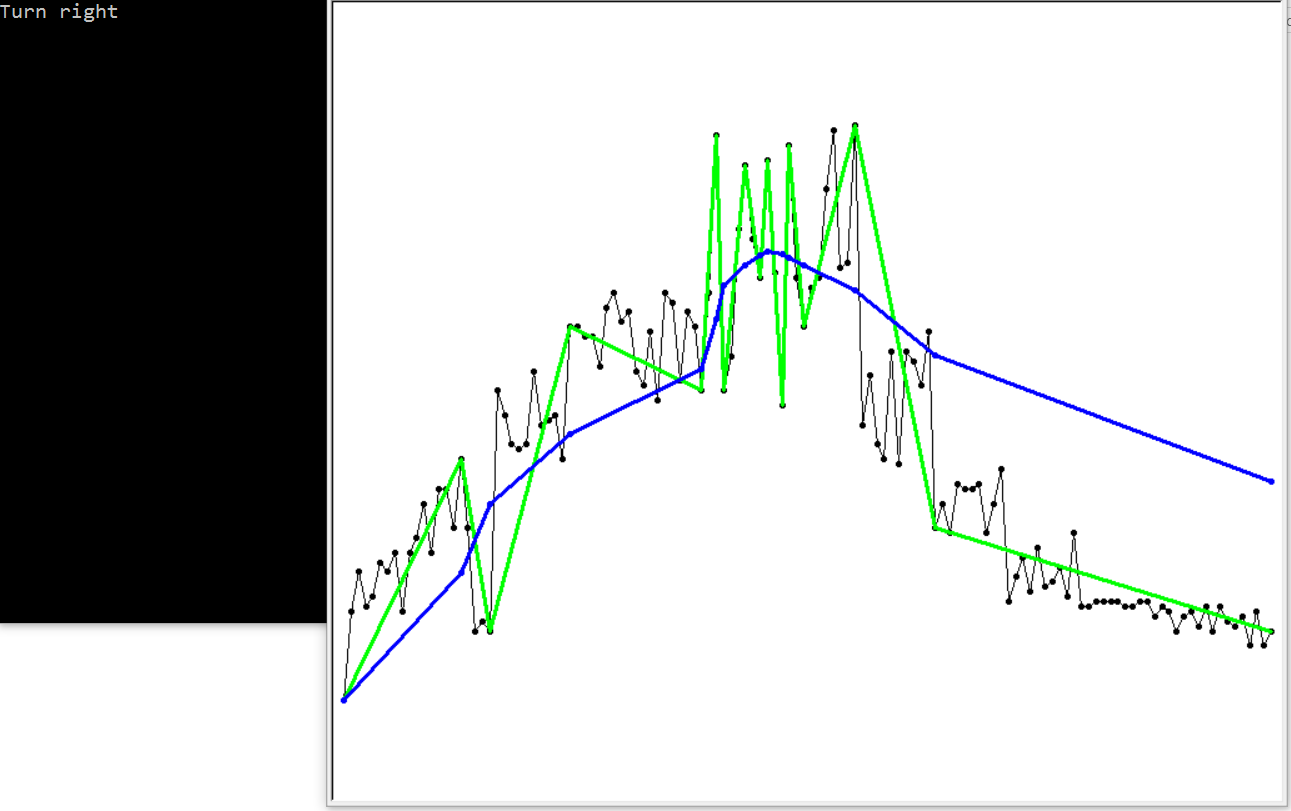
Ramer-Douglas-Peucker Algorithm and Decasteljau's Algorithm (RDP-DCJ.py)
Using http://codereview.stackexchange.com/questions/49809/python-implementation-of-the-ramer-douglas-peucker-algorithm, I modified it to include DeCasteljau's algorithm after approximating a curve, and to draw out the curves using turtle. The black points represent the raw data, which is joined by the black curve. The raw data points are then evaluated into a smoother curve (green) using Ramer-Douglas-Peucker algorithm, and then evaluated into a Bezier curve (blue) using DeCasteljau's algorithm. This was made for the 2015 Internal Robotics Competition to simulate a linear CCD reading and to tell a robot where to go based on the area under the curve formed by the linear CCD reading.