There are 2 services in this repository, clone it and follow the instructions on how to run it below.
Before you run either Workshop/Sub Workshop services it is advised to run docker-compose first.
Open a shell, change directory to
mortar-demo/dockernow run the following
docker-compose upThis should bring up the following services
-
Workshop
Open a shell, change your directory to
mortar-demo/workshopand run the followingmake run
-
Sub Workshop
Open a shell, change your directory to
mortar-demo/subworkshopand run the followingmake run
Now you should have Workshop and Sub Workshop services running. It's time to execute different HTTP calls.
HTTP Calls to Workshop service http://localhost:5381/v1/workshop
-
Register a new car
curl -X "POST" "http://localhost:5381/v1/workshop/cars" \
  -H 'Content-Type: application/json; charset=utf-8' \
  -d $'{
"number": "ABCD4248",
"owner": "Mr. Smith",
"body_style": "SEDAN",
"color": "red"
}'
-
Paint
ABCD4248Carcurl -X "PUT" "http://localhost:5381/v1/workshop/cars/ABCD4248/paint" \ -H 'Content-Type: application/json; charset=utf-8' \ -d $'{ "desired_color": "green" }'
-
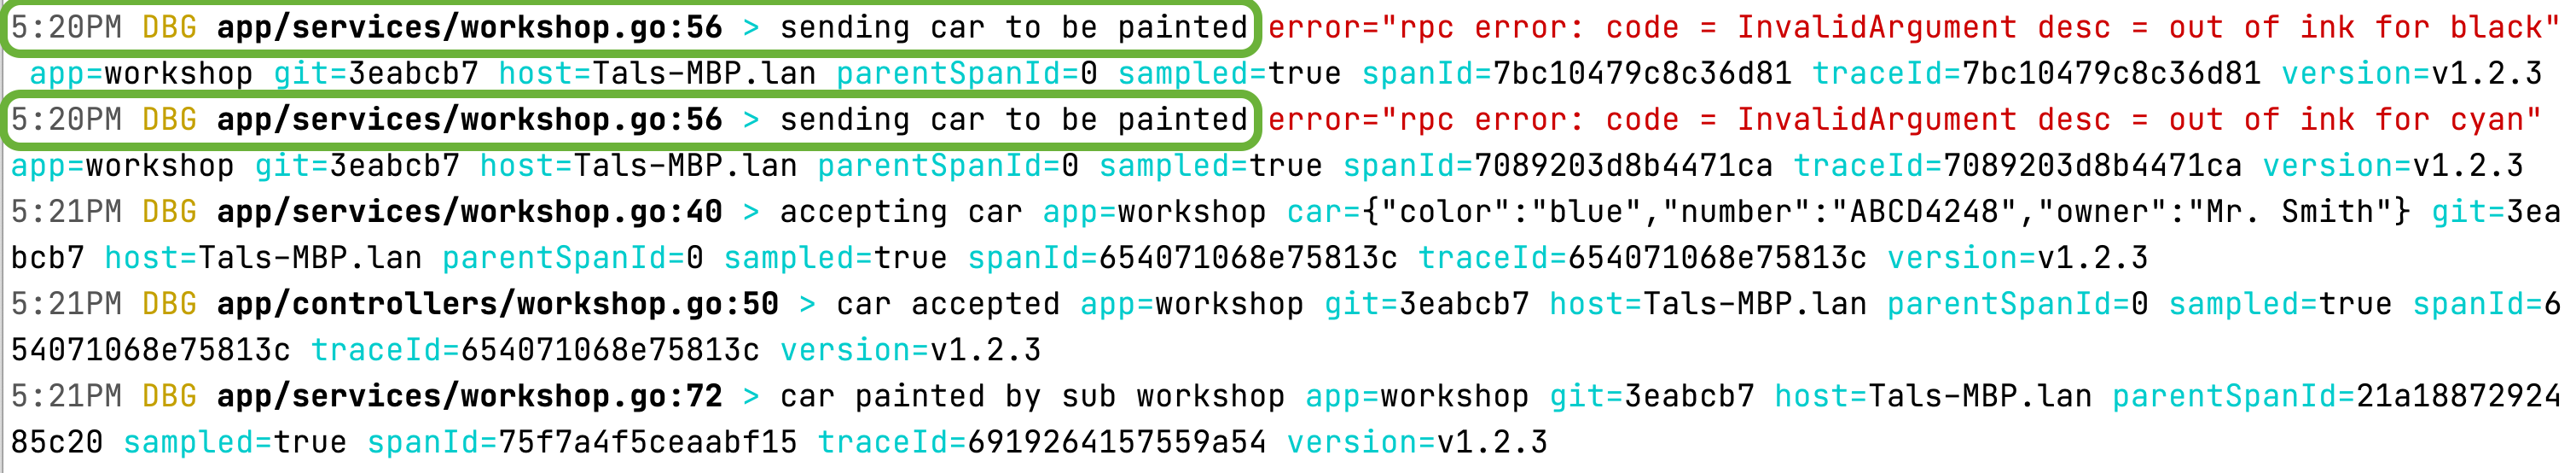
You can see the logs of each service [Workshop/Sub Workshop] in their respective shells.
A lot of implicit information injected to the log entry [
error,git-hash,trace-info,app,host]w.deps.Logger.WithError(err).Debug(ctx, "sending car to be painted") // Line 56
-
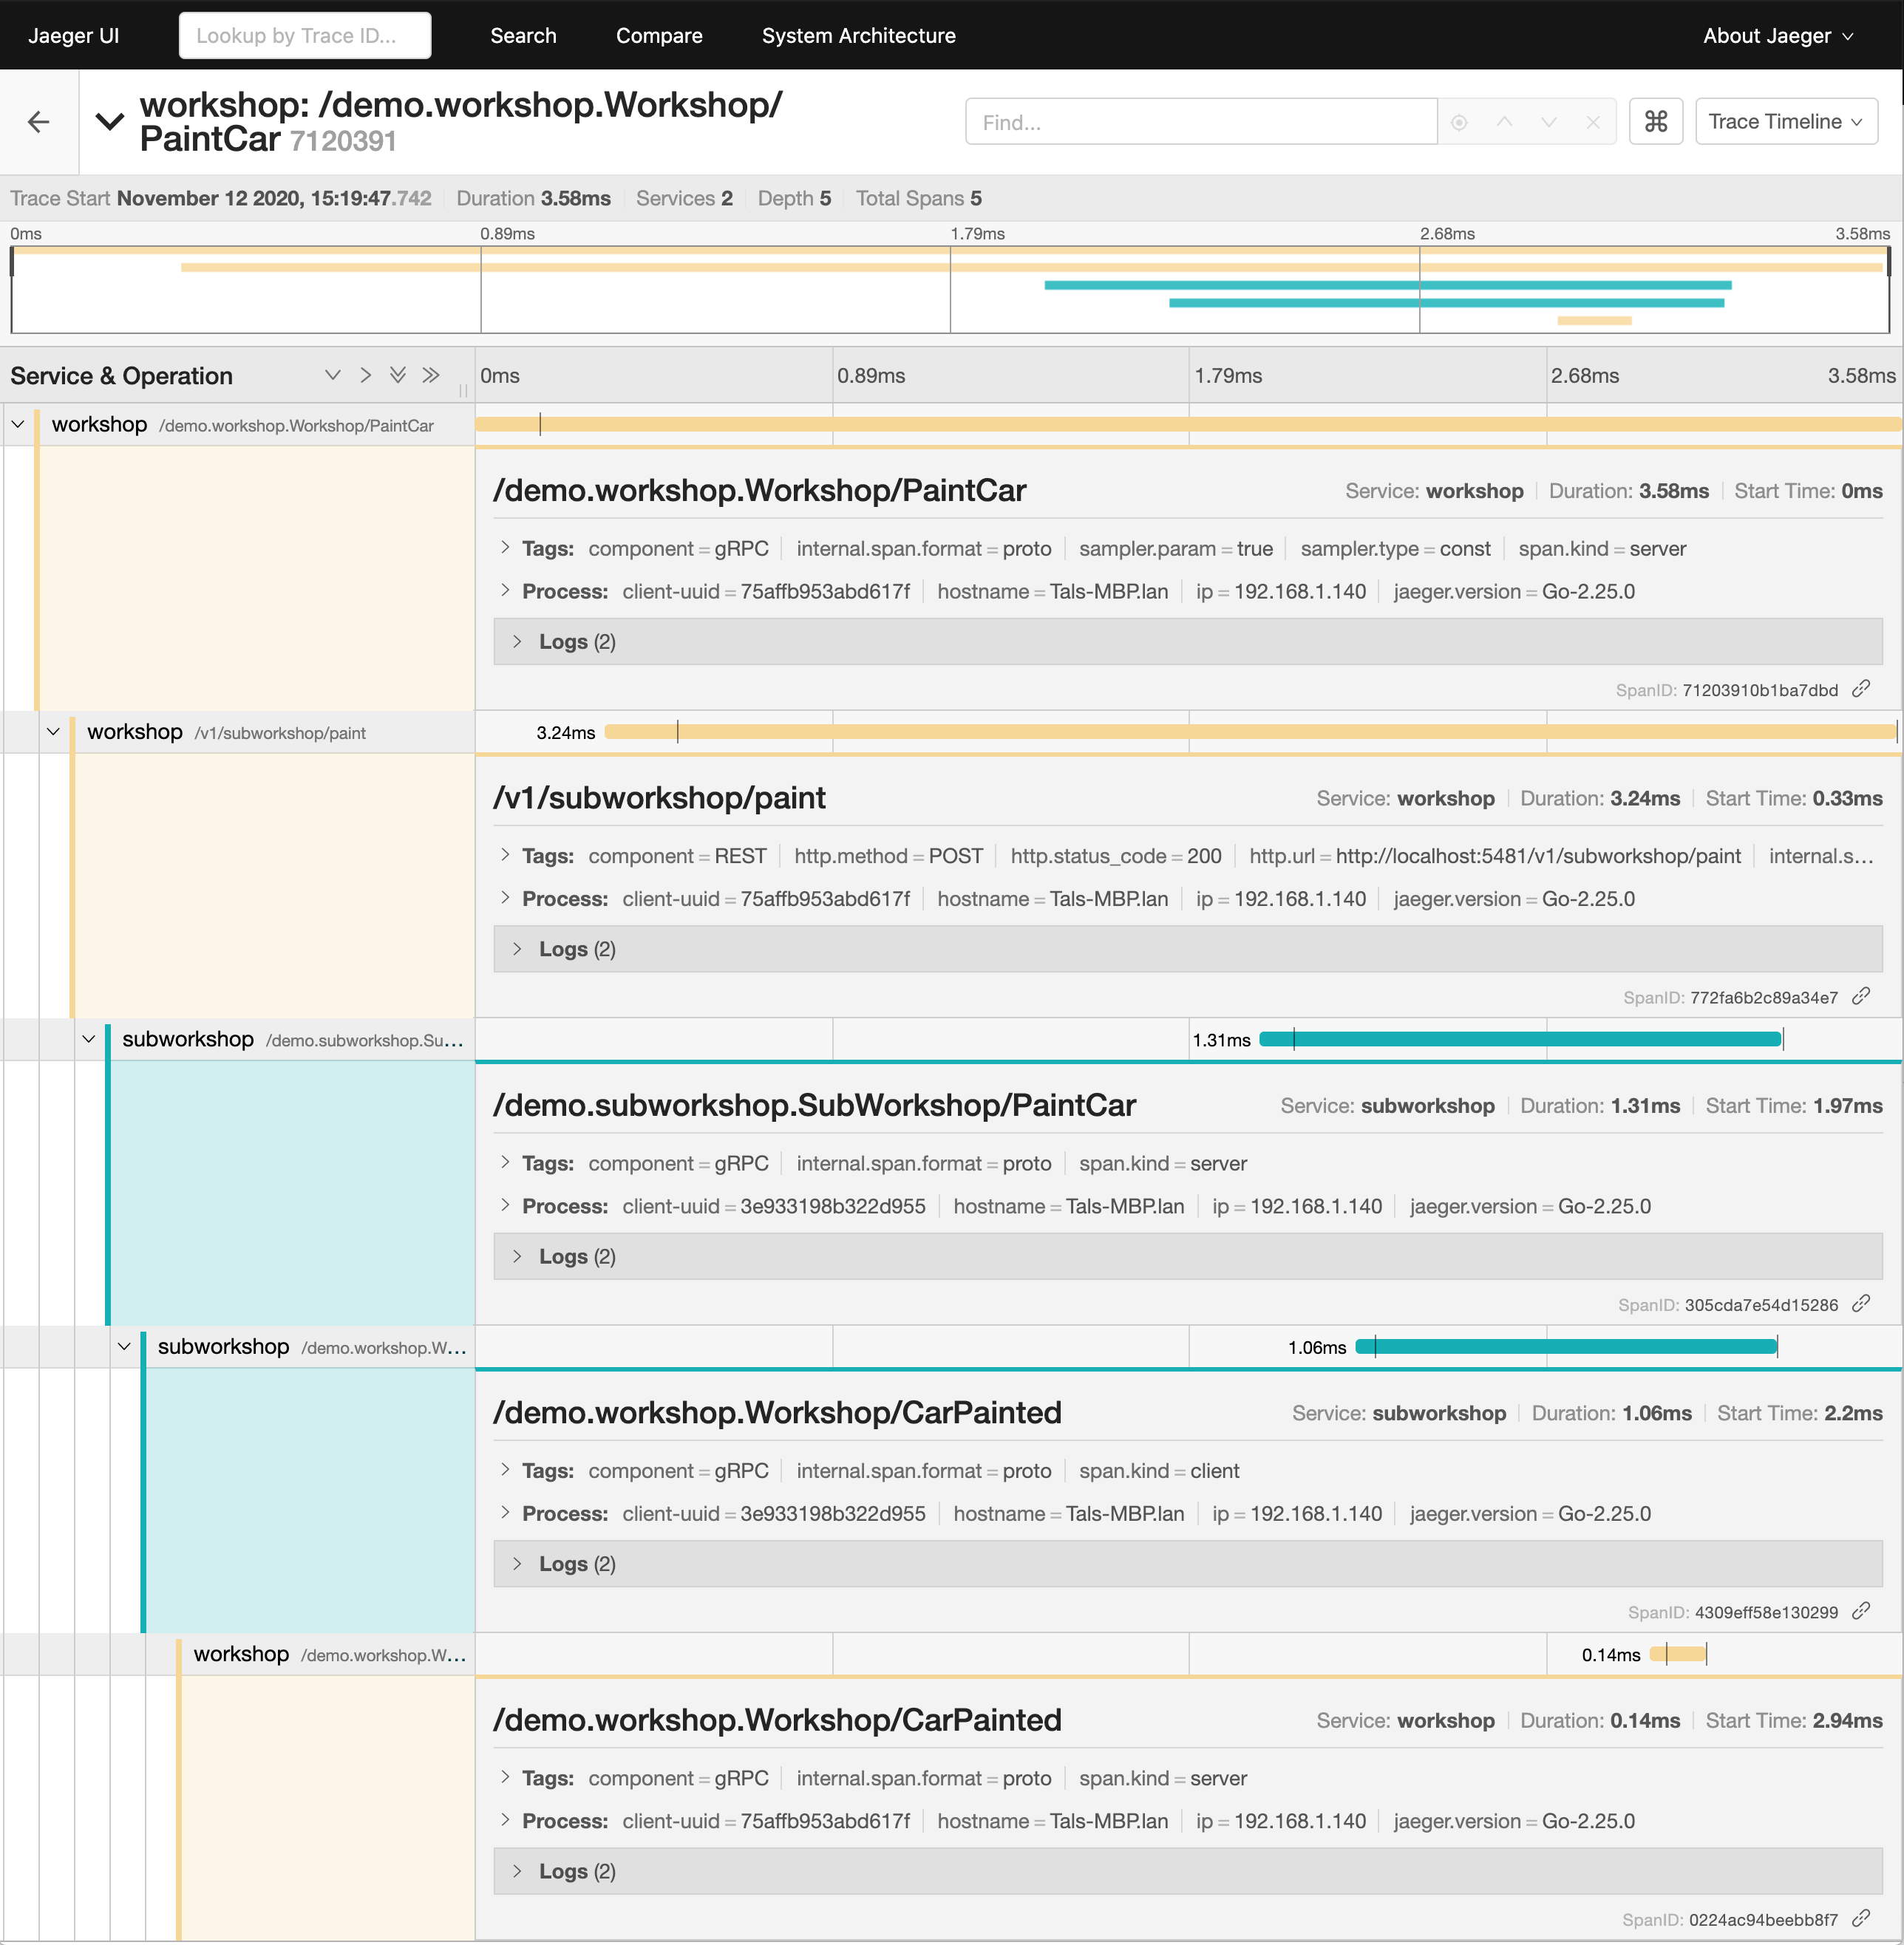
Jaeger can show you all the requests you've made including how they traveled if any to a remote services.
-
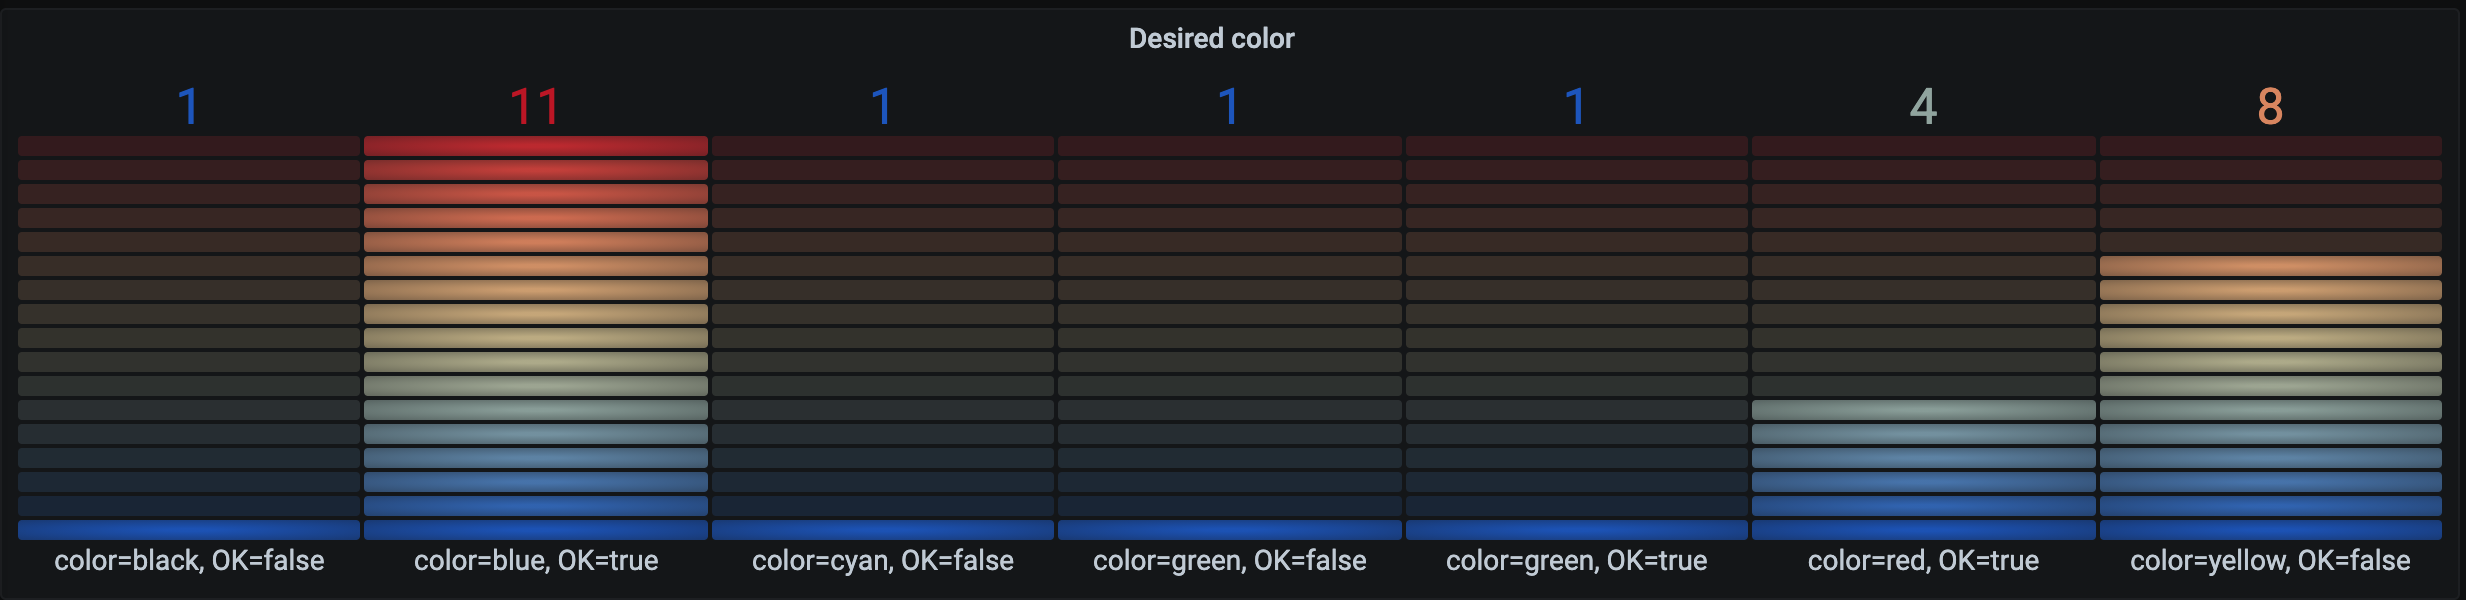
Prometheus/Grafana can be used to visualise different metrics that are recorded implicitly or explicitly.
counter := w.deps.Metrics.WithTags(monitor.Tags{
        "color": request.GetDesiredColor(),
        "success" : fmt.Sprintf("%t", err == nil),
       }).Counter("paint_desired_color", "New paint color for car")

counter.Inc()


Workshop is used as a "front" to accept cars, requests for paint, etc.
There is one special request which is actually a proxy to Sub Workshop service.
In this case we are calling Sub Workshop using *http.Client a.k.a REST.
This request really shows how different middleware/interceptors help you achieve great visibility.
- Open-Tracing is used to report how request is traveling between different services
- Logs implicitly inject Trace information, so you can later aggregate all the logs from different services related to a particular request.
- Metrics used to count different application insights (What 'color' is most popular)
All this is achieved mostly implicitly by using multiple middleware/interceptors.
Sub Workshop is here to serve as a remote service call.
This service only accepts one request - SubPaintCarRequest.
rpc PaintCar(SubPaintCarRequest) returns (google.protobuf.Empty) {
    option (google.api.http) = {
      post: "/v1/subworkshop/paint"
      body: "*"
    };
}
As part of its logic it will callback our Workshop service using gRPC.
This will complete our request cycle. You can see the entire Trace using Jaeger UI.