


D3 Scatter Plot demo application
Demo compiled and deployed with gulp-starter: http://golgistudio.github.io/d3-scatter-plot
(view files on gh-pages branch)
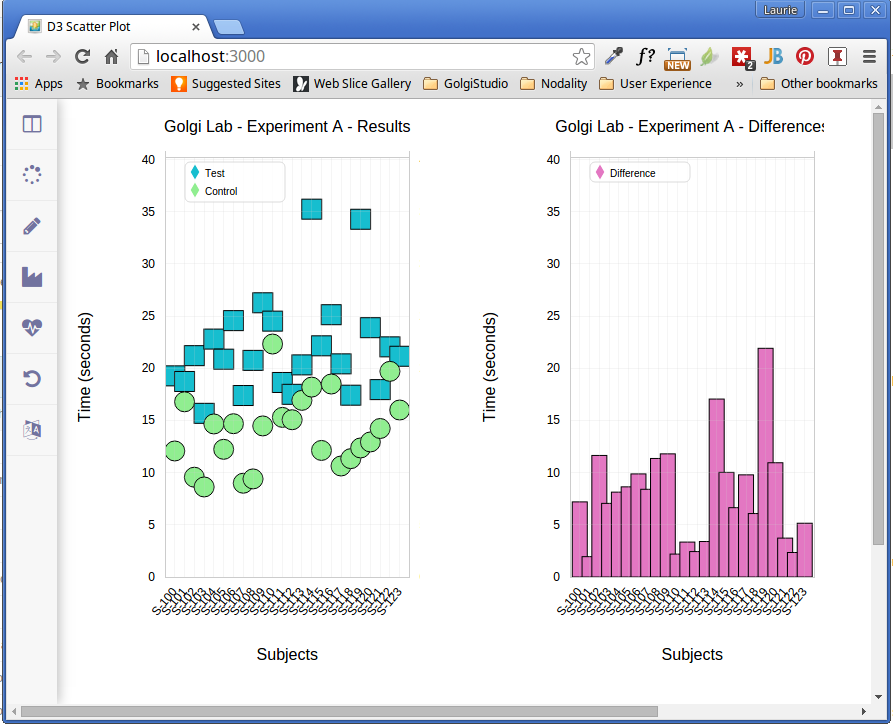
Table of contents
Overview
This is an example scatter plot built with D3. It is a simple application that can be used to explore data interactions and design data applications. Many D3 examples are static and hard coded, which makes it harder to explore interactions. This example demonstrates the variety of changes and interactions one would expect in a D3 application. It also separates out not only the data, but the properties that define the behavior so they can be changed via menu commands. Finally, it uses design patterns to decouple components.
A couple of guiding principles that were used
- Used only D3.js, no other external javascript libraries
- The navigation is intentionally very basic for quick prototyping
- Used Es6 modules
Getting started
The build system is based on vigetlabs excellent build system - gulp-starter and works on Linux and Mac computers.
Clone the repository, install the node dependencies and run the commands below to run the development version of the site. Note node is only used for the build system. This will run gulp with the following tasks
- Compile with webpack all js files
- Publish a local version of the site to demoApp/public
- Combine all the JS and css files into single js and css files.
- Update path references to js, css and image files.
- Launch the site in a browser window using express (http://localhost:3000)
- Launch browsersync (http://localhost:3001)
git clone https://github.com/golgistudio/d3-scatter-plot.git MyApp
cd MyApp
npm install
npm run gulp
To run a production version of the site...
npm run demoTo run tests...
npm run testTo generate documentation which will be output in demoApp/quality/docs. This is currently using jsdoc by itself, because es6 doesn't seem to be fully supported yet in the gulp version.
npm run docTo run jshint....
npm run gulp jshintTo deploy to ghpages...
in package.json, set the homepage to be your gh-pages site.
npm run deploy
Travis integration - .travise.yml
Running the application
Navigate to one the following sites: Experiment A Experiment B
Navigation
Data
- Reset - Restore original data set
- Add - Update data set with new points
- Remove - Updae data set by removing points
- Change - Update data set by changing the values of existing points
Symbol
- Circle
- Triangle
- Icon
- Square
Color
- Blue
- Purple
Plot Style
- Scatter
- Barchart
Experiment - change the experiment including titles, leged, tooltips, labels
- Experiment A
- Experiment B
Undo & Redo
- Undo
- Redo
- Unwind (ToDo)
- Rewind (ToDo)
Language (ToDo)
Responsiveness
- Resizes with the window resize
- Responds to orientation changes
Plot interactions
- Tooltip on hover
- Highlight points on both charts with the same x-axis value
- Y axis zoom
- Click legend item to toggle plot on/off
Design Patterns
- Command pattern - all menu commands, undo & redo
- Mediator pattern - event manager
- Singleton - Datastore
- Factory - ScatterPlot
Resources
D3
D3 Code Snippets
- zoom, pan, and axis rescale by stepheneb
- Zoomable Scatterplot by petersonjonas
- Zoom Ordinal scales
- Hover behavior with lines drawn to axes by nsonnad
- Simple D3 Line chart with Legend and Tooltips by bobmonteverde
- Vertical icon navigation with slide-out menu by nikhil
- Linking plots by jvadams
- Handline clipping on zoom
Build Tools
- Web Developer Checklist
- Gulp starter
- Gulp
- Webpack
- JS Docs - generate documentation from annotated comments
- JSHint - syntax checker for javascript
- browsersync
- Karma - javascript test runner
- babel - javascript compiler
- mocha - testing framework
- Sinon.js - javascript mocks
- Uglify
- npm - package manager
- Github