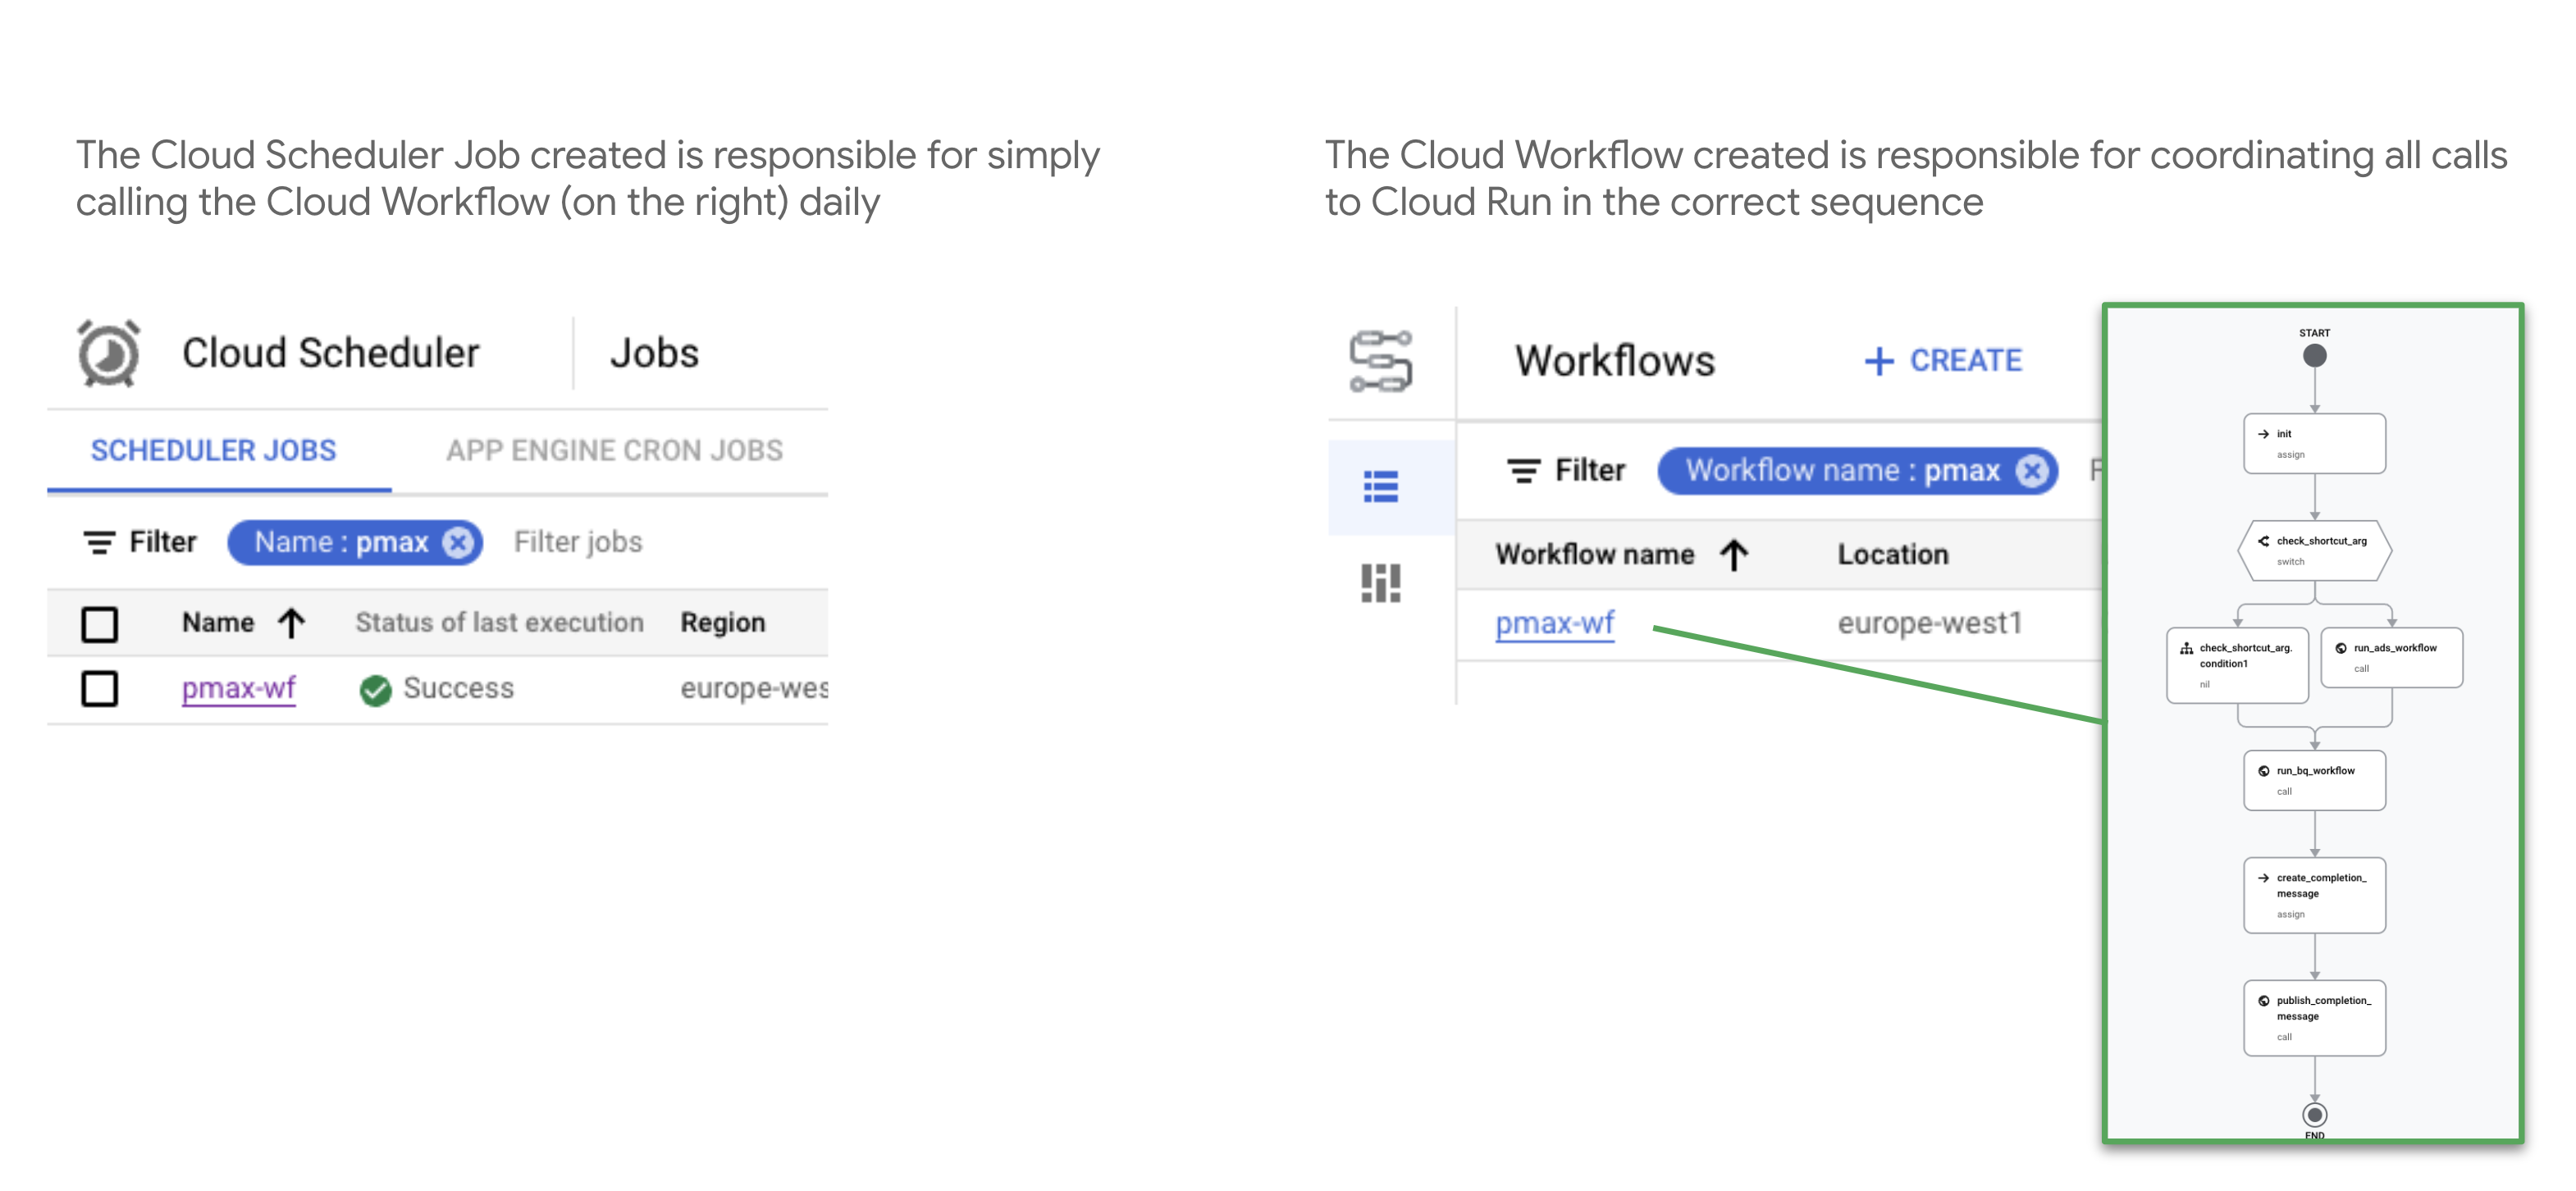
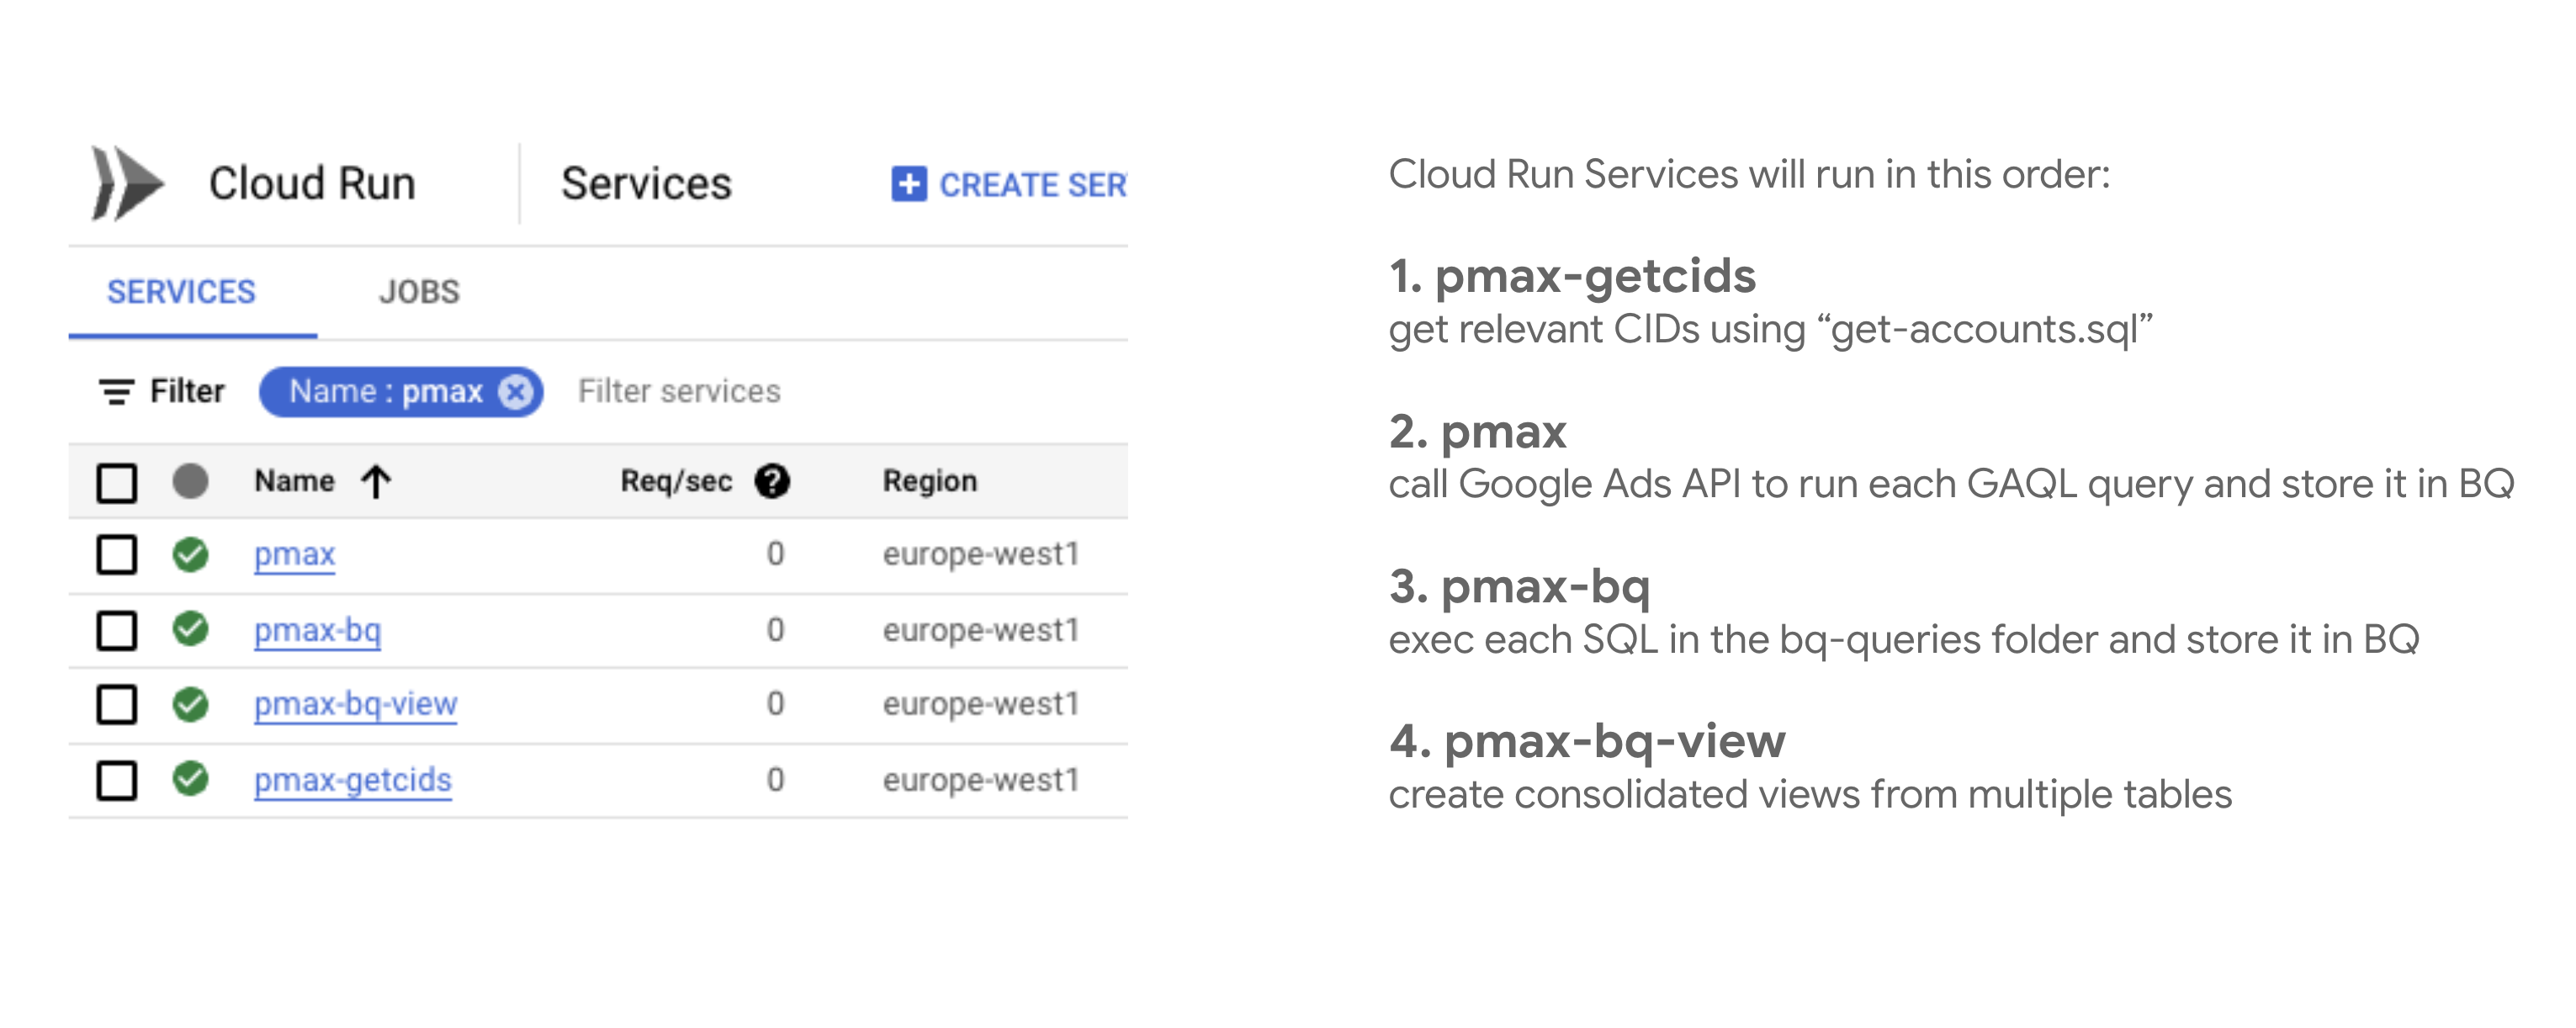
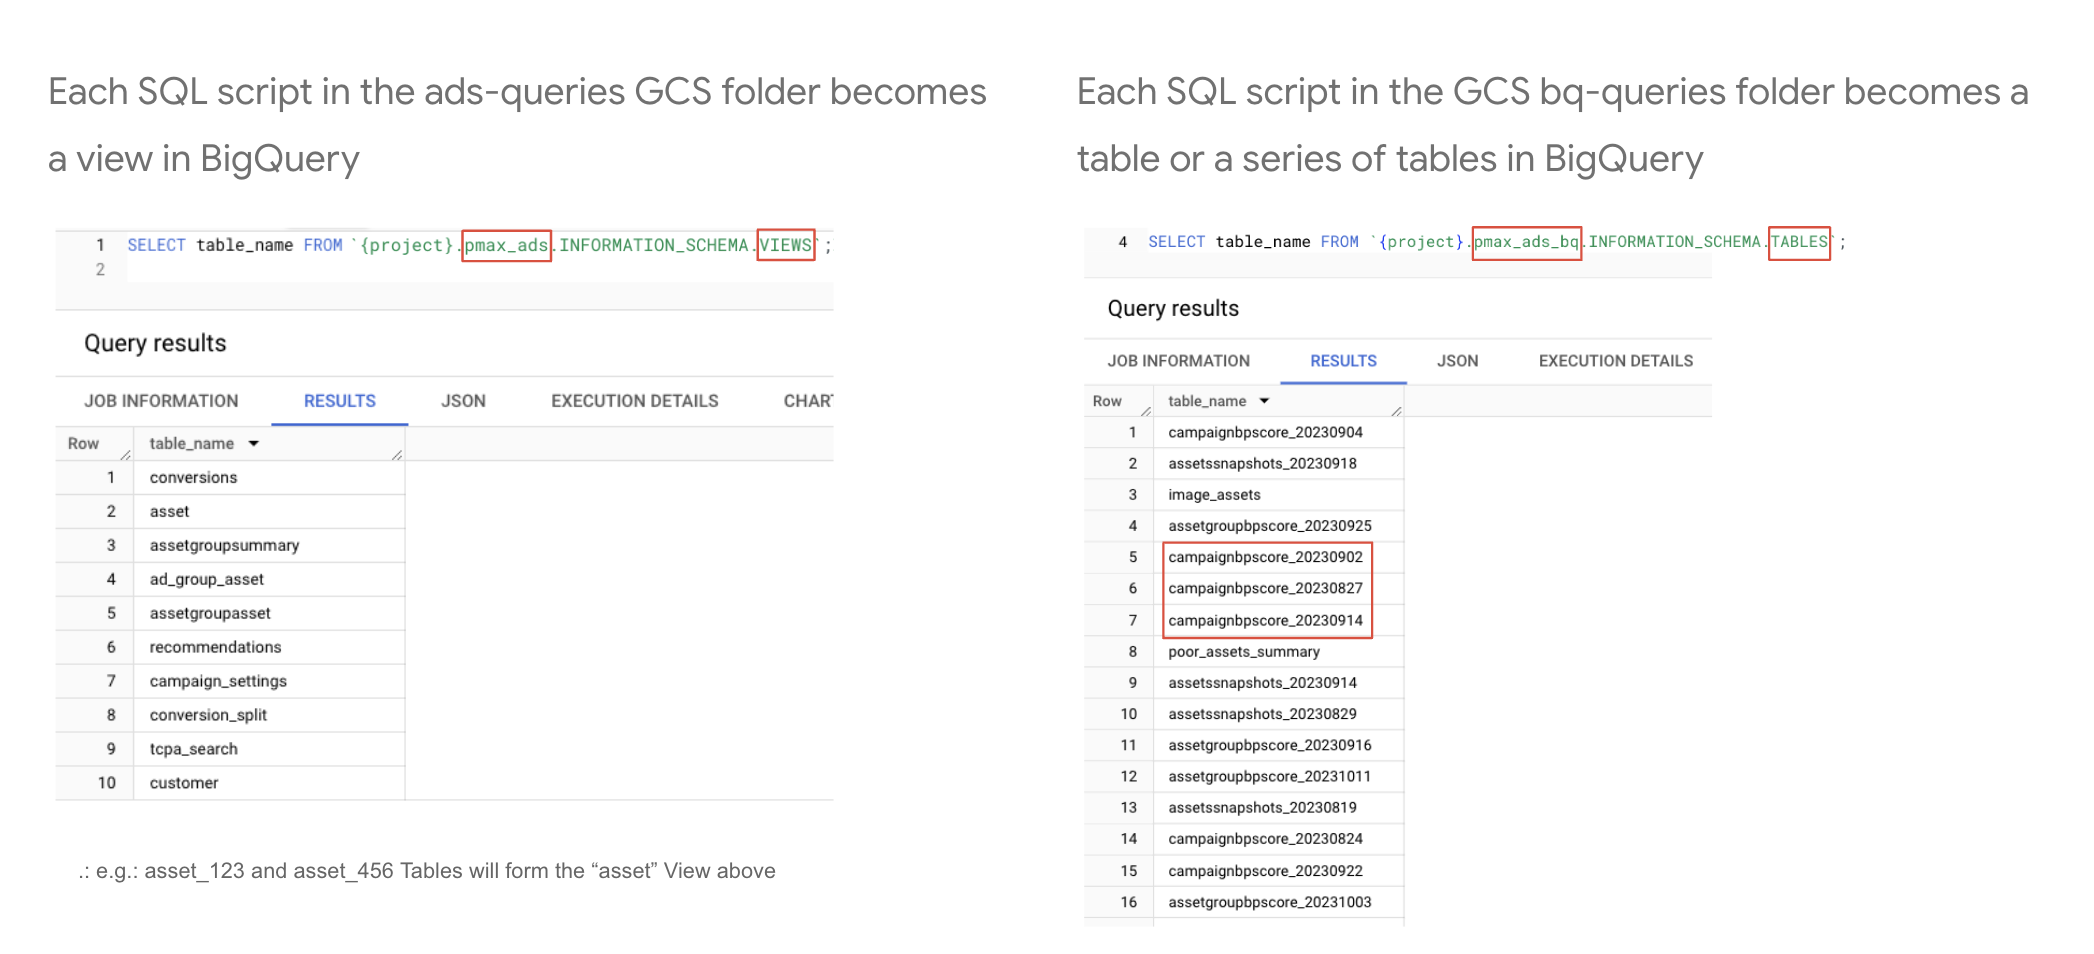
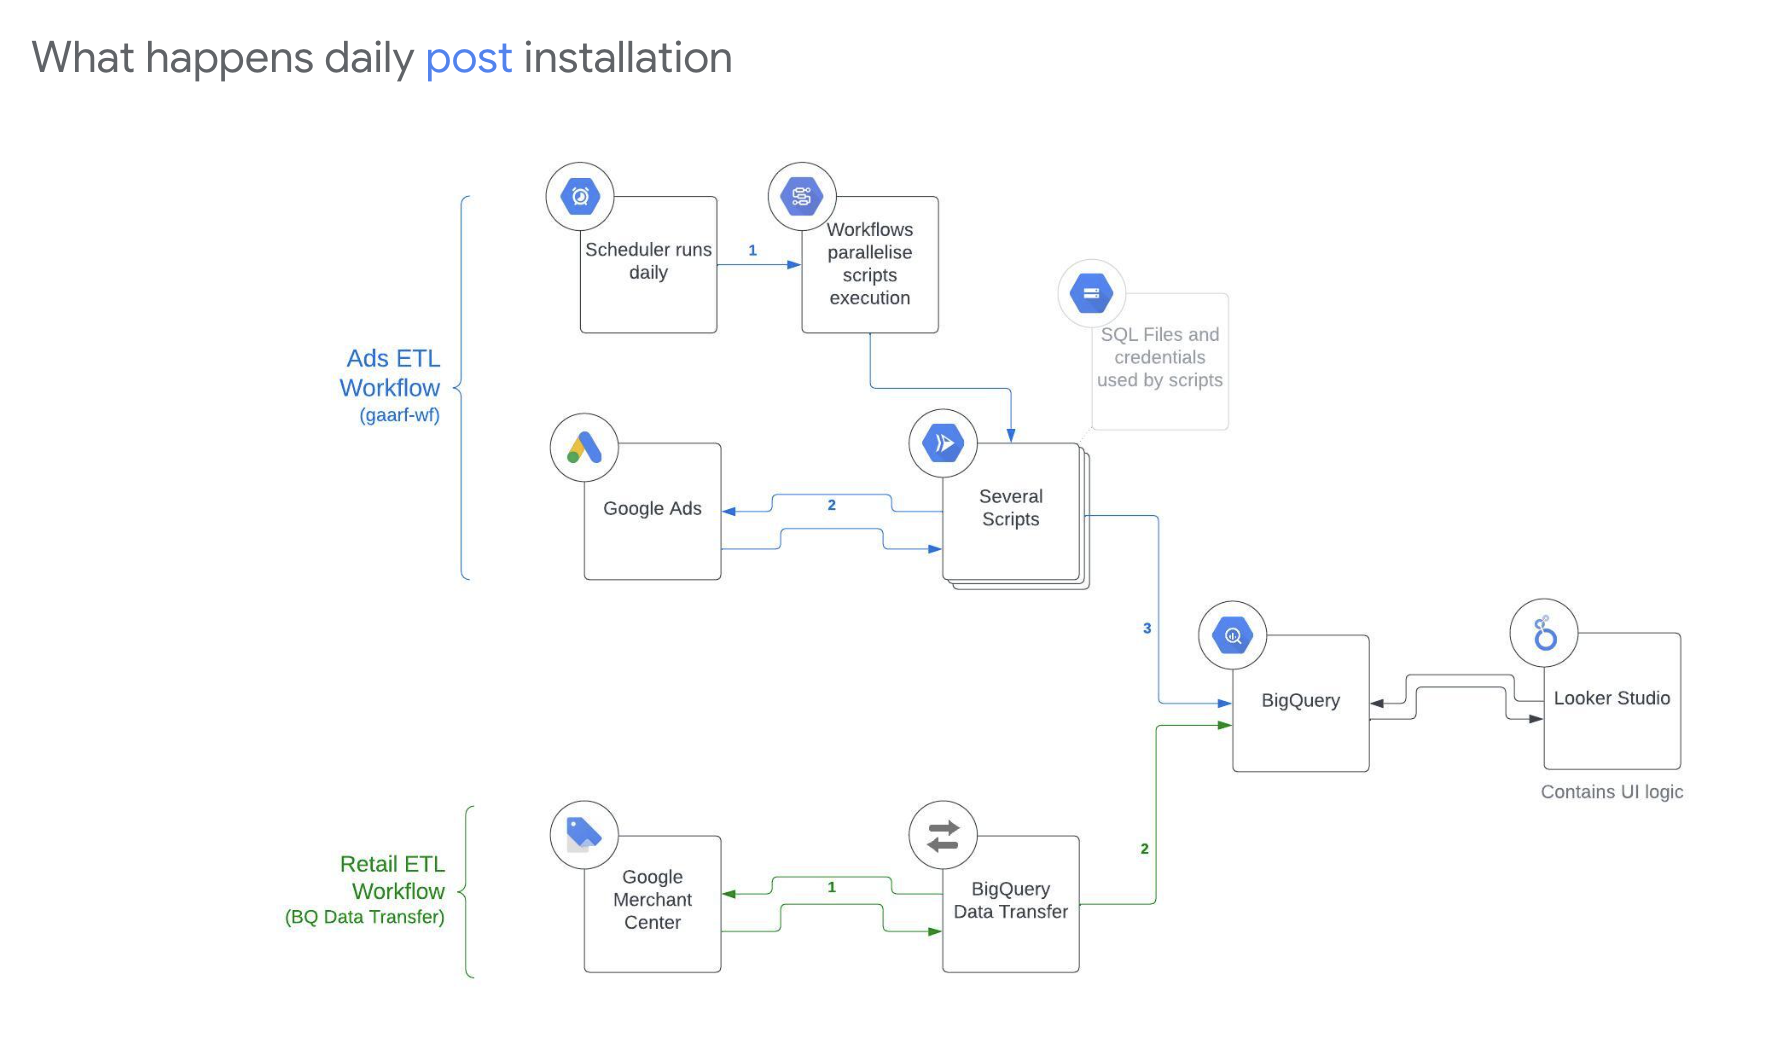
In this README, you'll find:
- Problem Statement
- Solution
- Installation
- Prerequisites
- Deliverable (Implementation)
- Architecture
- Troubleshooting / Q&A
- Disclaimer
Reporting for pMax campaigns is cumbersome and advertisers need a simple way to see an overview of their accounts and get a clear picture of their assets's performance in their pmax campaigns.
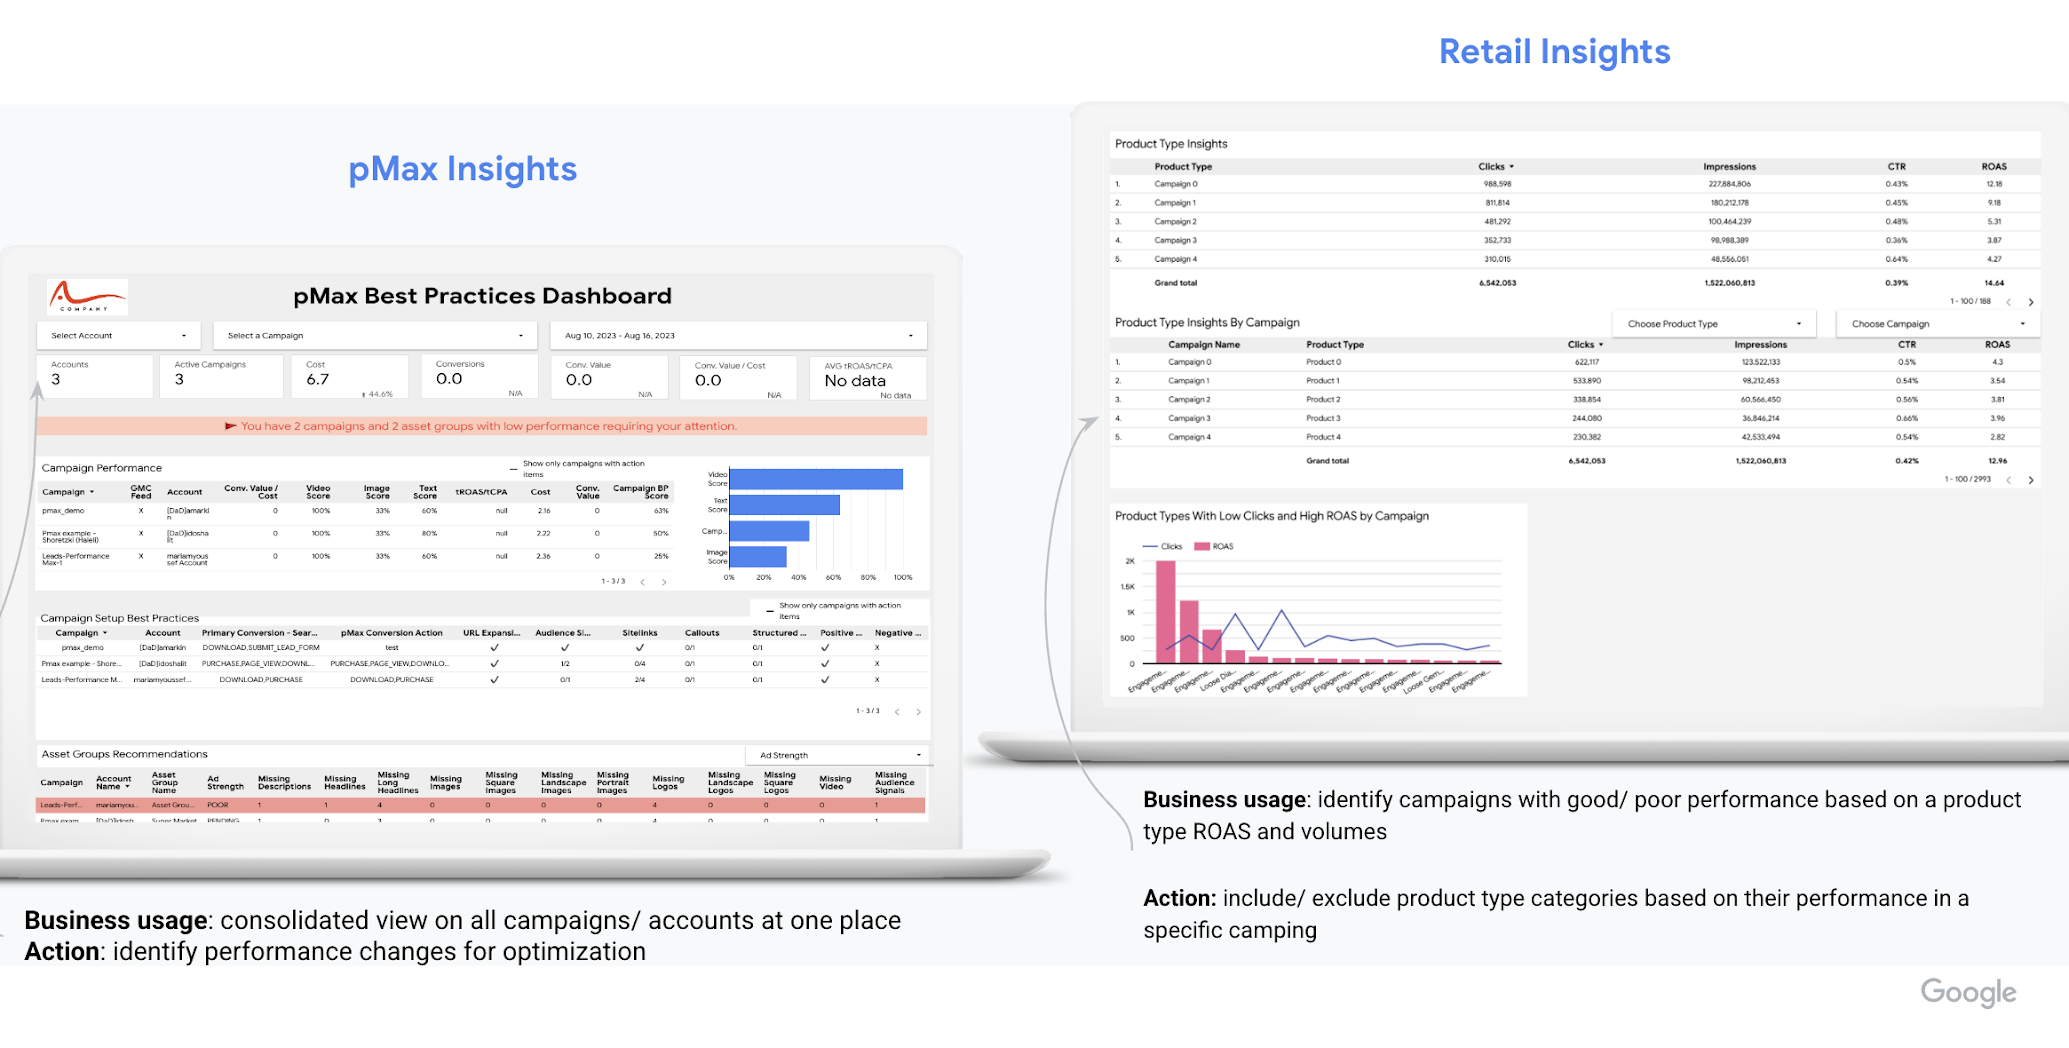
pMaximizer is a best practice dashboard that provides a centralized monitoring of the pMax campaigns' performance and the assets uploaded. Built in Looker Studio, It helps clearly identify if the campaigns and assets comply with the best practice guidelines and gives actionable insights to enhance asset groups' and feed quality.
Moreover, assets' performance is displayed and conveniently presented so advertisers can refresh poorly performing assets.
A Looker Studio dashboard based on your Google Ads data. After joining the group below, click here to see it in action.
- LookerStudio dashboard based on your Google Ads data.
-
Join this group
-
Obtain a Developer token
a. This can be found in Google Ads on the MCC level
b. Go to Tools & Settings > Setup > API Center. If you do not see a developer token there, please complete the details and request one.
c. By default, your access level is 'Test Account'; please apply for 'Basic access' if you don't have it. Follow these instructions
-
Create a new Google Cloud Project on the Google Cloud Console, make sure it is connected to a billing account
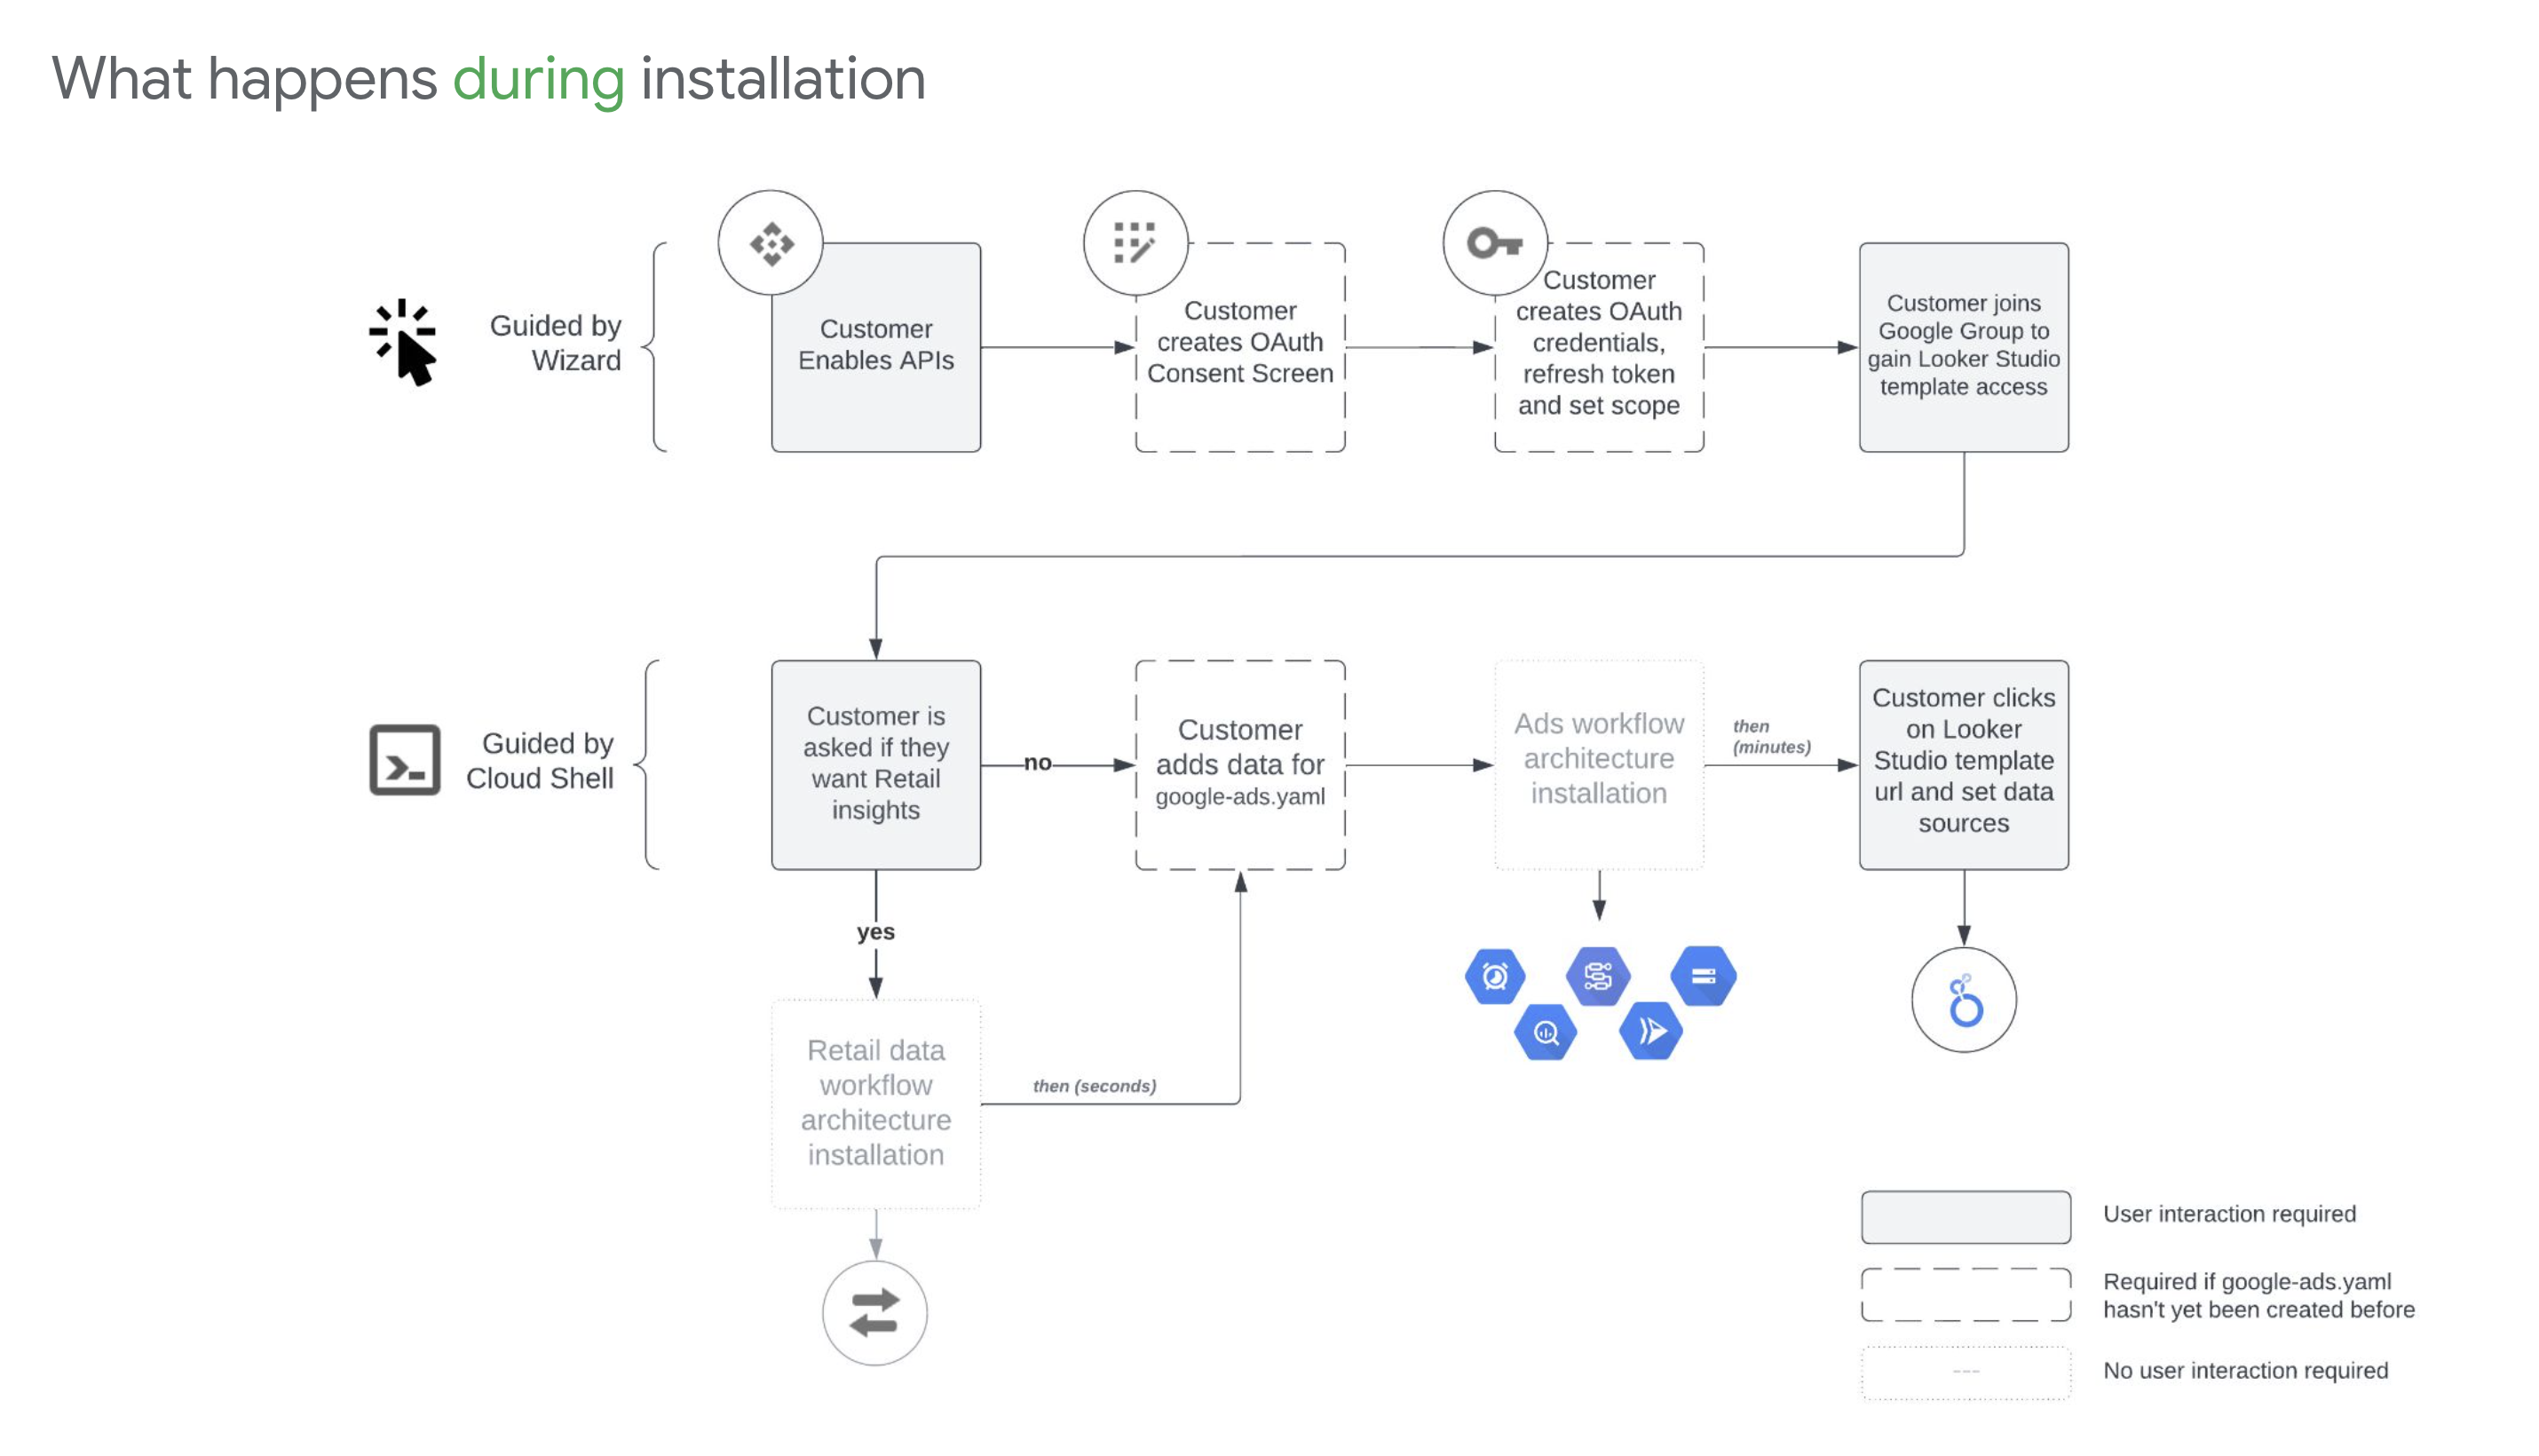
Click this link to be redirected to a step-by-step Google Cloud tutorial on deploying pMaximizer.
To update the code and produce a new updated dashboard link, follow these steps. (If you wish to keep the same dashboard as you previously produced, you can, but in that case, only backend updates will be implemented.)
- Enter the Google Cloud Platform (GCP).
- Make sure you’re in the project where you deployed the pMaximizer.
- Activate the Cloud Shell by clicking on the "Activate Cloud Shell" icon on the upper right side of the screen:
- Execute (copy to the Cloud Shell and press Enter) the following commands in your Cloud Shell:
cd pmax_best_practices_dashboard
git pull
sh upgrade_pmaximizer.sh
Follow the link at the end of the deployment process to see access the upgraded dashboard, or use your previous link if you wish to only update the backend of the dashboard.
You do not need any technical skills to deploy the dashboard as it’s fully driven by clicks and “copy and paste” commands. However, you do need the Owner level permission in the Google Cloud project you’re deploying it to.
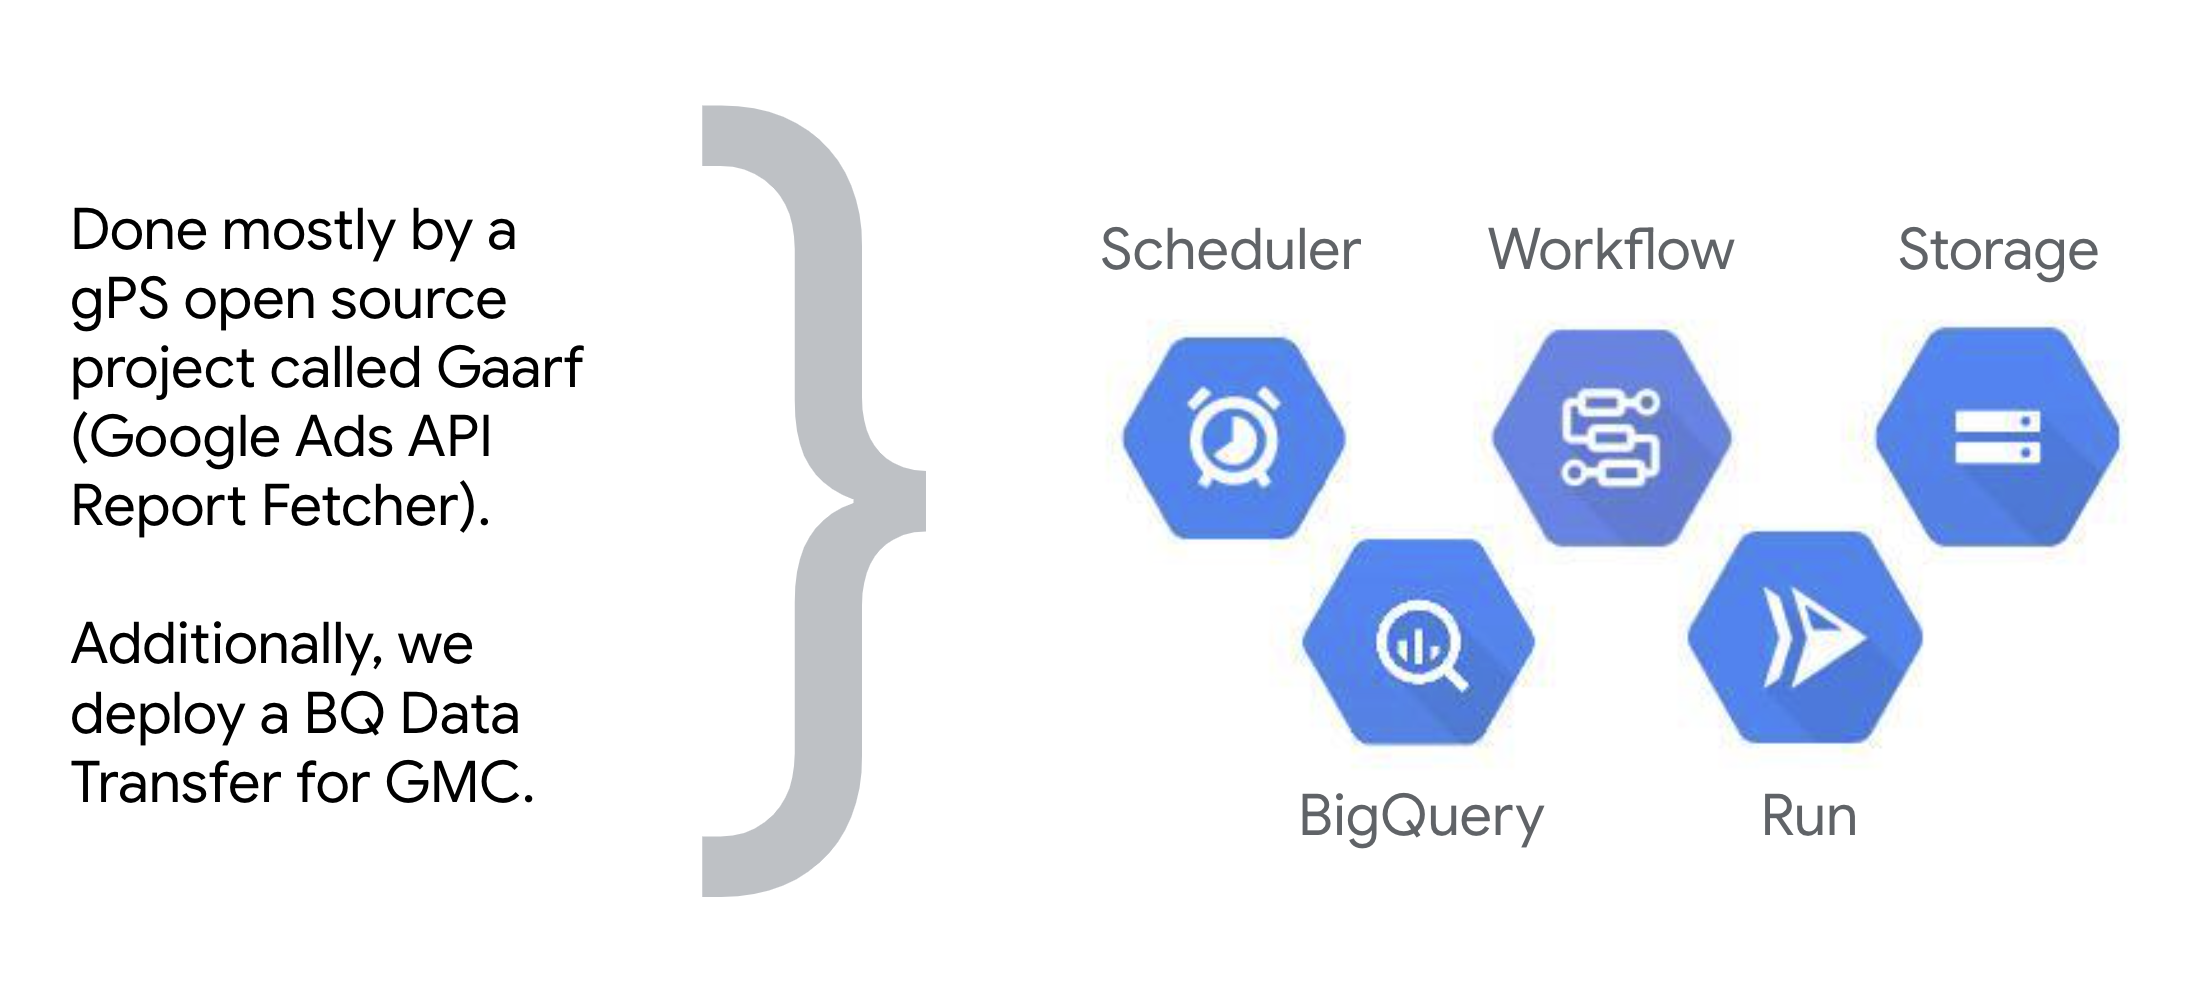
- Storage
- Scheduler
- Workflows
- Run
- BigQuery (Datasets and Data Transfer)
If the deployment was unsuccessful please follow these steps to try and troubleshoot:
- Check that all credentials in the google-ads.yaml are correct:
- In The Google Cloud Platform, under the project you deployed the pMax Dashboard too, Click the “Activate Cloud Shell” icon:
- Click the “Open Editor” icon:
- In the File System, find the pmax_best_practices directory.
- In the pmax_best_practices directory, find the google-ads.yaml file and click on it.
- Review the credentials in the google-ads.yaml file. Make sure that they are correct, and that there are no quotation marks before any credential.
- Check that the login_customer_id is all digits, with no dashes (i.e: 123456789 and not 123-456-789)
- If you find a mistake, edit it in place and be sure to save, and follow the next steps. If not, please refer to “How do I see logs from my deployment?” in the next section.
- Click the “Open Terminal” icon:
- In the Cloud shell, copy and paste the green code, and press the Enter key when specified:
cd pmax_best_practices_dashboardPress Entersh upgrade_pmaximizer.shPress Enter
- After the run finishes (may take 15-30 minutes) Check the dashboard URL to see if the deployment succeeded. (you can see instructions on how to find the dashboard URL in this document).
- In The Google Cloud Platform, under the project you deployed the pMax Dashboard too, Click the “Activate Cloud Shell” icon:
- In the Google Cloud Platform, under the project you deployed the pMax Dashboard too, click on the “Search” bar in the central upper part of the screen
- Type “Logs Explorer” in the search bar and click on the following:
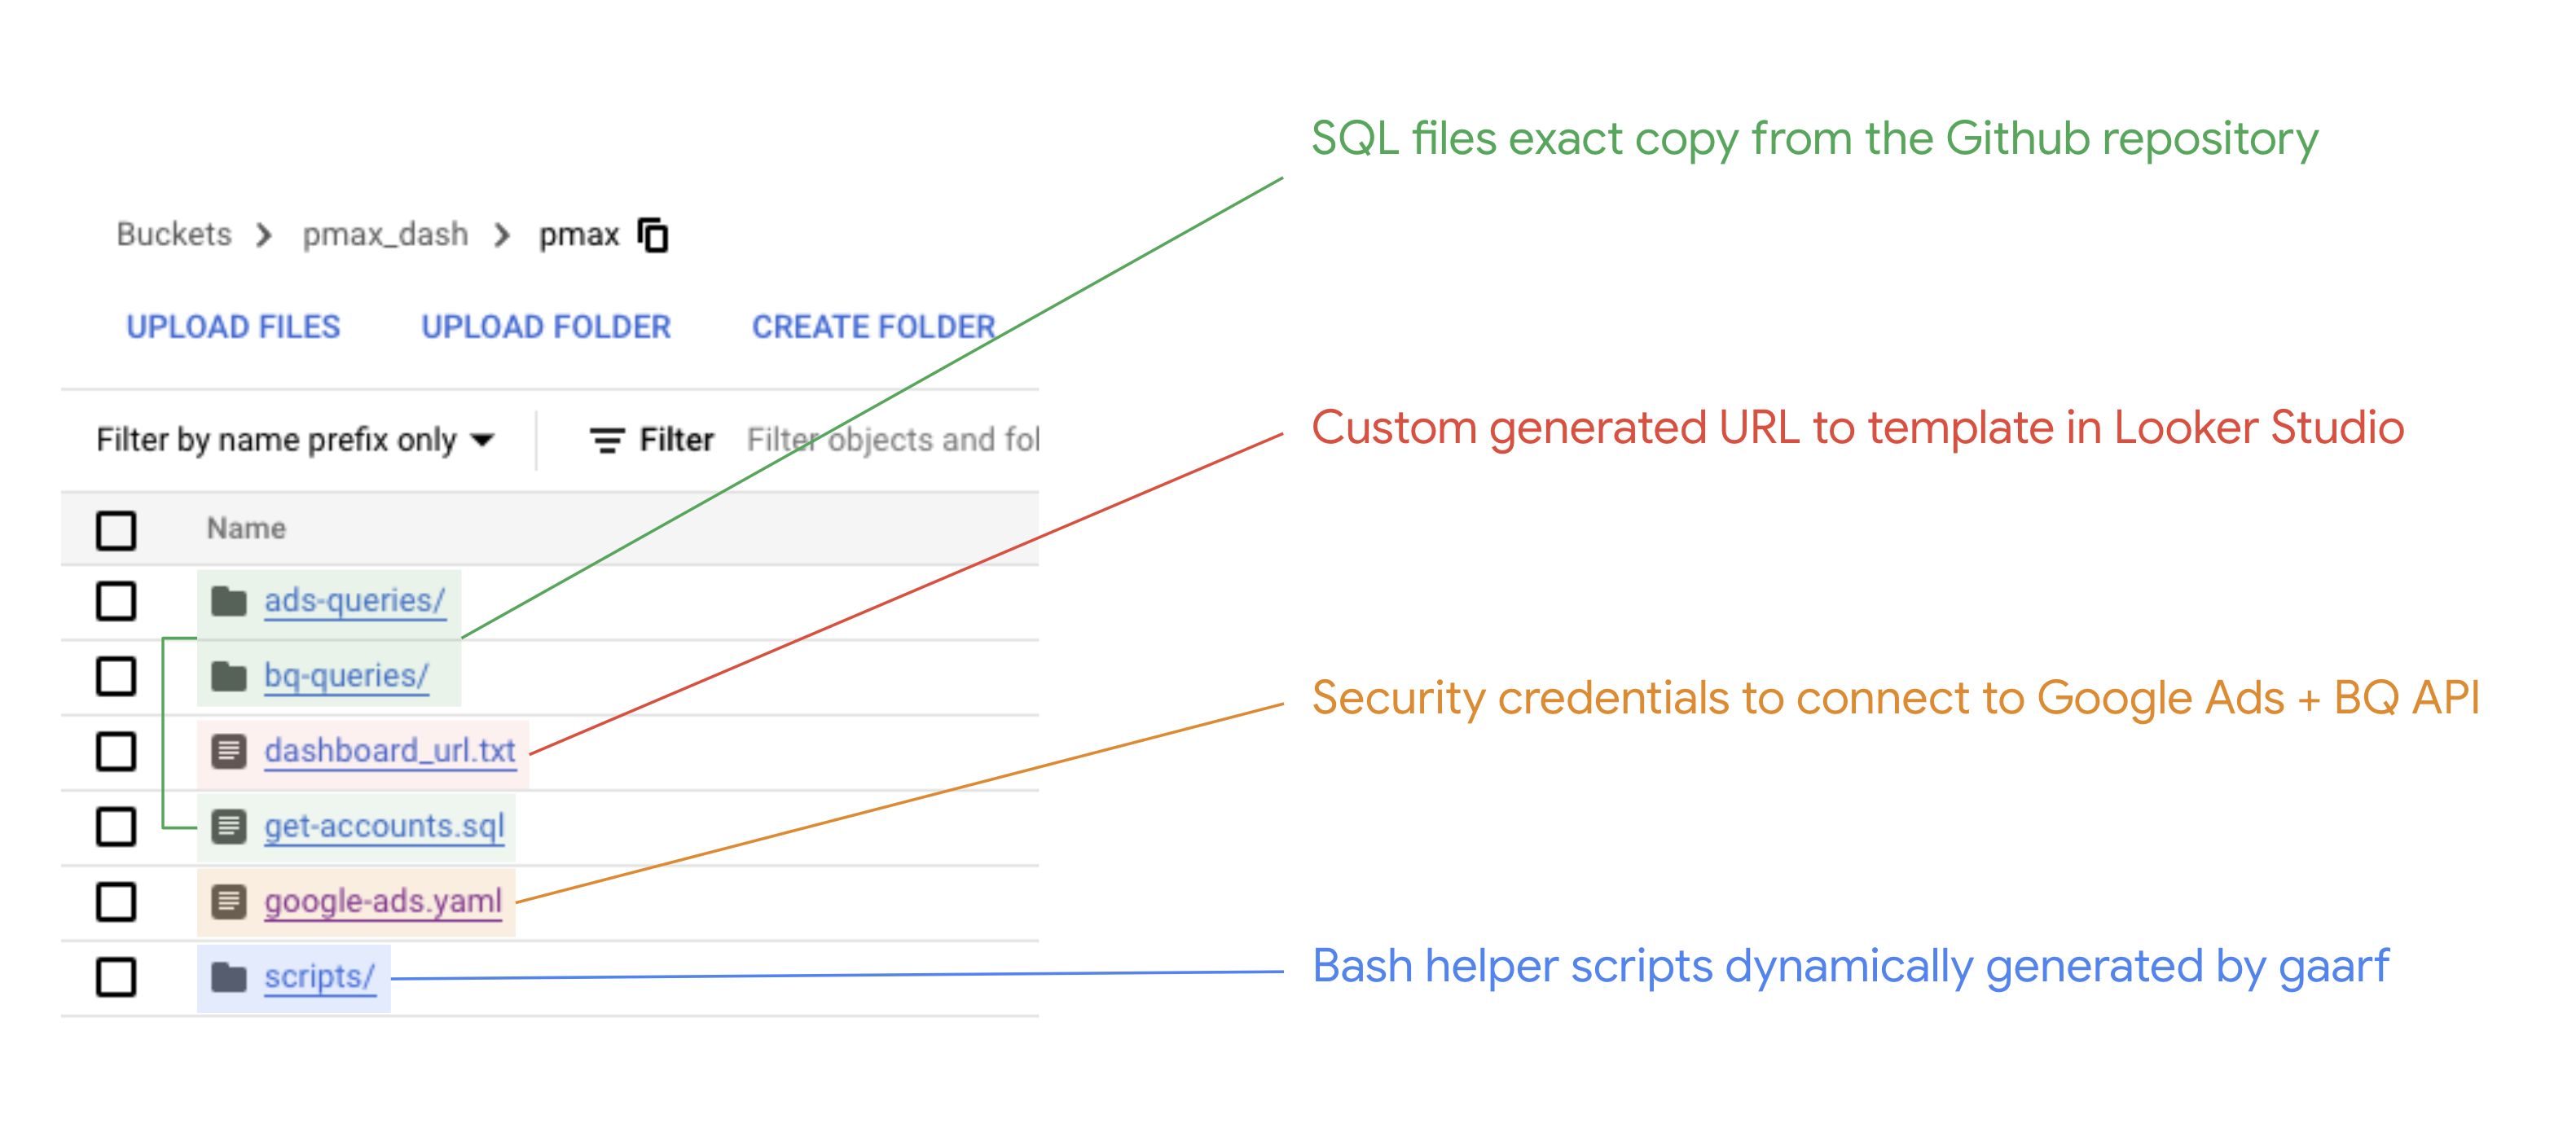
You can find the dashboard_url.txt file in the folder of the cloned repository or in your GCS bucket. Please see these instructions on how to access the URL through the cloud shell:
- In The Google Cloud Platform, under the project you deployed too, Click the “Activate Cloud Shell” icon:
- In the Cloud shell, copy and paste the green code, and press the Enter key when specified:
- Non-Retailers:
cd pmax_best_practices_dashboardPress Entercat dashboard_url.txtPress Enter
- Retailers:
cd pmax_best_practices_dashboard/work_retailPress Entercat dashboard_url.txtPress Enter
- Non-Retailers:
The dashboard URL should then appear in the Shell.
Your Access Token has to have "Basic Access" or "Standard". Level "Test Account" will not work:
After clicking the dashboard URL for the first time, you will see the LookerStudio dashboard. In order to save and share it you need to follow these steps:
- On the upper right side of the screen, click "Save and Share"
- Review the Credentials permissions of the different data sources. If you would like to give other colleagues permission to view all parts of the dashboard, even if they don’t have permissions to the Google Cloud Project it was created in, you need to change the credentials to Owner’s.
- To change the credentials to Owner’s, you need to click Edit on the very most right column:
- Click on Data Credentials:
- Choose Owner’s credentials, and then Update:
- Click Done on the upper right.
- Do this for all data sources in the Dashboard.
- Click “Save and Share” again, and “Acknowledge and save”
- Click “Add to Report”.
- On the upper right, Click Share:
to share with teammates.
### How much does it cost? It heavily depends on how much data you have and how often it's used. If you check the Architecture of Components section, there are 5 cloud components: Run, Scheduler, Workflows, Storage and BigQuery. For a large amount of data (e.g. thousands of accounts, campaigns and products), we do not expect more than 10-15 USD/month in Google Cloud, mainly driven by Big Query.
Please find this Looker Studio tutorial.
If you’re a google workspace user: Internal If you’re not a google-workspace user: External. You should be ok to use it in "Test mode" instead of requesting your app to be approved by Google.
How do I modify the results I get the dates of the data being pulled / how do I modify the hour the data is getting pulled?
You can modify the answers.json file. In the GCP, open the cloud shell.
Yes! You can just change the ads_macro.start_date in answers.json file (shown above) while deploying to a value that covers the dates where the campaigns were active. By default it sets start_date to 90 days ago.
Can I deploy it in an existing Cloud Project or do I need to create a new one just for this dashboard?
You can use an existing Project if you want to. However, please remember that the best practice for clients is to create a new project dedicated to this solution (or any new solution).
Please refer to the folder google_ads_queries.
Yes! You can just change the ads_macro.start_date in answers.json file while deploying to a value that covers the dates where the campaigns were active. By default it sets start_date to 90 days ago.
Can I deploy it in an existing Cloud Project or do I need to create a new one just for this dashboard?
You can use an existing Project if you want to. However, please remember that the best practice for clients is to create a new project dedicated to this solution (or any new solution).
- Enter the Google Cloud Platform (GCP).
- Make sure you’re in the project you deployed the pMaximizer to.
- Activate the Cloud Shell by clicking on the "Activate Cloud Shell" icon on the upper right side of the screen:
- Execute (copy to the cloud shell and press enter) the following commands in your Cloud Shell:
cd pmax_best_practices_dashboard
git pull
sh non_retail_to_retail_upgrade.sh
Follow the link at the end of the deployment process to access your new retail pMaximizer.
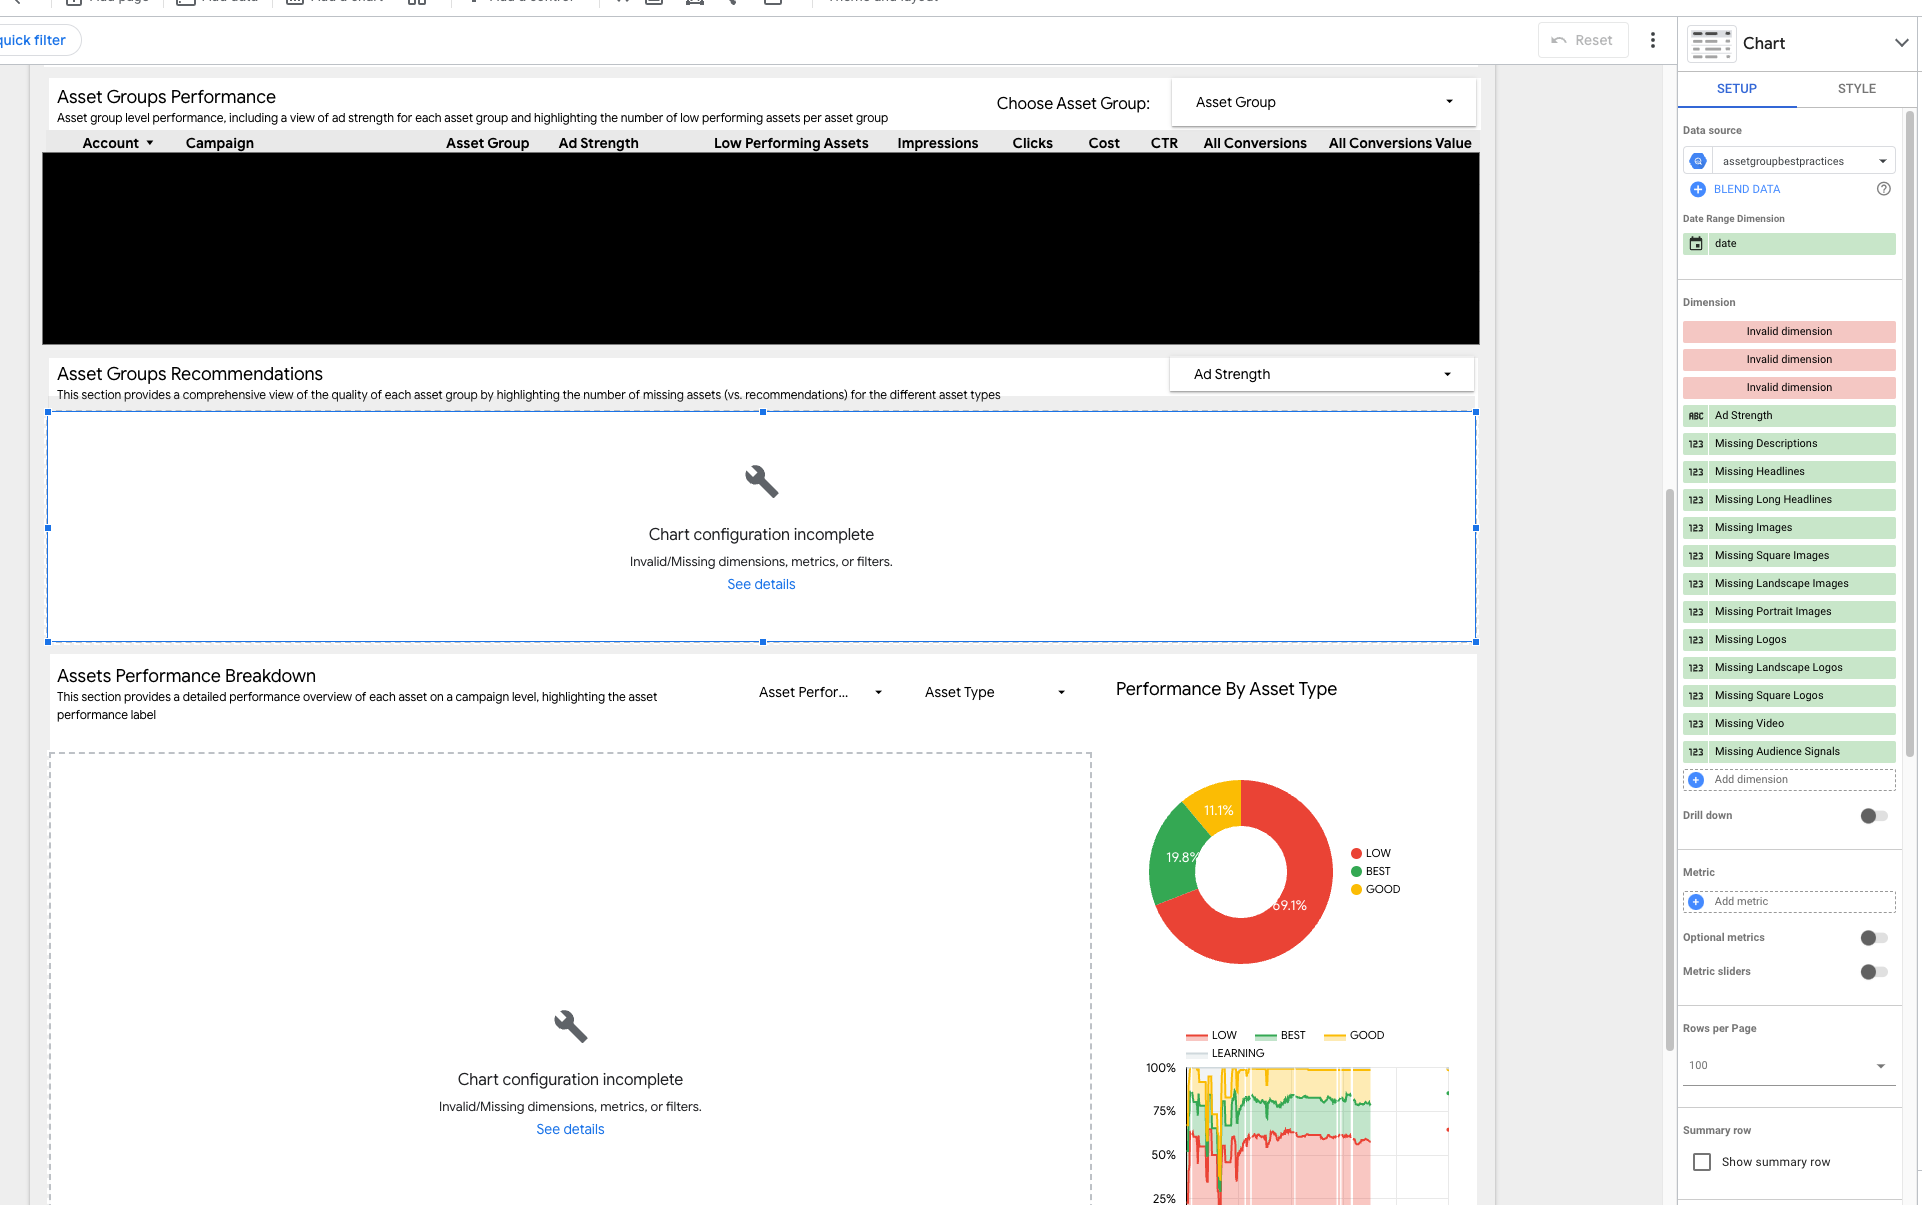
After finishing an upgrade, some tables are missing, and when looking at the table properties I see an "Invalid dimension" error for two or three of the top columns (see screenshot):
This could be caused by newly introduced columns that allow deep linking into the respective accounts, campaigns, or asset groups. If you do not want deep linking, you can simply replace the broken (red) columns of your tables with account_name, campaign_name, and asset_group_name respectively.
If you do want the deep linking feature, see full instructions on how to fix the issue in this document (you need to be part of the Google group to access the document).
If you can’t find an answer for your question/a solution to your problem here, please reach out to pmax_bpdash@google.com.
** This is not an officially supported Google product.**
Copyright 2021 Google LLC. This solution, including any related sample code or data, is made available on an “as is,” “as available,” and “with all faults” basis, solely for illustrative purposes, and without warranty or representation of any kind. This solution is experimental, unsupported and provided solely for your convenience. Your use of it is subject to your agreements with Google, as applicable, and may constitute a beta feature as defined under those agreements. To the extent that you make any data available to Google in connection with your use of the solution, you represent and warrant that you have all necessary and appropriate rights, consents and permissions to permit Google to use and process that data. By using any portion of this solution, you acknowledge, assume and accept all risks, known and unknown, associated with its usage, including with respect to your deployment of any portion of this solution in your systems, or usage in connection with your business, if at all.
