Note: This extension is merged into the Fuchsia extension and will be deprecated shortly. Please use the Fuchsia extension for debugger support.
The VS Code zxdb extension provides IDE based zxdb debugger support for developers working with the open source Fuchsia operating system.
Note: This is not an officially supported Google product
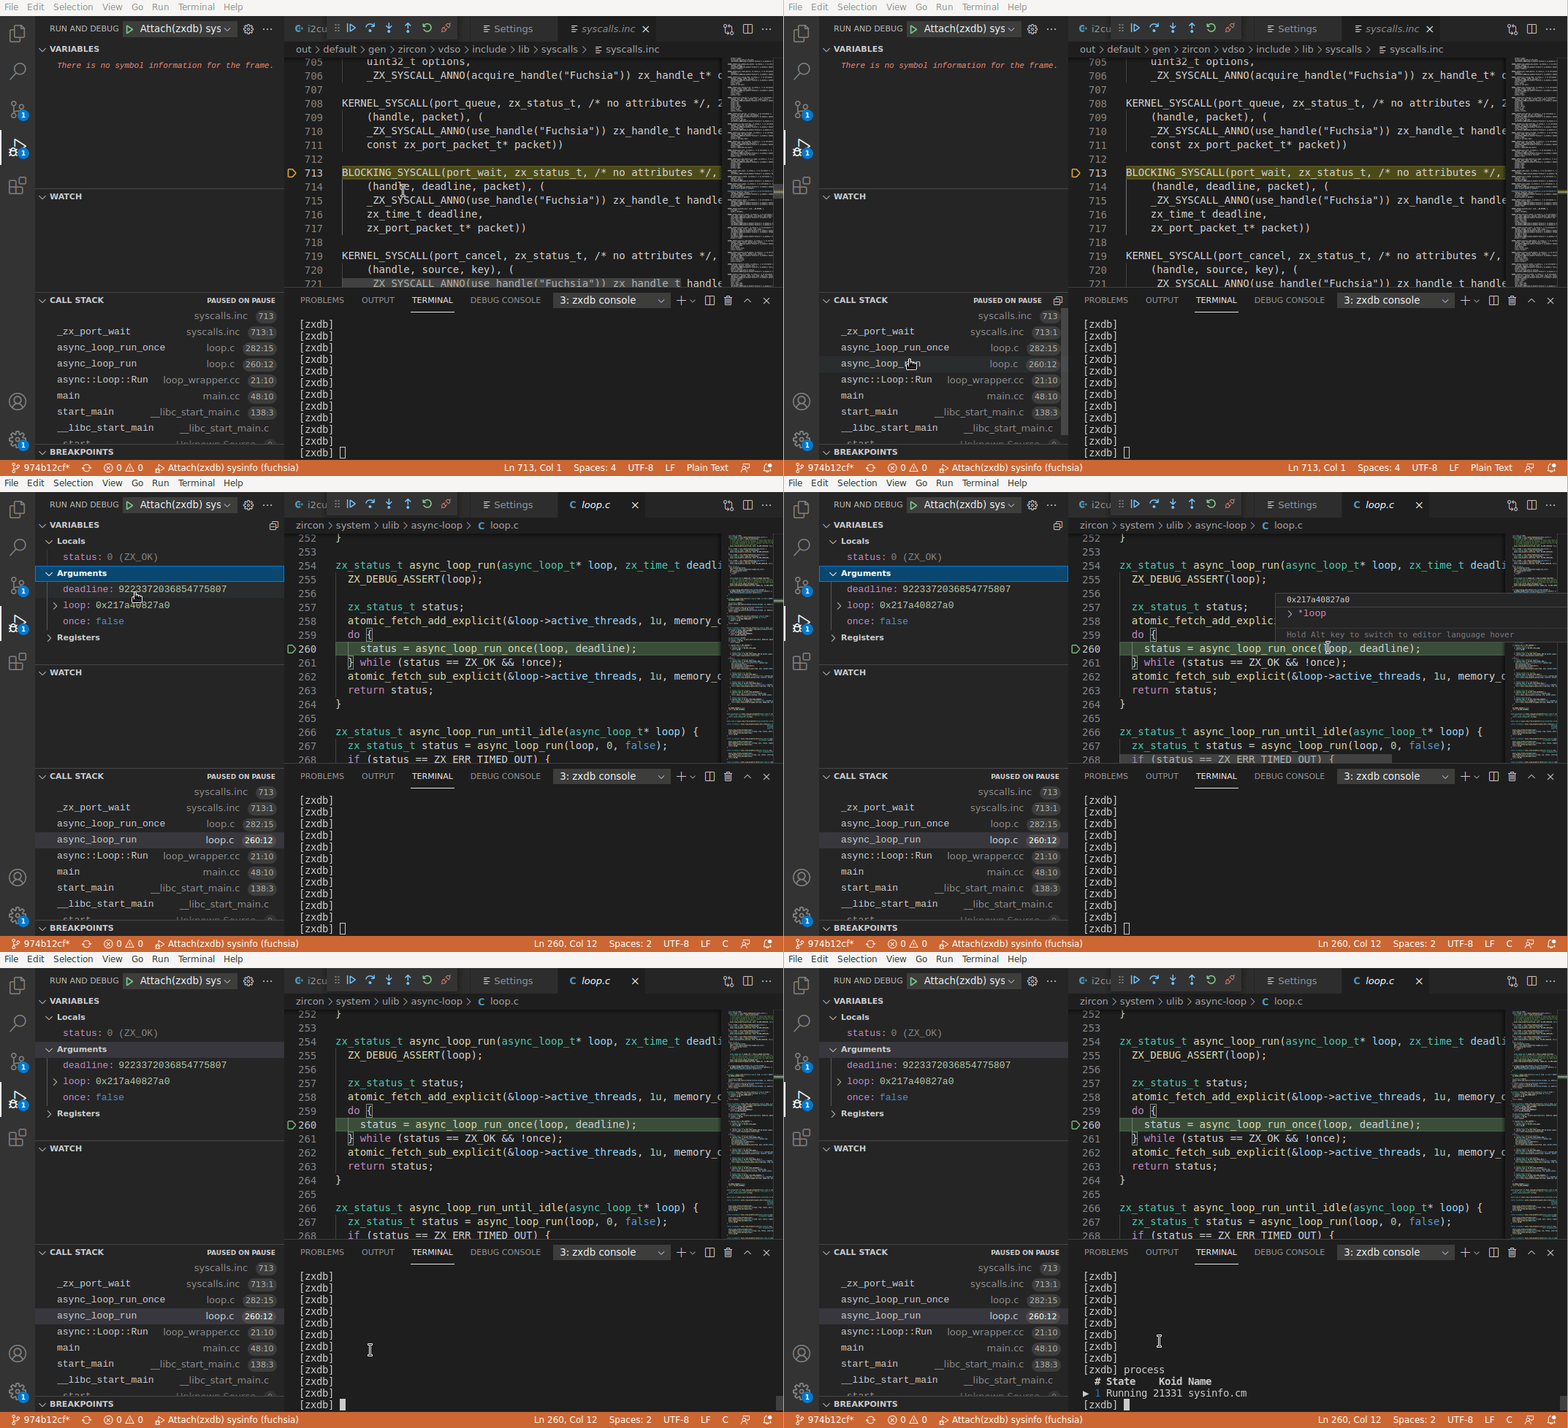
- One click debugging - Press F5 to start debugging on Fuchsia devices.
- Launch or Attach to a process from VS Code.
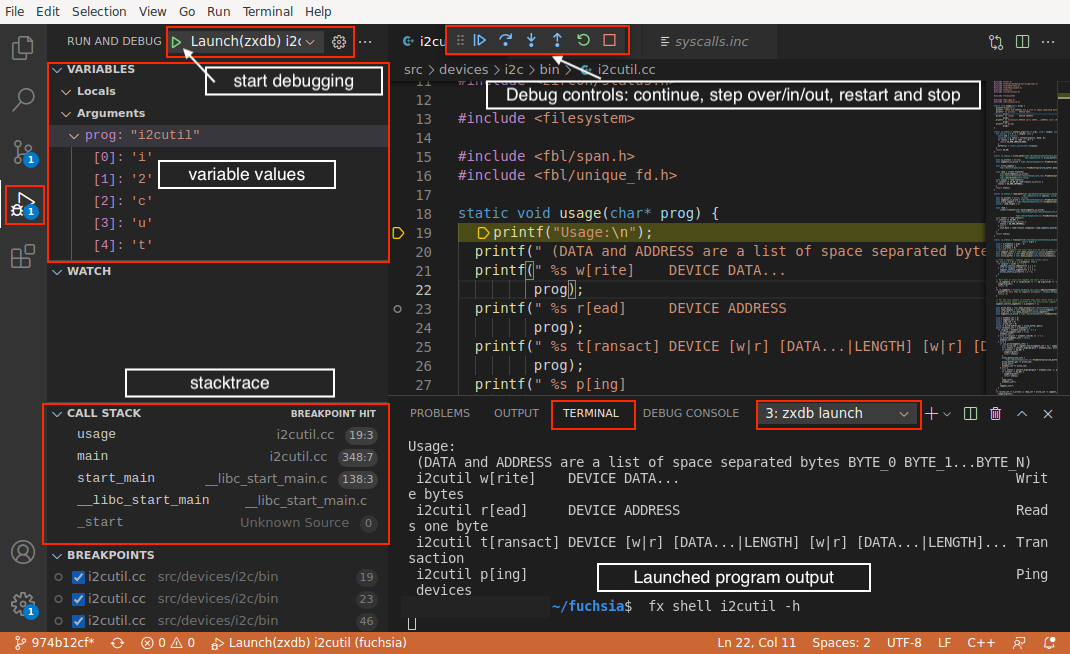
- zxdb console is parallely accessible in the integrated terminal.
- Works with VS Code Remote.
- Breakpoints, Exceptions, Stacktraces, Local Variables, Registers, Debug Hover
- Pause/Resume, Step In/Step Out/Step Over, Restart
- If you don’t have the fuchsia source tree, see the Fuchsia setup guide.
- If this is the first time using zxdb, see the zxdb setup guide.
- If this is the first time using VS Code, see VS Code setup for Fuchsia.
-
Step 0: Open VS Code application and install zxdb extension from marketplace (Click View then Extensions and search for zxdb, select zxdb and click on install).
-
Step 1: Make sure that the target device is running fuchsia and the package server (like
fx serve) has started on the development host. Make sure to have installed the zxdb extension from VS Code marketplace. -
Step 2: Open VS Code application. Open the Fuchsia source directory (Click File then Open.. or Open Folder.. then select the Fuchsia directory).
-
Step 3: Open the source code of the program you want to debug and add breakpoints by clicking on the editor margin or using F9 on the current line.
-
Step 4: Add a launch configuration (Click Run then Add Configuration, if there is a drop down select zxdb). Update fields marked as TODO in the launch.json. You only need to do this step whenever you want to update the configuration. See this section for more launch options.
-
Step 5: Start debugging (press F5 or Play button). See this guide to learn about VS Code debugger.
See troubleshooting guide if you face any issues.
VS Code keeps debugging configuration information in a launch.json file located in a .vscode
folder in your workspace (project root folder) or in your
user settings or
workspace settings.
In Step 4 of Quick Start, this file is created automatically if it doesn’t
already exist.
You can add as many launch configurations as you need and pick one before starting to debug.
Follow these steps to update your launch configuration:
-
Click Run then Open Configuration to open launch configuration.
-
To add new configurations, Click Run then Add Configuration and scroll down to zxdb configuration snippets (Hint: type zxdb to get there faster).
-
Pick a configuration that matches your workflow.
-
Launch configurations: Use this if you want to use VS Code to both launch and debug the program.
Required fields:
-
Launch command: Shell command to launch the program.
Example launch commands: fx test -o hello-world-test, fx shell i2cutil, fx run hello-world
-
Process name: Name of the process that will be started by the launch command.
Example process name: hello-world-test, hello-world (partial names are also valid)
-
-
Attach configurations: Use this if you want to use VS Code only for debugging. You need to launch the program manually.
Required fields:
- Process name: Name of the process to debug.
An example launch configuration file can be found here
-
-
Save the
launch.json. The configuration names would appear in the launch configuration dropdown. -
Select the required configuration from the dropdown and start debugging.
Tip: Launch configuration can be quickly accessed by clicking on the gear button as shown below -
Note: Launch(zxdb) Input box / Attach(zxdb) Input box configurations allow you to enter the customizable fields into a pop-up input box during every run just before the debugger starts. Use this as a generic configuration. However, inputs will not be saved and need to be entered in every run, which could be a compelling reason to update
launch.jsonmanually as described above.
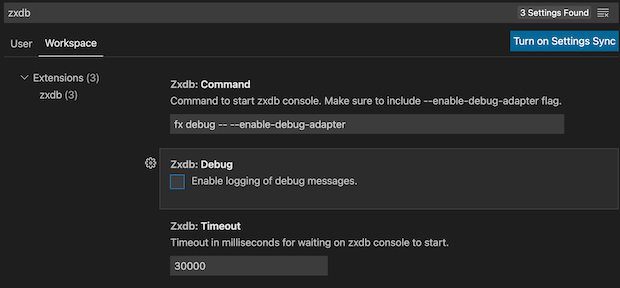
To configure the extension, open settings (Ctrl/Cmd + Shift + P and type
Preferences: Open Settings(UI)). Type zxdb in the search bar to view and update the zxdb
extension configurations. After changing any of these configurations reload the VS Code window
(Ctrl/Cmd + Shift + P and type Reload Window) for it to take effect.
Please report issues/feedback here.
Please collect logs by following these steps to append to the report:
- For verbose logs, set
zxdb.debug: trueas described in the this section. - Go to the output panel (Click View then Output)
- From the dropdown in the top right of that panel select zxdb.
- Copy all the logs (Click anywhere in the output panel, then press
Ctrl/Cmd + Afollowed byCtrl/Cmd + C). Paste the logs to a text file and attach it to the bug report.
See the CHANGELOG


