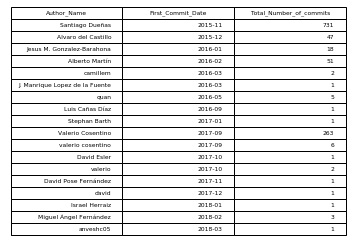
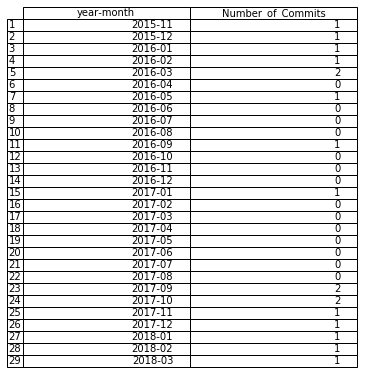
Produce a listing of the number of new committers per month, and the number of commits for each of them, as a table and as a CSV file. Use the GrimoireLab enriched index for git.
Solution :- The code is in the MicroTask-1 directory . It contains CSV, JGP files of the output as well.
Data Retrival :- Data retirval can be done by two ways . Both the codes are in the MicroTask-1 directory.
-
By
p2o.pyuploading the data to ElasticSearch . and then using the ElasticSearch API's to access the data in the indices . Thep2o.pycan be run through terminal or in the code itself ( throughsubprocess Library) -
By creating indices through ElasticSearch and uploading it through the code.
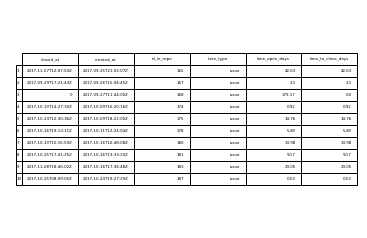
Produce a chart showing the distribution of time-to-close (using the corresponding field in the GrimoireLab enriched index for GitHub issues) for issues already closed, and opened during the last six months.
Solution :- The code is in the MicroTask-2 directory . It contains CSV, JGP files of the output as well.
Data Retrival :- We Upload the data through p20.py on our localhost instance. Data Retrival is then done through the ElasticSearch/ElasticSearch_DSL API'S .
Produce a listing of repositories, as a table and as CSV file, with the number of commits authored, issues opened, and pull requests opened, during the last three months, ordered by the total number (commits plus issues plus pull requests).
- Make sure you have your LocalHost instance () ON .
- Install all the necessary dependencies . Check this Link for further instruction for installation.


