The Google BigQuery data source plugin allows you to query and visualize Google BigQuery data from within Grafana.
-
Navigate to BigQuery plugin homepage.
-
From the left-hand menu, click the Install plugin button.
The Installation tab is displayed.
- In Grafana, navigate to Configuration > Data sources.
- From the top-right corner, click the Add data source button.
- Search for Google BigQuery in the search field, and hover over the Google BigQuery search result.
- Click the Select button for Google BigQuery. If you can click the Select button, then it is installed.
Follow these instructions to add a new Google BigQuery data source, and enter configuration options:
The following Google APIs need to be enabled for the plugin to work:
Google BigQuery datasource provides two ways of authentication:
- By uploading Google Service Account key
- By automatically retrieving credentials from the Google Metadata Server (only available when running Grafana on a GCE virtual machine)
Create a Google Cloud Platform (GCP) Service Account. The BigQuery Data Viewer role and the Job User role provide all the permissions that Grafana needs.
When Grafana is running on a Google Compute Engine (GCE) virtual machine, it is possible for the Google BigQuery datasource to automatically retrieve the default project id and authentication token from the metadata server. For this to work, you need to make sure that you have a service account that is setup as the default account for the virtual machine and that the service account has been given read access to the BigQuery API.
It is possible to configure data sources using configuration files with Grafana’s provisioning system. To read about how it works, including and all the settings that you can set for this data source, refer to Provisioning Grafana data sources.
Below you will find some provisioning examples
# config file version (with private key in secureJsonData)
apiVersion: 1
datasources:
  - name: BigQuery DS
    type: grafana-bigquery-datasource
    editable: true
    enabled: true
    jsonData:
      authenticationType: jwt
      clientEmail: your-client-email
      defaultProject: your-default-bigquery-project
      tokenUri: https://oauth2.googleapis.com/token
    secureJsonData:
      privateKey: your-private-key
# config file version (with private key path in jsonData)
apiVersion: 1
datasources:
- name: BigQuery DS
type: grafana-bigquery-datasource
editable: true
enabled: true
jsonData:
authenticationType: jwt
clientEmail: your-client-email
defaultProject: your-default-bigquery-project
tokenUri: https://oauth2.googleapis.com/token
privateKeyPath: '/etc/secrets/bigquery.pem'# config file version
apiVersion: 1
datasources:
- name: BigQuery DS
type: grafana-bigquery-datasource
editable: true
enabled: true
jsonData:
authenticationType: gceFor everyone using Grafana 8.5+, it’s possible to import queries created with the DoiT International BigQuery community plugin by simply changing the data source to Grafana BigQuery. Please note that queries will be imported as raw SQL queries.
The query editor allows you to query Google BigQuery datasource. Queries can contain macros which simplify syntax and allow for dynamic parts.
SQL query editor comes with a rich support for standard SQL as well as verbose autocompletion for:
- BigQuery standard SQL language syntax.
- BigQuery datasets, tables and columns.
- Macros and template variables.
SQL query editor also supports query validation and code formatting.
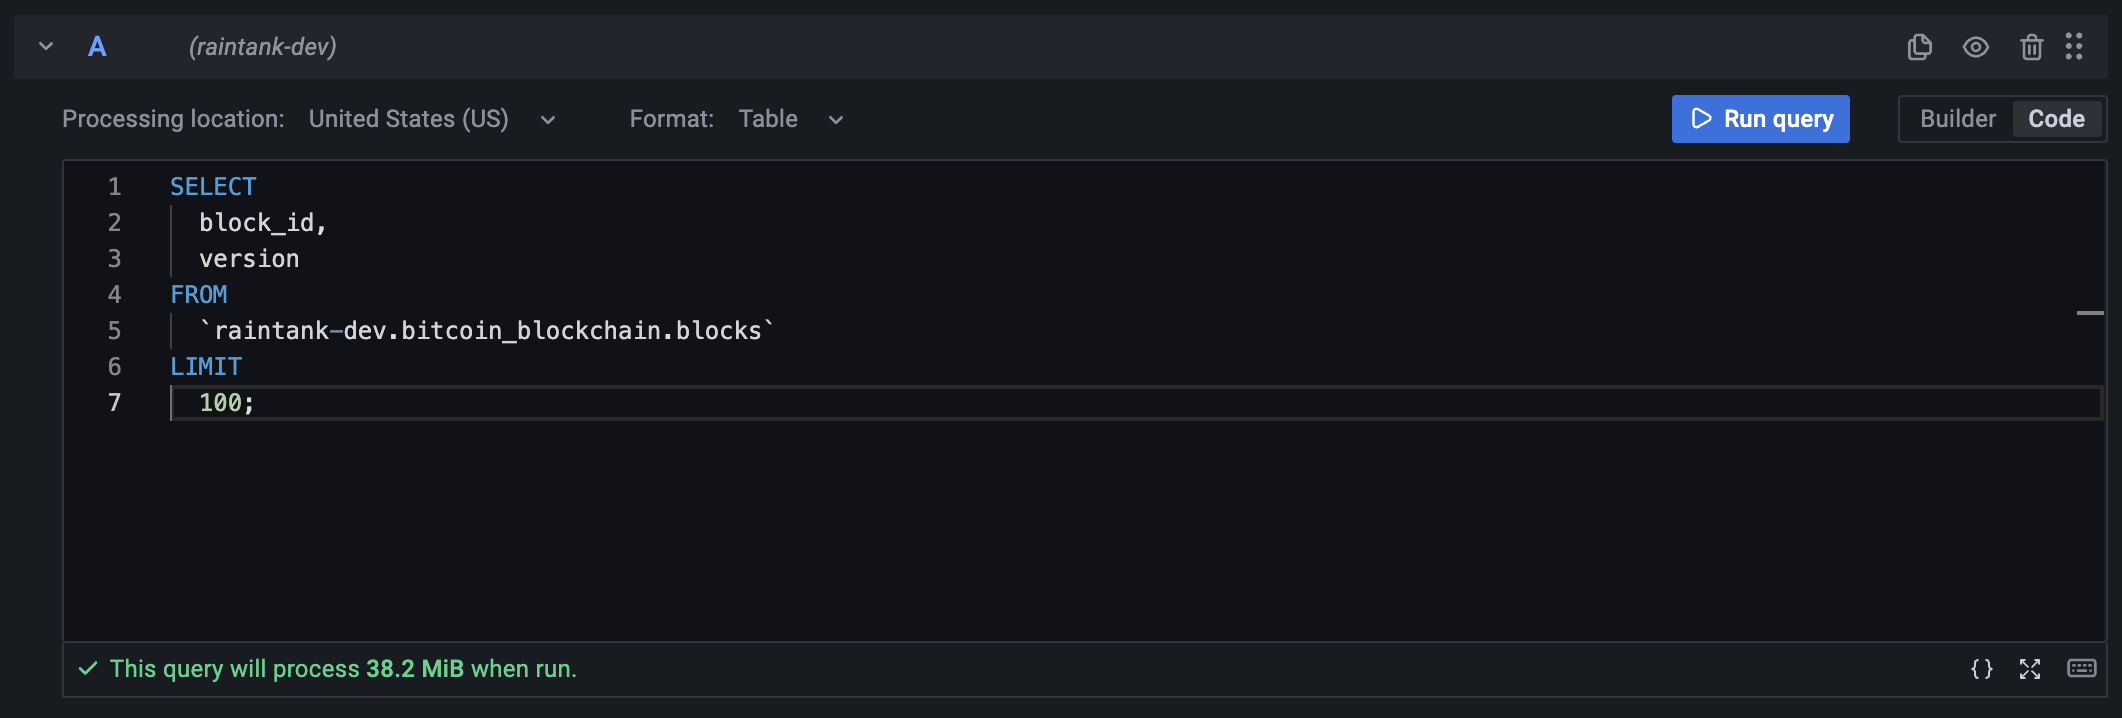
SQL query editor validates the query providing you with a meaningful information about what's wrong with the query. If the query is valid, an estimated query size is shown.
SQL query editor allows editing the query in a full screen code editor making it easy to work with long queries:
CMD/Ctrl + Return- Run query
Visual query editor allows creating simple BigQuery queries without SQL knowledge. It comes with basic aggregations support, filtering, grouping, ordering and raw query preview. Similar to SQL query editor, the Visual query editor also validates your query as it's being created.
Time series visualization options are selectable after adding TIMESTAMP field to your query. This field will be used as the timestamp. You can select time series visualization using the visualization options. Grafana interprets timestamp rows without explicit time zone as UTC. Any column except time is treated as a value column.
Table visualizations will always be available for any valid Google BigQuery query.
To simplify syntax and to allow for dynamic parts, like date range filters, the query can contain macros.
Here is an example of a query with a macro that will use Grafana's time filter:
SELECT
      time_column,
      value_column,
FROM `project.dataset.table`
WHERE $__timeFilter(time_column)| Macro example | Description |
|---|---|
| $__timeFilter(timeColumn) | Will be replaced by a time range filter using the specified name. |
| $__timeGroup(timeColumn,interval) | Will be replaced by an expression usable in the GROUP BY clause. |
To add a new Google BigQuery query variable, refer to Add a query variable.
After creating a variable, you can use it in your Google BigQuery queries by using Variable syntax. For more information about variables, refer to Templates and variables.
- Add Annotations.
- Configure and use Templates and variables.
- Add Transformations.
- Set up alerting; refer to Alerts overview.