Warning
The xk6-output-prometheus-remote extension has been merged to the main k6 repository. Please contribute and open issues there. This repository is no longer maintained.
The xk6-output-prometheus-remote extension allows you to publish test-run metrics to Prometheus via Remote Write endpoint.
⚠️ Be careful not to confuse this with the Prometheus Remote Write client extension which is used for load and performance testing of Prometheus itself.
As of k6 v0.42.0, this extension is available within k6 as an experimental module. For further details, read the extension graduation guide.
Consult the Prometheus remote write guide in the k6 docs to explore the various methods and options for sending k6 metrics to a Prometheus remote-write endpoint.
For developing or testing this extension, you can build a k6 binary with the local extension using xk6 with the following steps:
xk6 build --with github.com/grafana/xk6-output-prometheus-remote=. For more details, refer to the k6 docs:
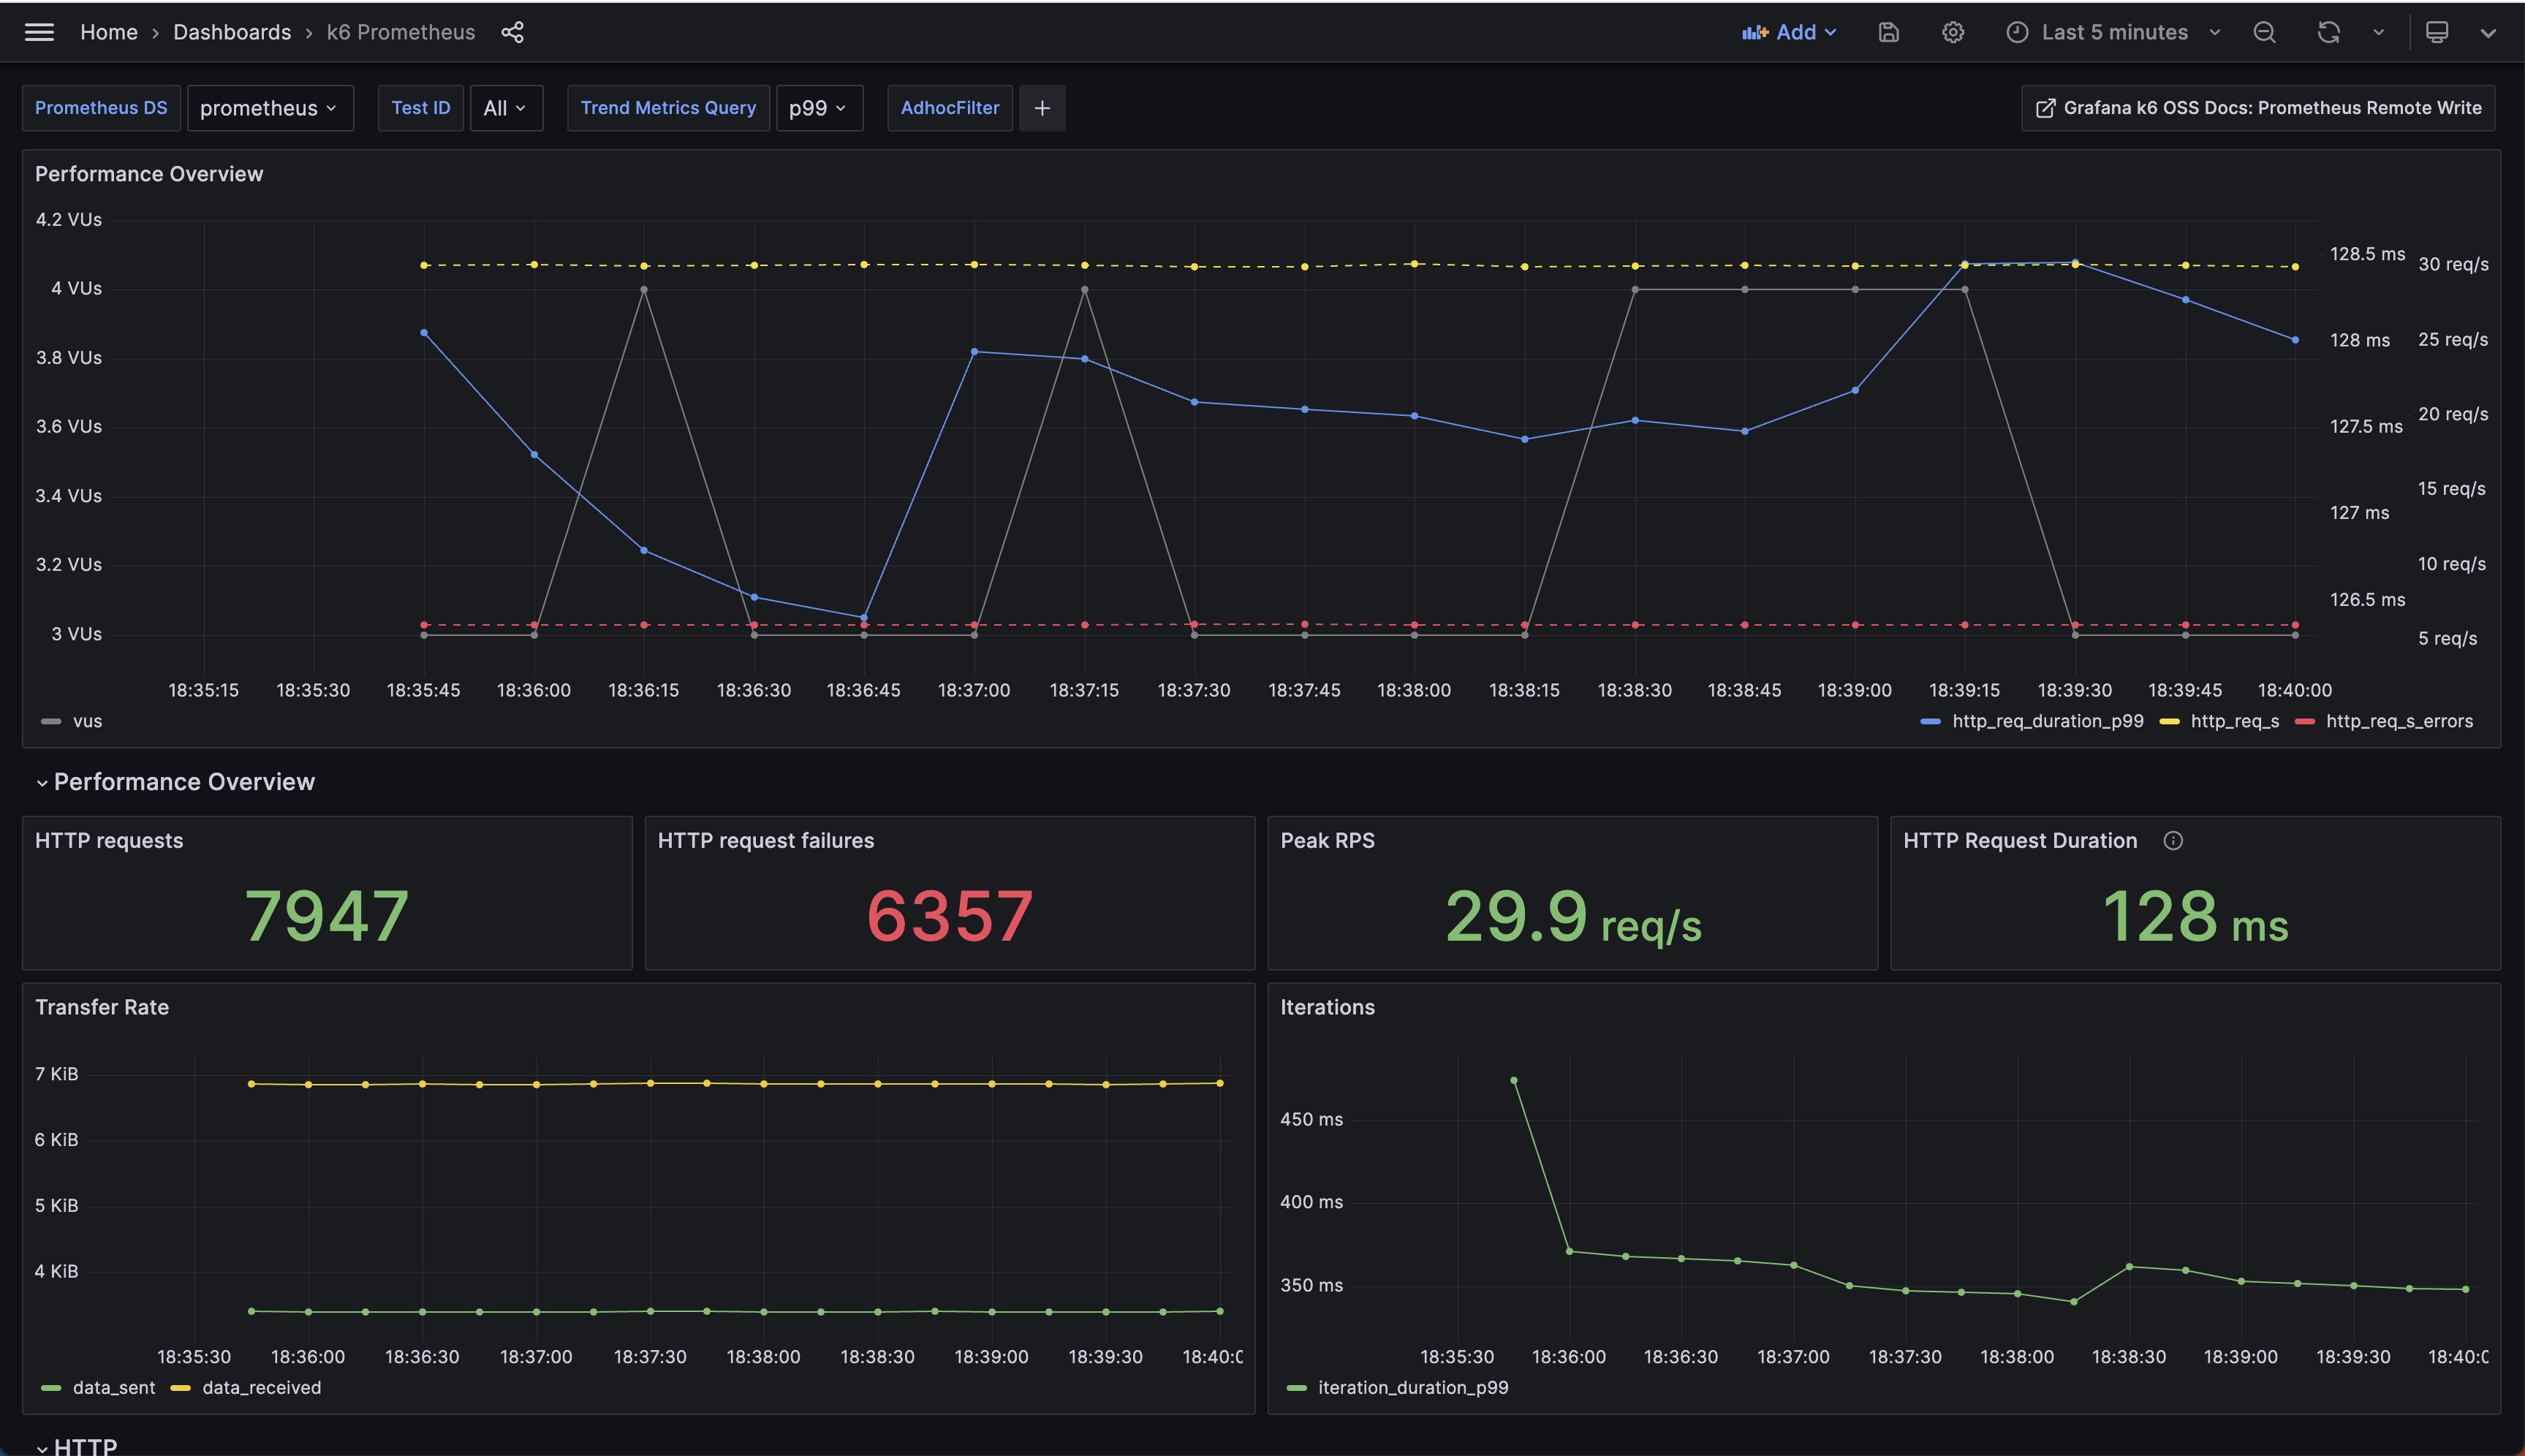
This repo contains the source code of two Grafana dashboards designed to visualize test results: k6 Prometheus and k6 Prometheus (Native Histograms).
Visit the documentation to learn more about these dashboards. You can import them to your Grafana instance or with the docker-compose example on this repo.
🌟 Special thanks to jwcastillo for his contributions and dedication to improving the dashboards.
