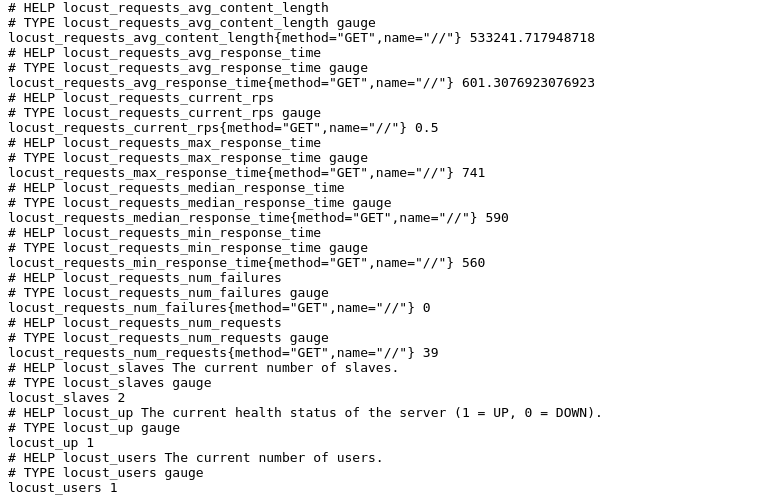
Prometheus exporter for Locust. This exporter was inspired by mbolek/locust_exporter.
This package is available for Docker:
-
Run Locust (example docker-compose)
-
Run Locust Exporter
docker run --net=host containersol/locust_exporterThe default way to build is:
go get github.com/ContainerSolutions/locust_exporter
cd ${GOPATH-$HOME/go}/src/github.com/ContainerSolutions/locust_exporter/
go run main.go-
locust.uriAddress of Locust. Default ishttp://localhost:8089. -
locust.timeoutTimeout request to Locust. Default is5s. -
web.listen-addressAddress to listen on for web interface and telemetry. Default is:9646. -
web.telemetry-pathPath under which to expose metrics. Default is/metrics. -
log.levelSet logging level: one ofdebug,info,warn,error,fatal -
log.formatSet the log output target and format. e.g.logger:syslog?appname=bob&local=7orlogger:stdout?json=trueDefaults tologger:stderr.
The following environment variables configure the exporter:
-
LOCUST_EXPORTER_URIAddress of Locust. Default ishttp://localhost:8089. -
LOCUST_EXPORTER_TIMEOUTTimeout reqeust to Locust. Default is5s. -
LOCUST_EXPORTER_WEB_LISTEN_ADDRESSAddress to listen on for web interface and telemetry. Default is:9646. -
LOCUST_EXPORTER_WEB_TELEMETRY_PATHPath under which to expose metrics. Default is/metrics.
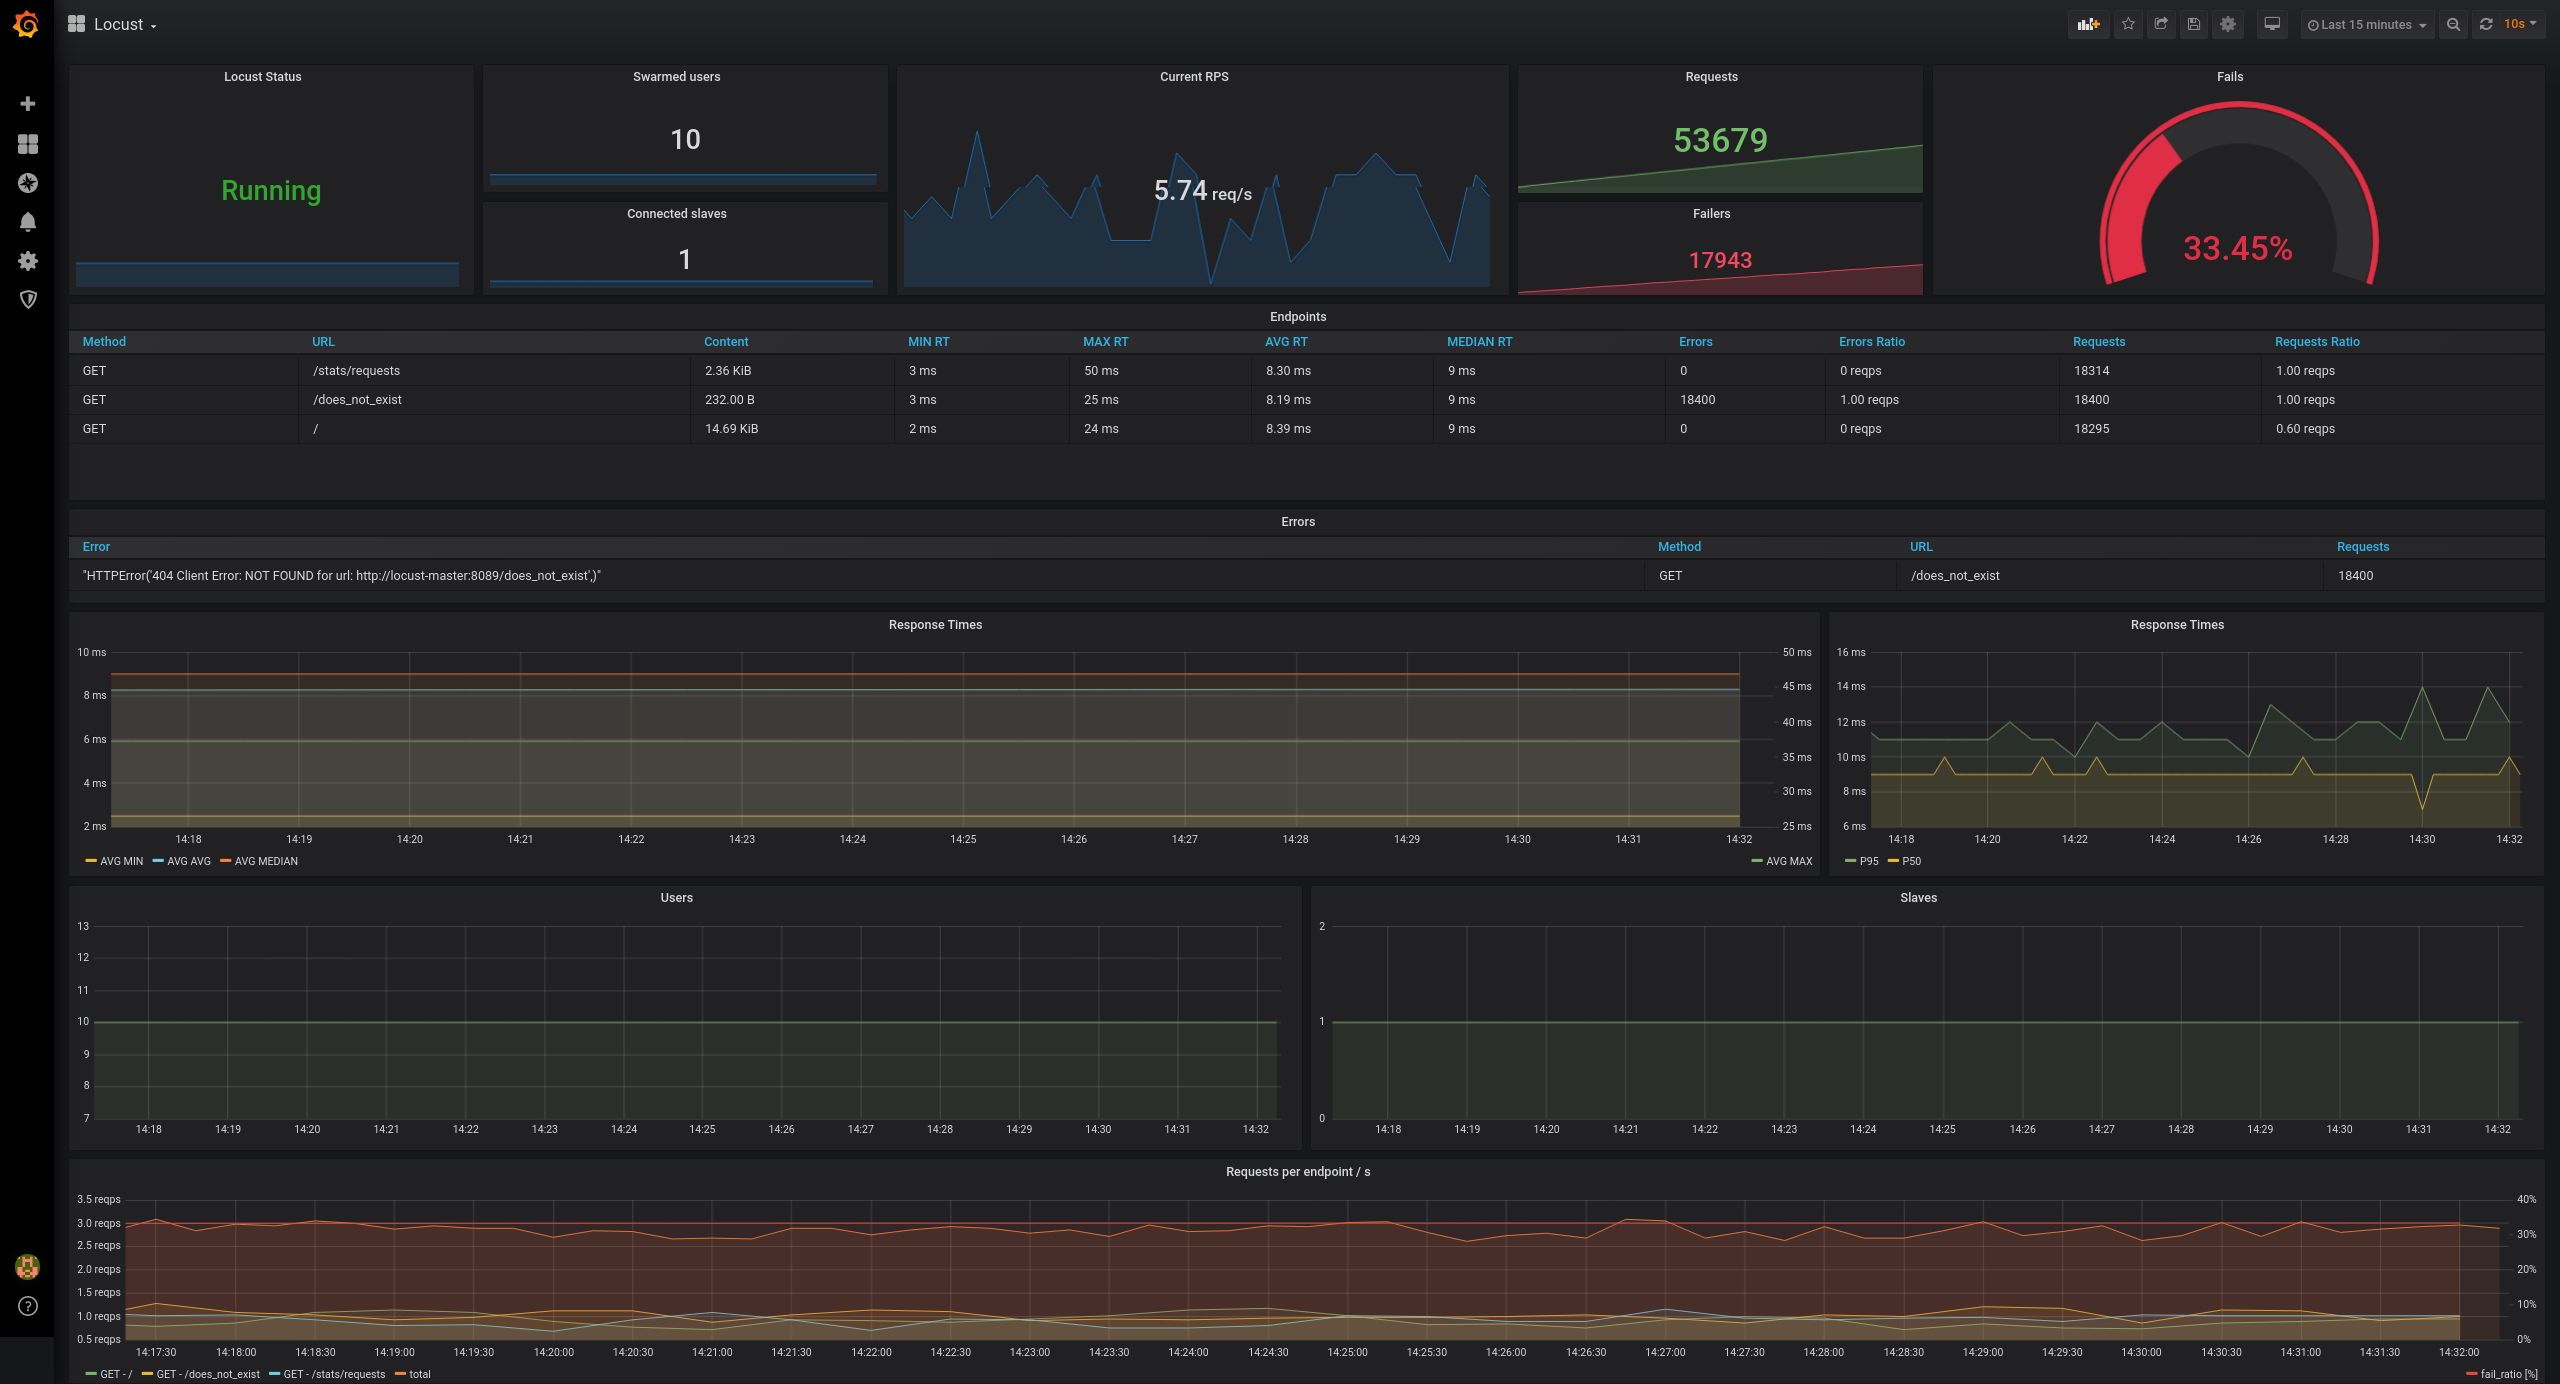
The grafana dashboard has beed published with ID 11985 and was exported to locust_dashboard.json.
Please see CHANGELOG for more information on what has changed recently.
Please see CONTRIBUTING for details.
Apache License. Please see License File for more information.


