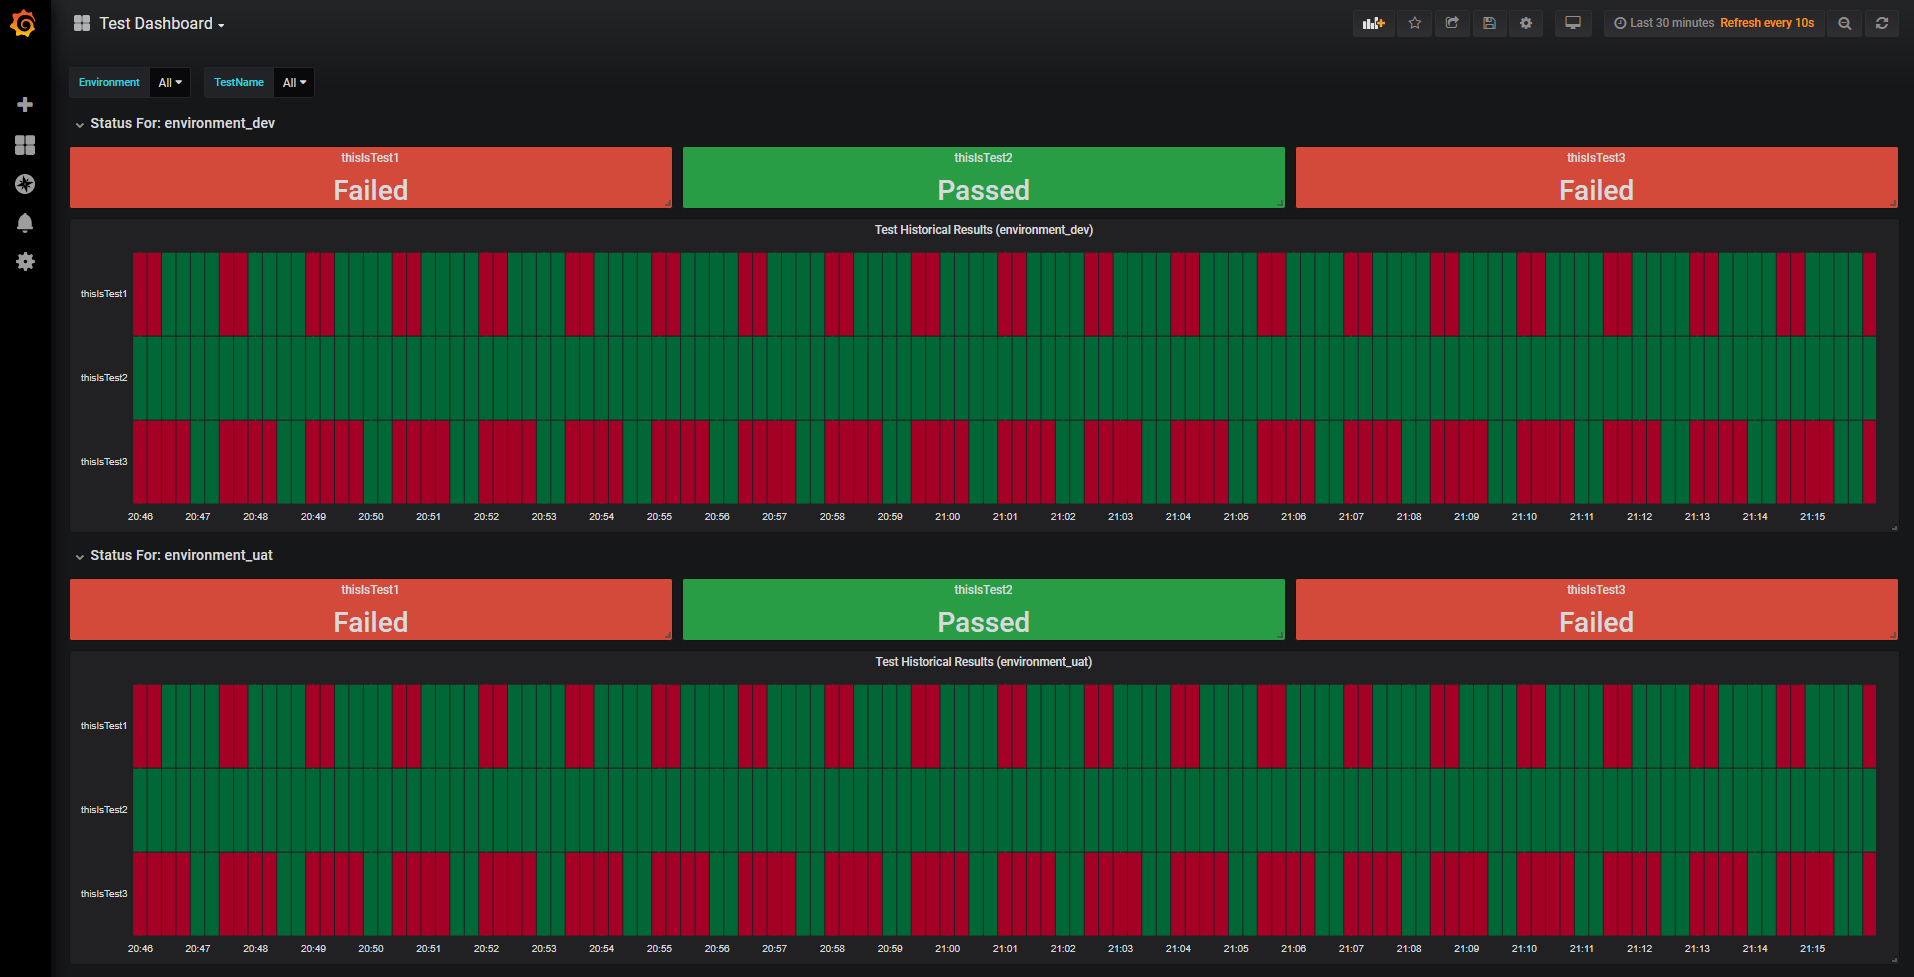
An end-to-end example of Grafana, Prometheus and Push Gateway working together using docker-compose.yml and precanned Dashboards.
This contrived example will simulate pushing fake test results from two environments to Push Gateway. Those metrics are scraped by Prometheus and rendered by Grafana.
The resulting Dashboard shows the current status of the metric and a historical status:
To start the pre-configured containers:
docker-compose up
Run the seed script to start generating data:
PowerShell -File .\Seed.ps1
Wait 2-3 minutes and navigate to the Test Dashboard in Grafana (http://localhost:5000). You will start to see information coming through.
The following services will be started and are preconfigured in the following way - navigate to each URL to confirm the service is active:
| Service | Description | URI |
|---|---|---|
| Grafana | A Dashboard is included showing Pass/Fail; and historical trends. The graphs are rendered by connecting to the Prometheus Data Source | http://localhost:5000 |
| Prometheus | The configuration has been augmented to scrape Push Gateway as a source and can be found in prometheus/prometheus.yml | http://localhost:9090 |
| Push Gateway | The various Seed scripts will write directly to this endpoint to publish Metrics. The Metrics pushed here will be scraped by Prometheus. | http://localhost:9091 |
The sample Seed Script (PowerShell) will send data to Push Gateway which will then be scraped by Prometheus and finally rendered in Grafana. I chose to do this rather than injecting data into the DB. The seed script will run continuously until stopped, constantly cycling the Pass/Fail rate to help simulate a varying dataset. You will see Grafana update every 15 seconds with the new state(s).
To run the Seed Script:
PowerShell -File .\Seed.ps1
To see the difference between the current time and the last time a metric was pushed, use something like the following Prometheus Query:
time() - push_time_seconds{instance="${Environment}"}
| Description | Link |
|---|---|
| How to configure Grafana with Predefined Dashboards (and Datasources) | https://ops.tips/blog/initialize-grafana-with-preconfigured-dashboards/ |
| Bootstrapping GPP (a bit out of date, but got me up and running quickly) | https://github.com/cirocosta/sample-grafana |
| Alerting on 'stale' Pushgateway metrics | https://github.com/prometheus/pushgateway/blob/master/README.md |
