Experimental repository with data analytics models, pipelines for Jaeger tracing data.
Repository contains:
- Graph trace DSL based on Apache Gremlin. It helps to write graph "queries" against a trace
- Spark streaming integration with Kafka for Jaeger topics
- Loading trace from Jaeger query service
- Jupyter notebooks to run examples with data analytic models
- Data analytics models, metrics based on tracing data
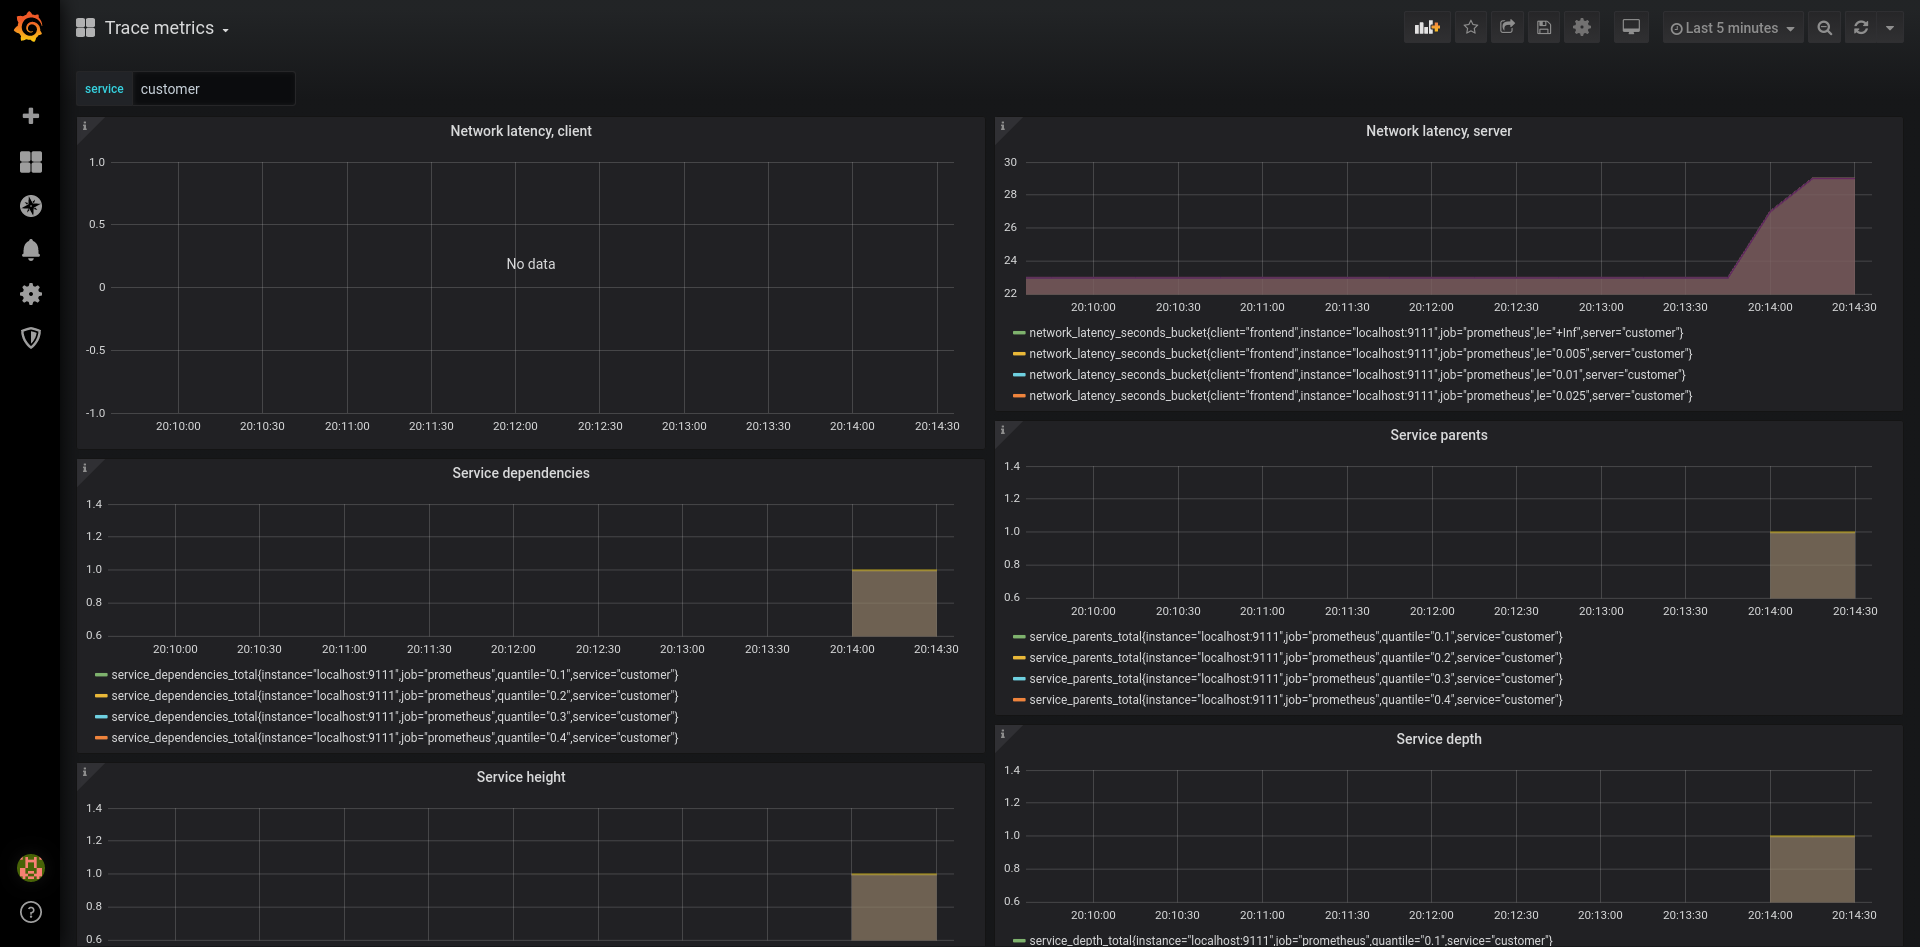
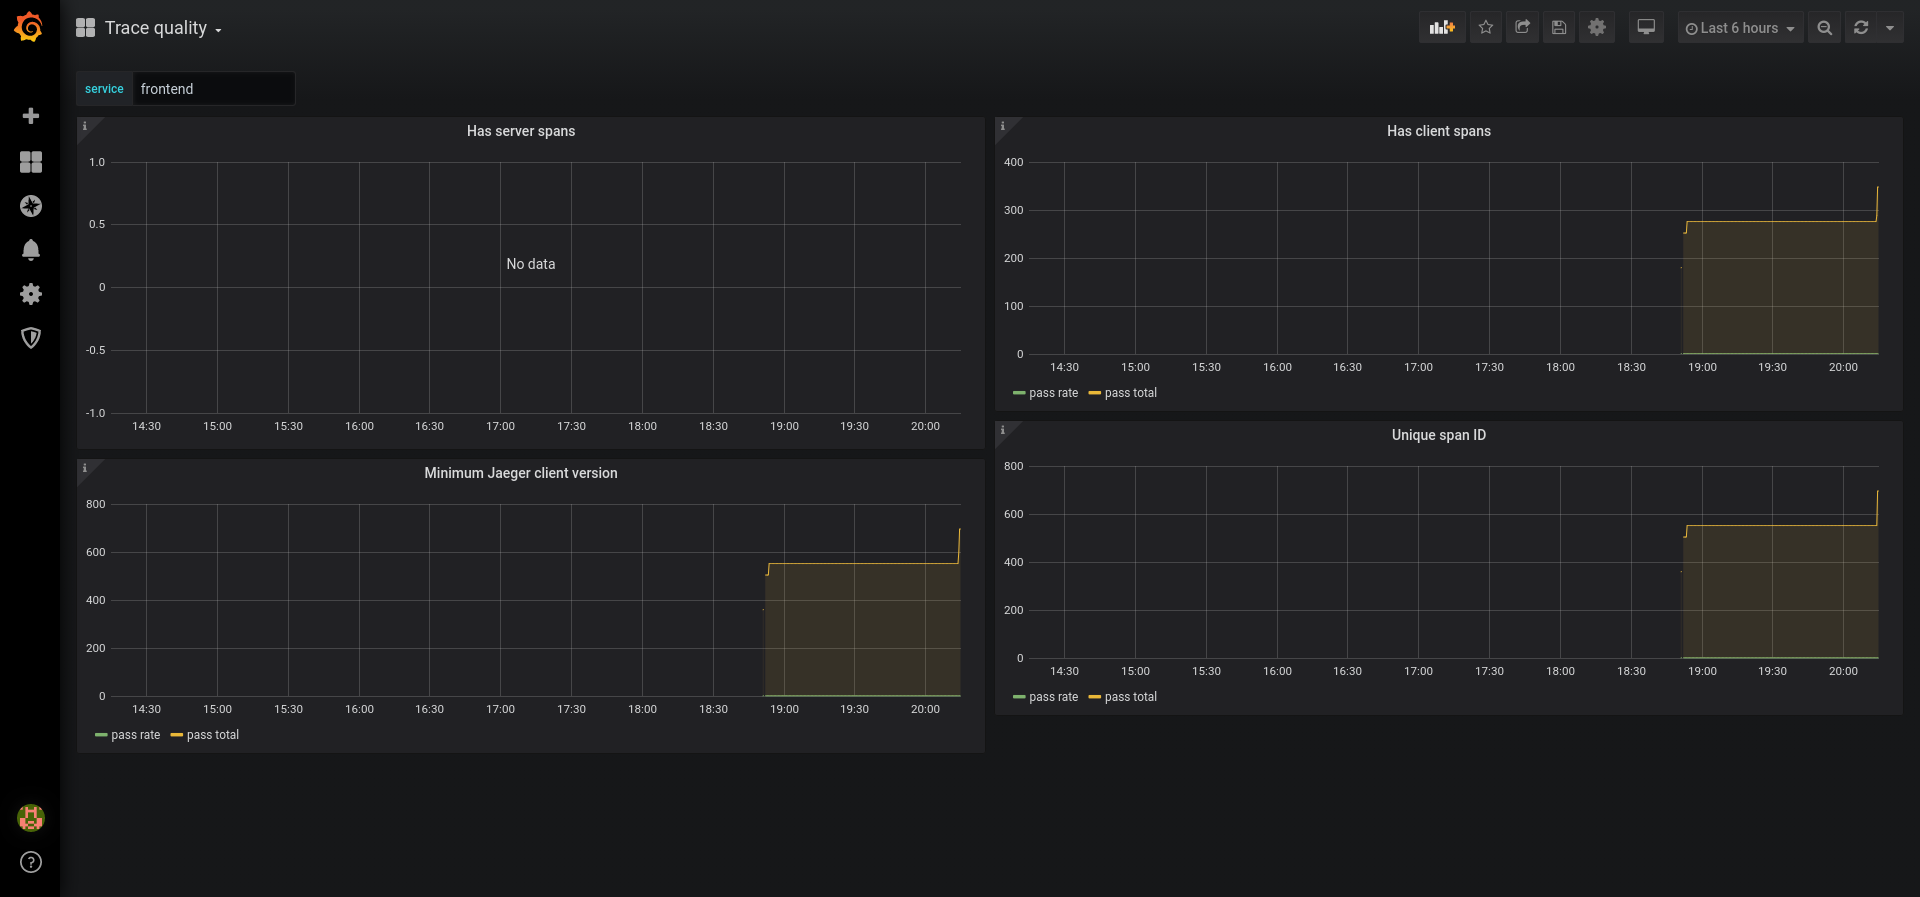
- Grafana dashboards
Blog posts, demos and conference talks:
The library calculates various metrics from traces. The metrics are currently exposed in Prometheus format.
Currently these metrics are calculated:
- Trace height - trace tree height. Maximum number of spans from root to leaf
- Service depth - number of service hops from a service to the root service
- Service height - number of service hops from a service to the leaf service
- Service's direct downstream dependencies - number services a service directly calls
- Service's direct upstream parents - number of services directly calling a service
- Number of errors - number of errors per service
- Network latency - latency between client and server spans split by service names
network_latency_seconds_bucket{client="frontend",server="driver",le="0.005",} 32.0
network_latency_seconds_bucket{client="frontend",server="driver",le="0.01",} 32.0
network_latency_seconds_bucket{client="frontend",server="driver",le="0.025",} 32.0
service_height_total{quantile="0.7",} 2.0
Trace quality metrics measure the quality of tracing data reported by services. These metrics can indicate that further instrumentation is needed or the instrumentation quality is not high enough.
These metrics are ported from jaeger-analytics-flink/tracequality. The original design stores results in separate storage table (Cassandra). The intention here is to export results as metrics and link relevant traces as exemplars (once OSS metrics APIs support that).
- Minimum Jaeger client version - minimum Jaeger client version
- Has client and server tags - span contains client or server tags
- Unique span IDs - trace contains spans with unique span IDs
trace_quality_server_tag_total{pass="false",service="mysql",} 32.0
trace_quality_server_tag_total{pass="true",service="customer",} 26.0
trace_quality_minimum_client_version_total{pass="false",service="route",version="Go-2.21.1",} 320.0
Example Prometheus queries:
(trace_quality_server_tag_total{pass="true",service="customer",} / trace_quality_server_tag_total{service="customer",}) * 100
trace_quality_server_tag_total{pass="true",service="customer",} / ignoring (pass,fail) sum without(pass, fail) (trace_quality_server_tag_total)
// if values are missing
(trace_quality_server_tag_total{pass="true",service="mysql",}  / trace_quality_server_tag_total{service="mysql",} ) * 100 or vector(0)
Add annotation processor is needed for IDE configuration. It is used to generate trace DSL.
org.apache.tinkerpop.gremlin.process.traversal.dsl.GremlinDslProcessor
Build and run
mvn clean compile exec:javaConfiguration properties for SparkRunner.
SPARK_MASTER: Spark master to submit the job to; Defaults to `local[*]SPARK_STREAMING_BATCH_DURATION: interval defines the size of the batch in milliseconds; Defaults to `5000KAFKA_JAEGER_TOPIC: Kafka topic with Jaeger spans; Defaults tojaeger-spansKAFKA_BOOTSTRAP_SERVER: Kafka bootstrap servers; Defaults tolocalhost:9092KAFKA_START_FROM_BEGINNING: Read kafka topic from the beginning; Default to truePROMETHEUS_PORT: Prometheus exporter port; Defaults to9111TRACE_QUALITY_{language}_VERSION: Minimum Jaeger client version for trace quality metric; Supported languagesjava,node,python,go; Defaults to latest client versions
- https://spark.apache.org/docs/latest/structured-streaming-kafka-integration.html
- https://spark.apache.org/docs/latest/structured-streaming-programming-guide.html
The following command creates Jaeger CR which triggers deployment of Jaeger, Kafka and Elasticsearch. This works only on OpenShift 4.x and prior deploying make sure Jaeger, Strimzi(Kafka) and Elasticsearch(from OpenShift cluster logging) operators are running.
oc create -f manifests/jaeger-auto-provisioned.yaml
If you are running on vanilla Kubernetes you can deploy jaeger-external-kafka-es.yaml CR and configure
connection strings to Kafka and Elasticsearch.
Expose Kafka IP address outside of the cluster:
listeners:
  # ...
  external:
    type: loadbalancer
    tls: false
Get external broker address:
oc get kafka simple-streaming -o jsonpath="{.status.listeners[*].addresses}"oc create route edge --service=simple-streaming-collector --port c-binary-trft --insecure-policy=Allowoc get routes # get jaeger collector route
docker run --rm -it -e "JAEGER_ENDPOINT=http://host:80/api/traces" -p 8080:8080 jaegertracing/example-hotrod:latestThe streaming job exposes metrics on http://localhost:9001.
The docker image should be published on Docker Hub. If you are modifying the source code of the library then
inject it as volume -v ${PWD}:/home/jovyan/work or rebuild the image too see the latest changes.
make jupyter-docker
make jupyter-run
Open browser on http://localhost:8888/lab and copy token from the command line. Then navigate to ./work/jupyter/ directory and open notebook.
Artifact io.jaegertracing:jaeger-testcontainers contains an implementation for using
Jaeger all-in-one docker container in JUnit tests:
JaegerAllInOne jaeger = new JaegerAllInOne("jaegertracing/all-in-one:latest");
jaeger.start();
io.opentracing.Tracer tracer = jaeger.createTracer("my-service");


