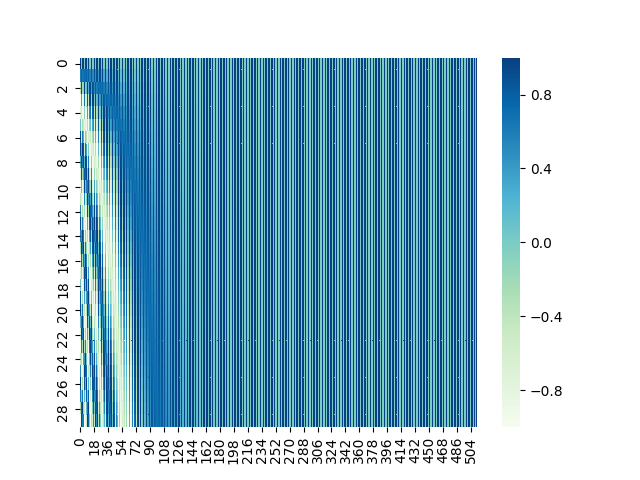
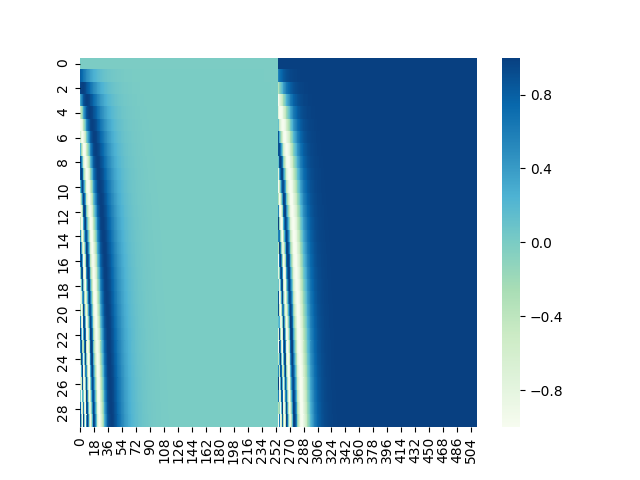
This repository is for visualizing positional encoding used in Transformer with Seaborn and Matplotlib.
Matplotlib Seaborn NumPy
-
Clone and move this repository.
git clone https://github.com/gucci-j/pe-visualization.git cd pe-visualization -
Run
main.pywith arguments.- Arguments
position: length of input tokensi: dimension of word embeddingsd_model: dimension of the Transformer model (hidden layer)
- Example
python main.py 30 512 512In this case,
positionis 30,iis 512 andd_modelis 512, respectively.
This is the same encoding mechanism as the original paper.
This is the same encoding mechanism as this blog post.

