🐢🚀
This web portal is intended to give HPC users a view of the overall use of the HPC cluster and their use. This portal uses the information collected on compute nodes and management servers to produce the information in the various modules:
Some examples of the available graphs are displayed in the documentation of each module.
This portal is made to be modular, some modules can be disabled if the data required is not needed or collected. Some modules have optional dependencies and will hide some graphs if the data is not available.
This portal also supports OpenStack, the users can see their use without having to install a monitoring agent in their VM in their OpenStack VMs.
Staff members can also see the use of any users to help them optimize their use of HPC and OpenStack clusters.
Some information collected is also available for the general public like the number of cores used, the performance of the filesystem, and the load on the login nodes. Here is an example of this portal for the Narval Cluster at Calcul Quebec
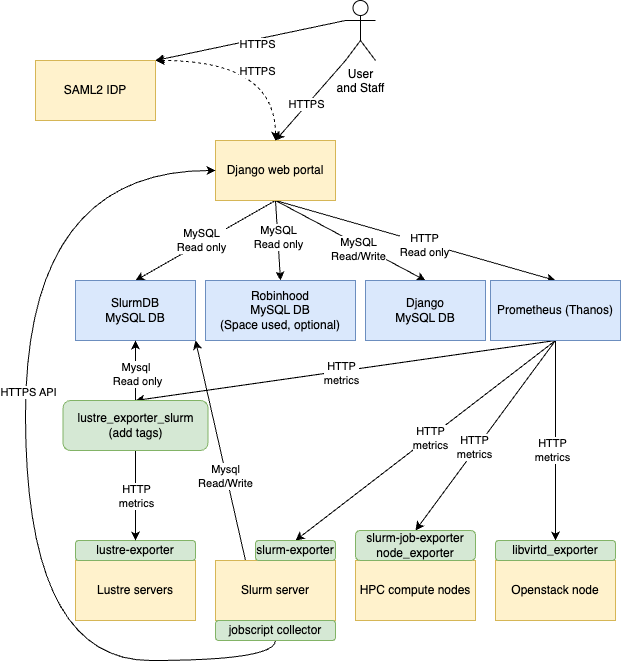
Performance metrics are stored in Prometheus, multiple exporters are used to gather this data, and most are optional.
The Django portal will also access various MySQL databases like the database of Slurm and Robinhood (if installed) to gather some information. Time series are stored with Prometheus for better performance. Compatible alternatives to Prometheus like Thanos, VictoriaMetrics, and Grafana Mimir should work without any problems (Thanos is used in production). Recorder rules in Prometheus are used to pre-aggregate some stats for the portal.
Various data sources are used to populate the content of this portal. Most of them are optional and their usefulness depends on the modules enabled in the portal. Some pre-aggregation is done using recorder rules in Prometheus. The required recorder rules are documented in the data sources documentation.
The documentation is available in the docs directory. The documentation is written in Markdown and can be read directly in the repository or on the GitHub pages.
