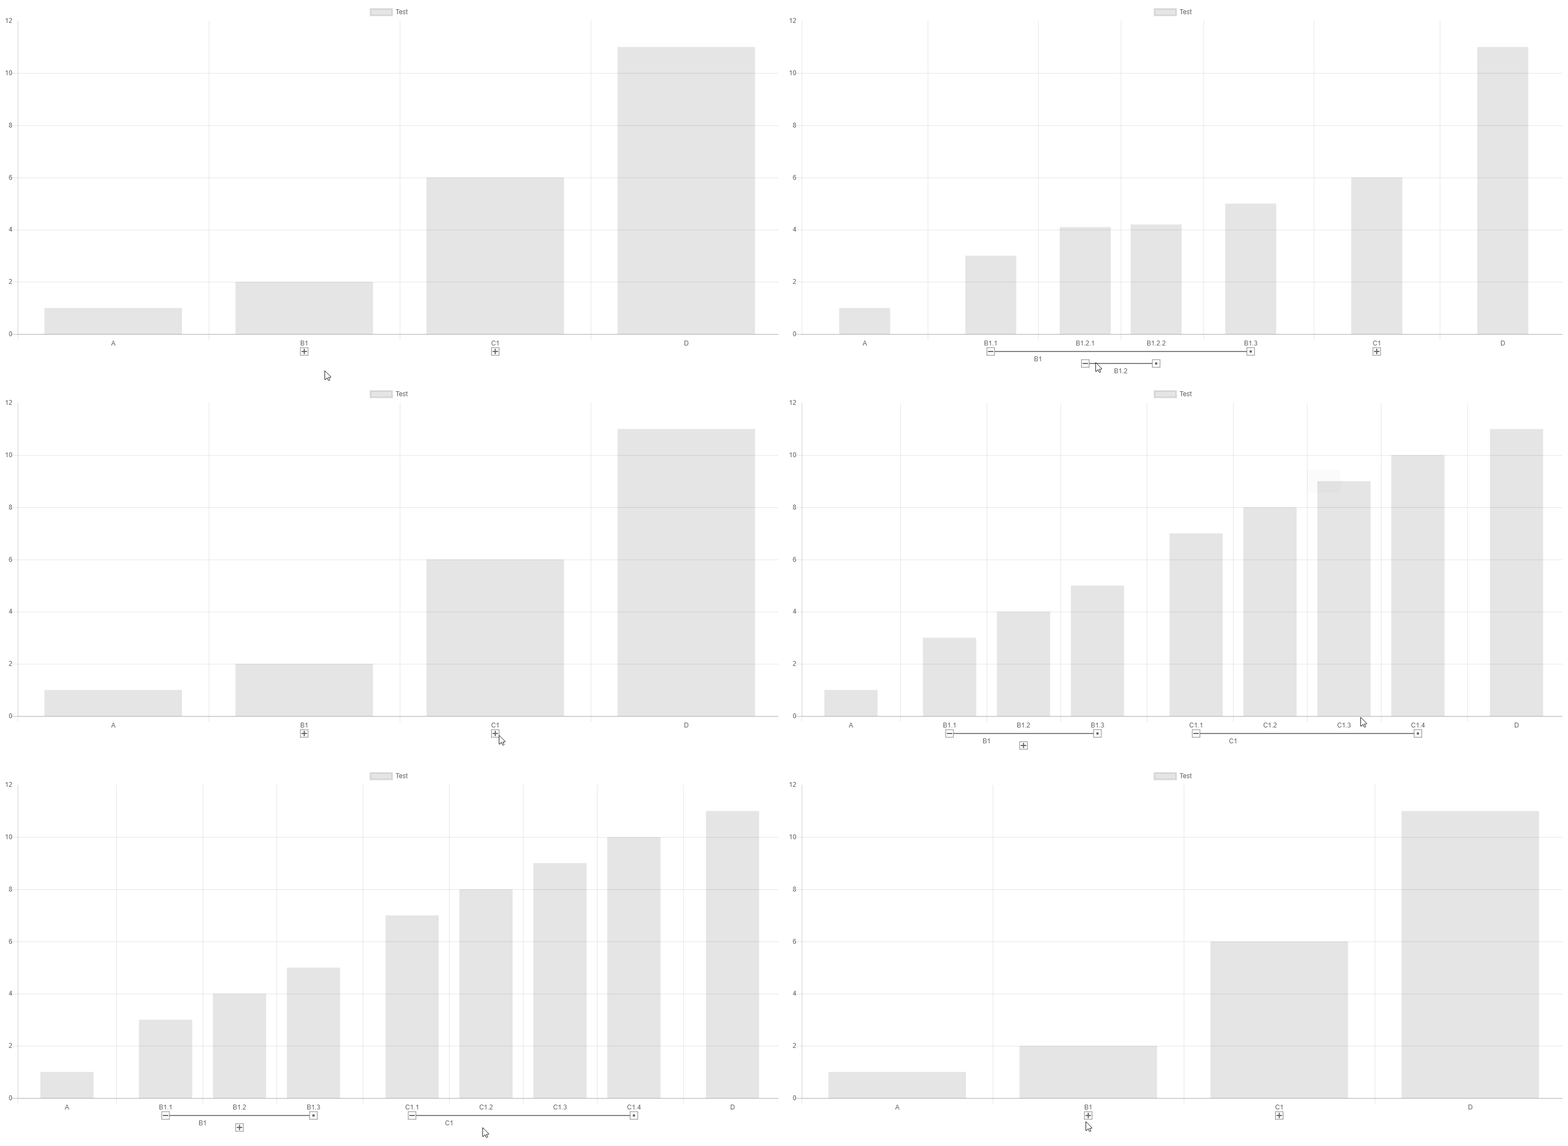
Chart.js module for adding a new categorical scale which mimics a hierarchical tree.
npm install --save chart.js chartjs-plugin-hierarchicalsee Samples on Github
or at this CodePen
a new scale type hierarchical.
The hierarchical axis scale has the following styling options
interface IHierarchicalScaleOptions {
  /**
   * ratio by which the distance between two elements shrinks the higher the level of the tree is. i.e. two two level bars have a distance of 1. two nested one just 0.75
   * @default 0.75
   */
  levelPercentage: number;
  /**
   * padding of the first collapse to the start of the x-axis
   * @default 25
   */
  padding: number;
  /**
   * position of the hierarchy label in expanded levels, null to disable
   * @default 'below'
   */
  hierarchyLabelPosition: 'below'|'above'|null;

  /**
   * object of attributes that should be managed and extacted from the tree datastrutures such as `backgroundColor` for coloring individual bars
   * the object conainst the key and default value
   * @default {}
   */
  attributes: {[attribute: string]: any};
}interface ILabelNode {
/**
* label
*/
label: string;
/**
* defines whether this node is collapsed (false) or expanded (true) or focussed ('focus')
* @default false
*/
expand?: boolean | 'focus';
/**
* list of children
*/
children?: ISubLabelNode[];
}
/**
* a label entry can be a single string or a complex ILabelNode
*/
declare type ISubLabelNode = ILabelNode | string;
interface IValueNode<T> {
/**
* the actual value of this node
*/
value: T;
/**
* list of children
*/
children?: ISubValueNode<T>[];
}
/**
* a value entry can be a single value or a complex IValueNode
*/
declare type ISubValueNode<T> = IValueNode<T> | T;npm install
npm run build Developed by datavisyn.

