A comprehensive analysis of UK road safety data from 2015-2018, examining over 529,294 traffic accidents to understand patterns, risk factors, and potential intervention points for improving road safety.
- Project Overview
- Data Sources
- ETL Process
- Analysis & Findings
- Visualizations
- Interactive Dashboards
- Key Findings
- Recommendations
- Technologies Used
- Installation
- Usage
- License
- Contact
The analysis utilizes three main datasets:
- Accidents Data (2015-2018)
- Casualties Data (2015-2018)
- Vehicles Data (2015-2018)
Total records analyzed: 529,294 accidents
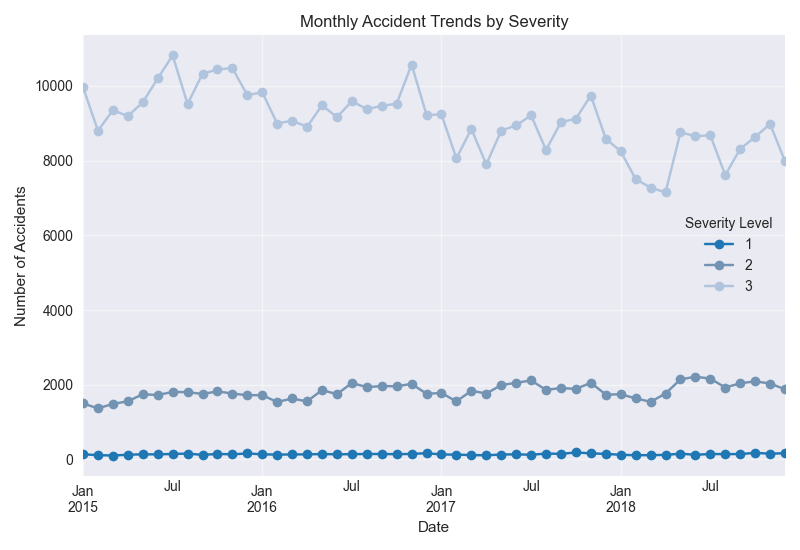
- Fatal Accidents: 6,658
- Serious Accidents: 87,462
- Slight Accidents: 435,174
-
Data Validation and Structure Assessment
- Performed initial data comparison between redundant datasets
- Validated matching data between directories
- Confirmed 100% match for all datasets
-
File Structure Standardization
- Implemented consistent naming conventions
- Standardized file organization
- Created unified directory structure
-
Data Transformation
- Converted timestamps from UK to US format
- Resolved time format inconsistencies
- Implemented datetime validation checks
-
Data Cleaning
- Executed custom cleaning scripts
- Performed error correction
- Ensured format consistency
- Generated comprehensive cleaning reports
-
Data Consolidation
- Created master files for:
- Accidents
- Casualties
- Vehicles
- Created master files for:
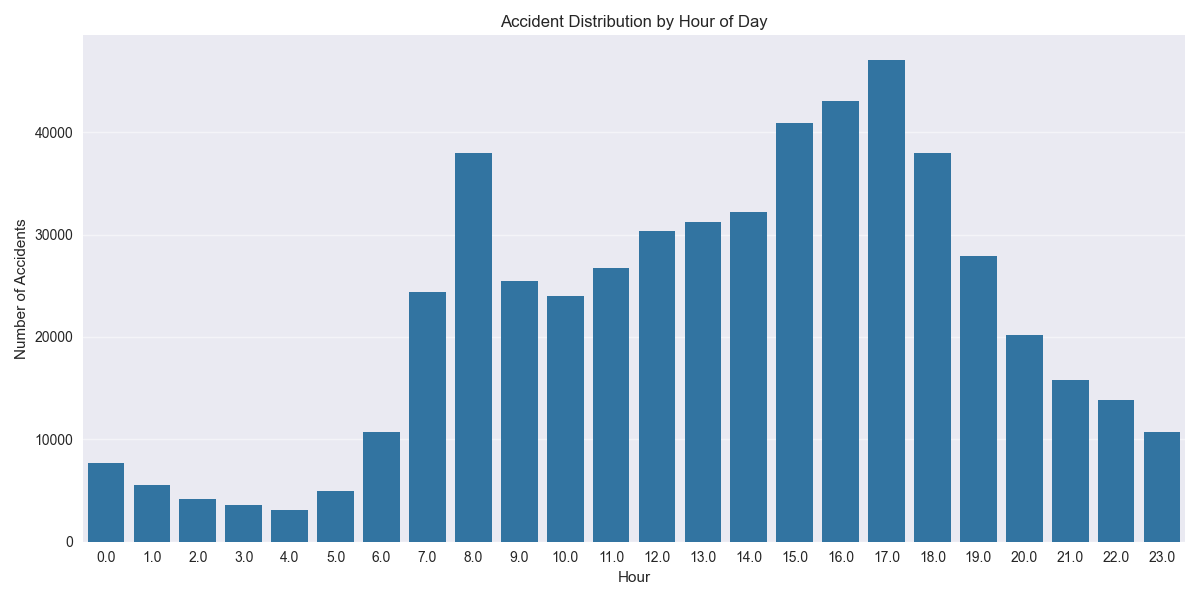
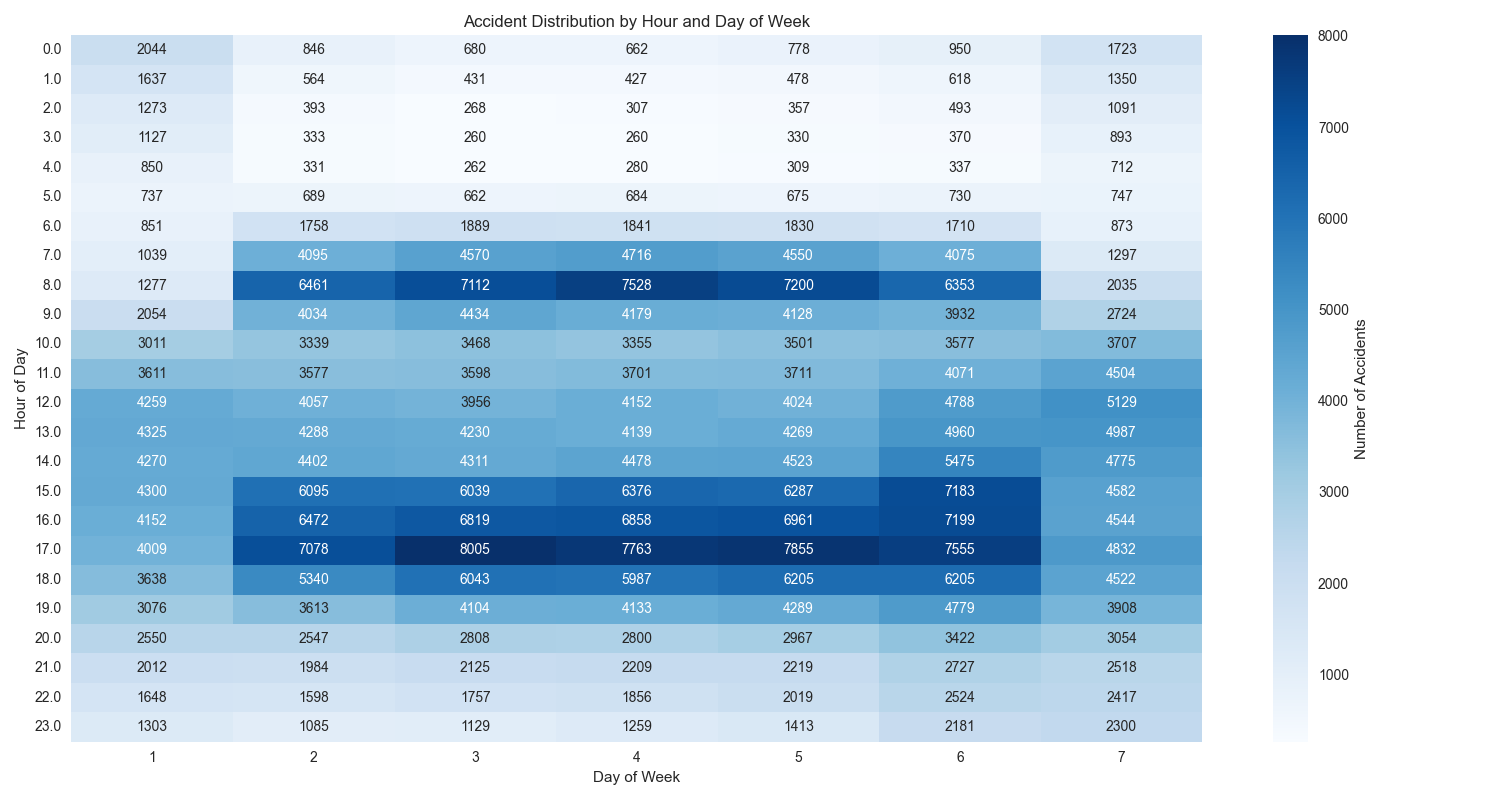
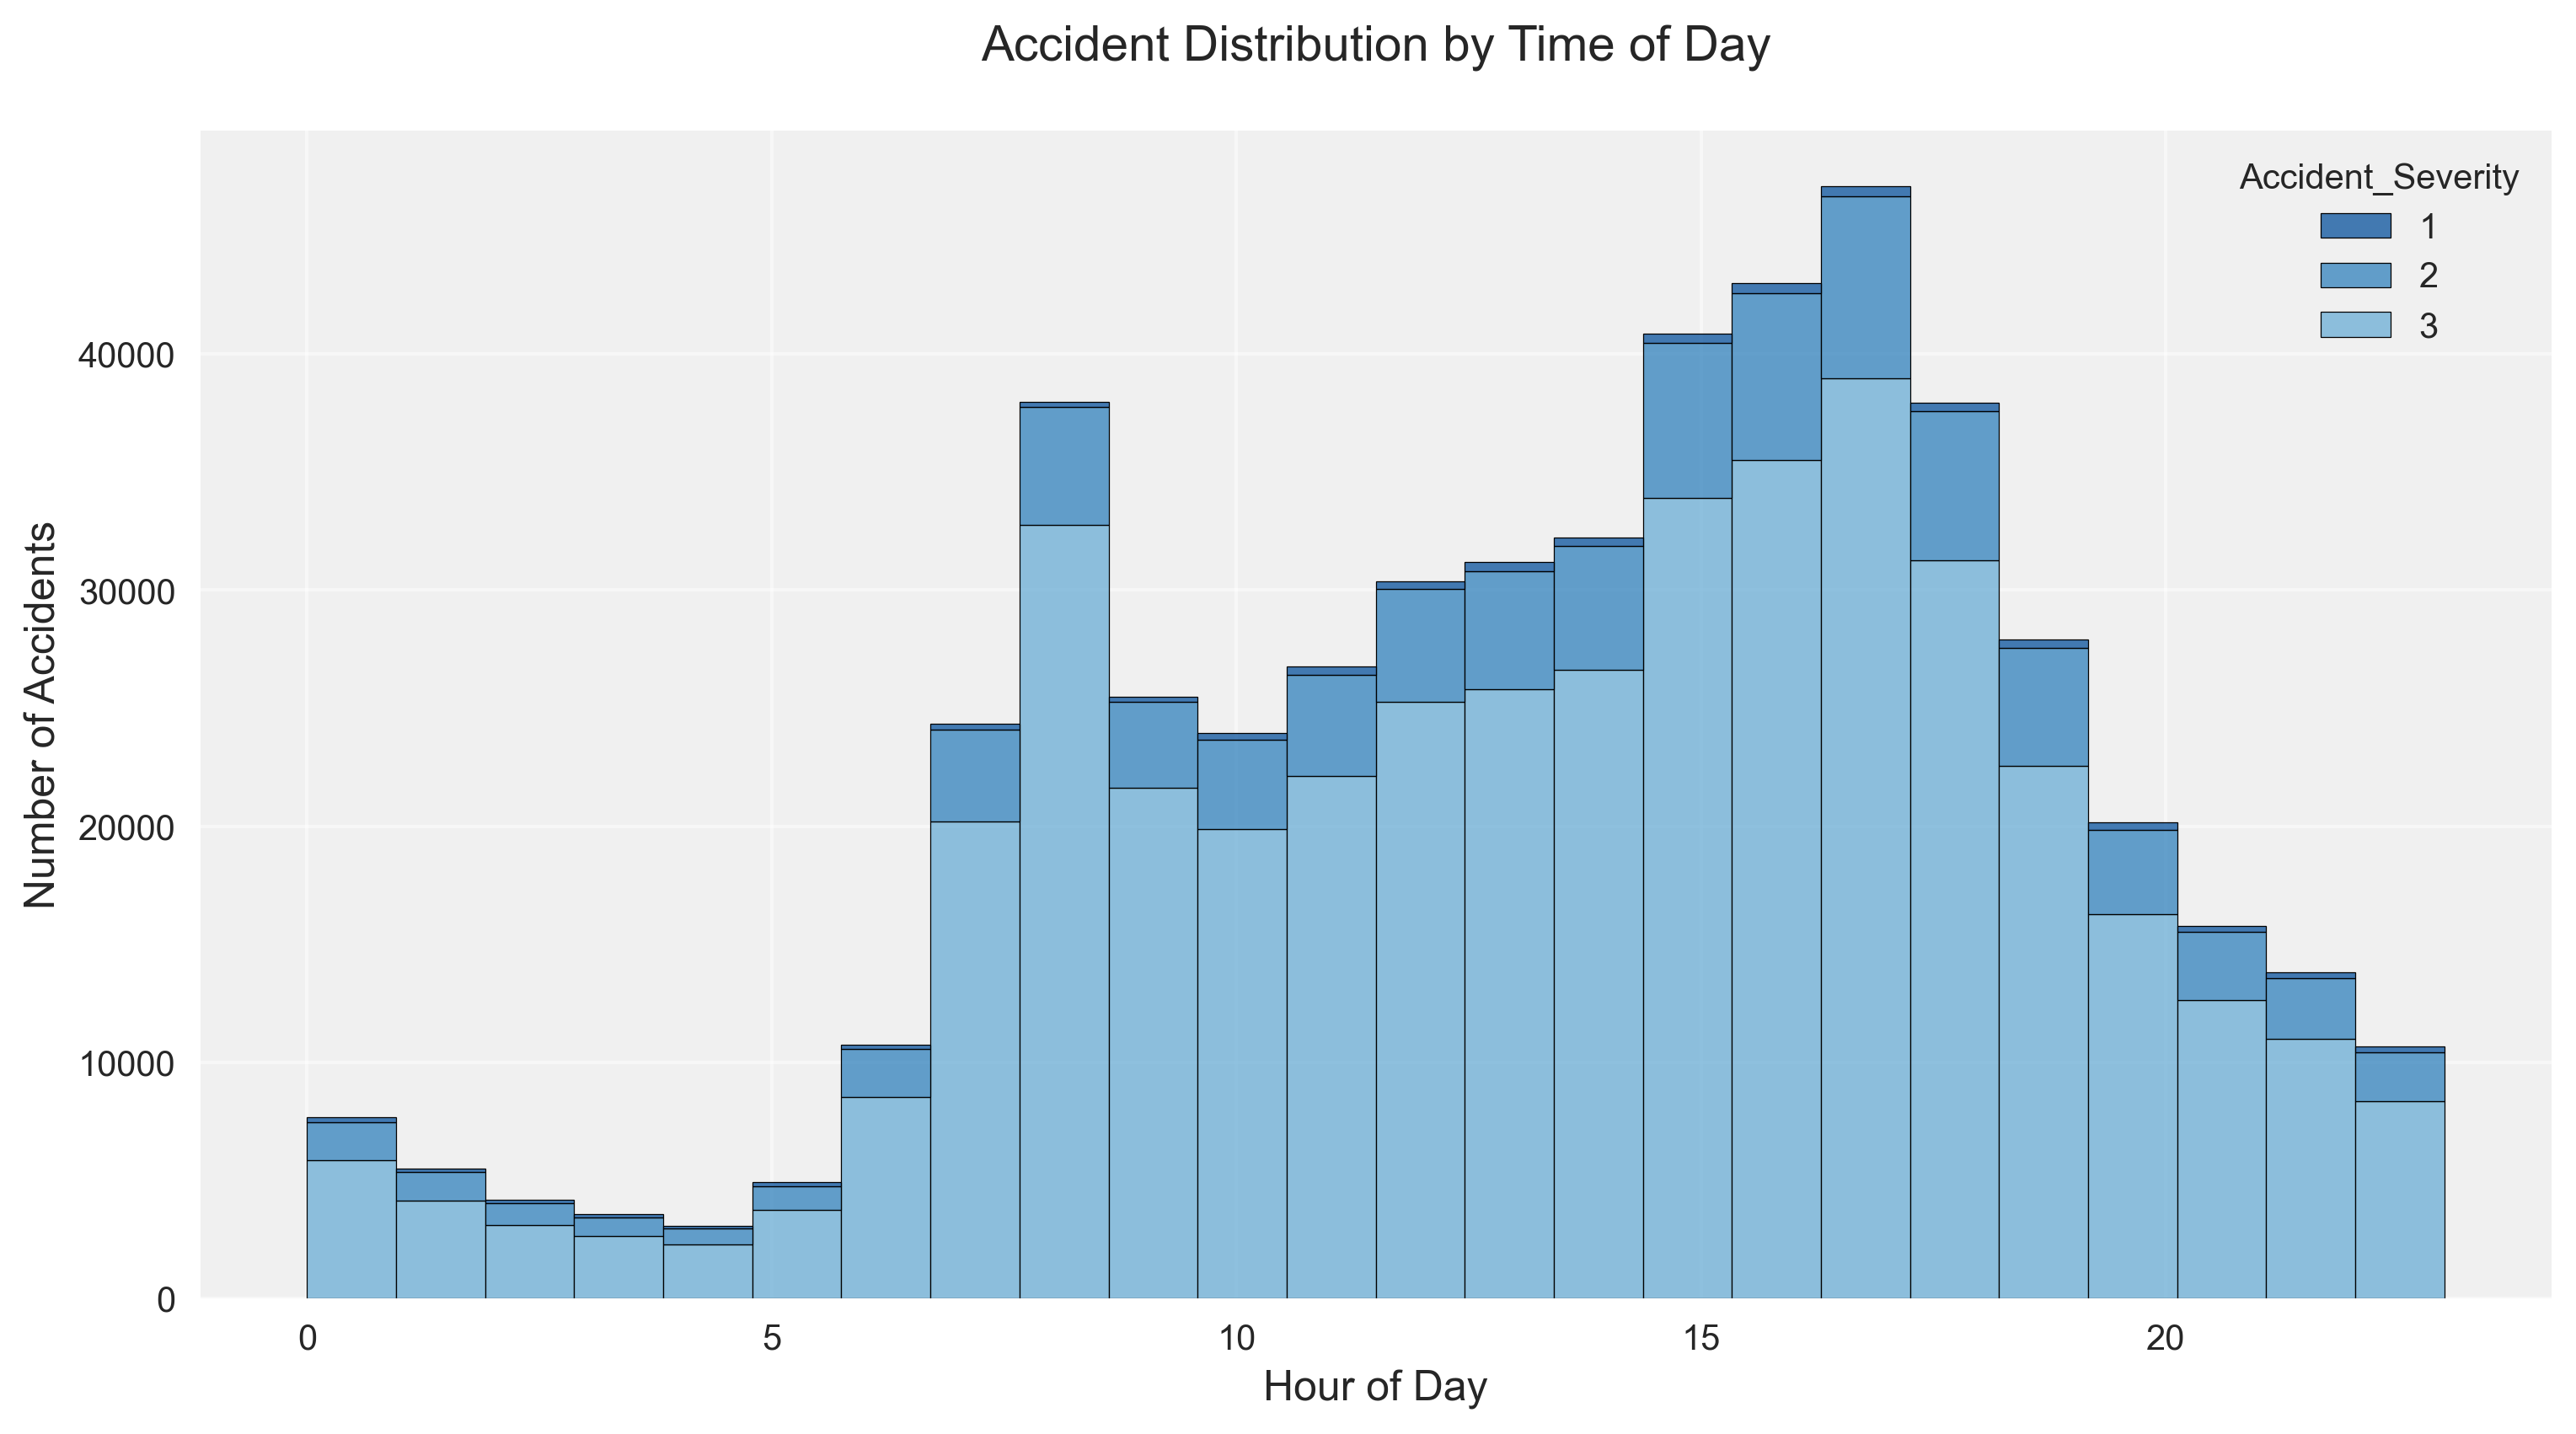
- Peak accident times during rush hours (7-9 AM and 4-6 PM)
- Higher severity rates during nighttime (11 PM - 4 AM)
- Distinct weekend vs weekday patterns
- Adverse weather significantly affects accident severity
- Rain: Higher frequency, lower average severity
- Snow/Ice: Lower frequency, higher severity rates
- Single carriageways show highest accident rates
- Strong correlation between speed limits and severity
- Urban roads: High frequency, lower severity
- Motorways: Low accident rates despite high speeds
- Young adults (18-25): Higher representation
- Elderly (65+): Higher severity rates
- Distinct pedestrian and cyclist patterns
Access the interactive Tableau dashboards:
- Python 3.8+
- Pandas
- NumPy
- Matplotlib
- Seaborn
- Tableau
- Jupyter Notebook
# Clone the repository
git clone https://github.com/guzmanwolfrank/uk-traffic-analysis.git

# Navigate to project directory
cd uk-traffic-analysis

# Install required packages
pip install -r requirements.txt# Example code for loading the datasets
import pandas as pd
# Load the accident data
accidents_df = pd.read_csv('data/accidents_master.csv')
# Load the casualties data
casualties_df = pd.read_csv('data/casualties_master.csv')
# Load the vehicles data
vehicles_df = pd.read_csv('data/vehicles_master.csv')-
Smart Infrastructure Implementation (15-20% potential reduction)
- AI-powered traffic management
- Dynamic speed limits
- Connected vehicle infrastructure
-
Enhanced Education Programs (10-15% potential reduction)
- Continuous learning systems
- Virtual reality hazard training
- Vulnerable user awareness
-
Technology-Based Solutions (20-25% potential reduction)
- Advanced driver assistance systems
- Vehicle-to-vehicle communication
- Automated emergency braking
This project is licensed under the MIT License - see the LICENSE.md file for details.
Wolfrank Guzman
- GitHub: @guzmanwolfrank
- Website: wolfrankguzman.com
- UK Department for Transport for providing the accident data
- Contributors and reviewers who helped improve this analysis
- The open-source community for the tools and libraries used


