
Cartographer provides interactive maps in R Markdown documents or at the R console. These maps are suitable for data exploration. This package is an R wrapper around Elijah Meeks's d3-carto-map and d3.js, using htmlwidgets for R.
Cartographer is under very early development and the API is unstable.
The leaflet package offers similar functionality.
To install the development version from GitHub, first install devtools. Then install Cartographer:
# install.packages("devtools")
devtools::install_github("ropensci/cartographer", build_vignettes = TRUE)
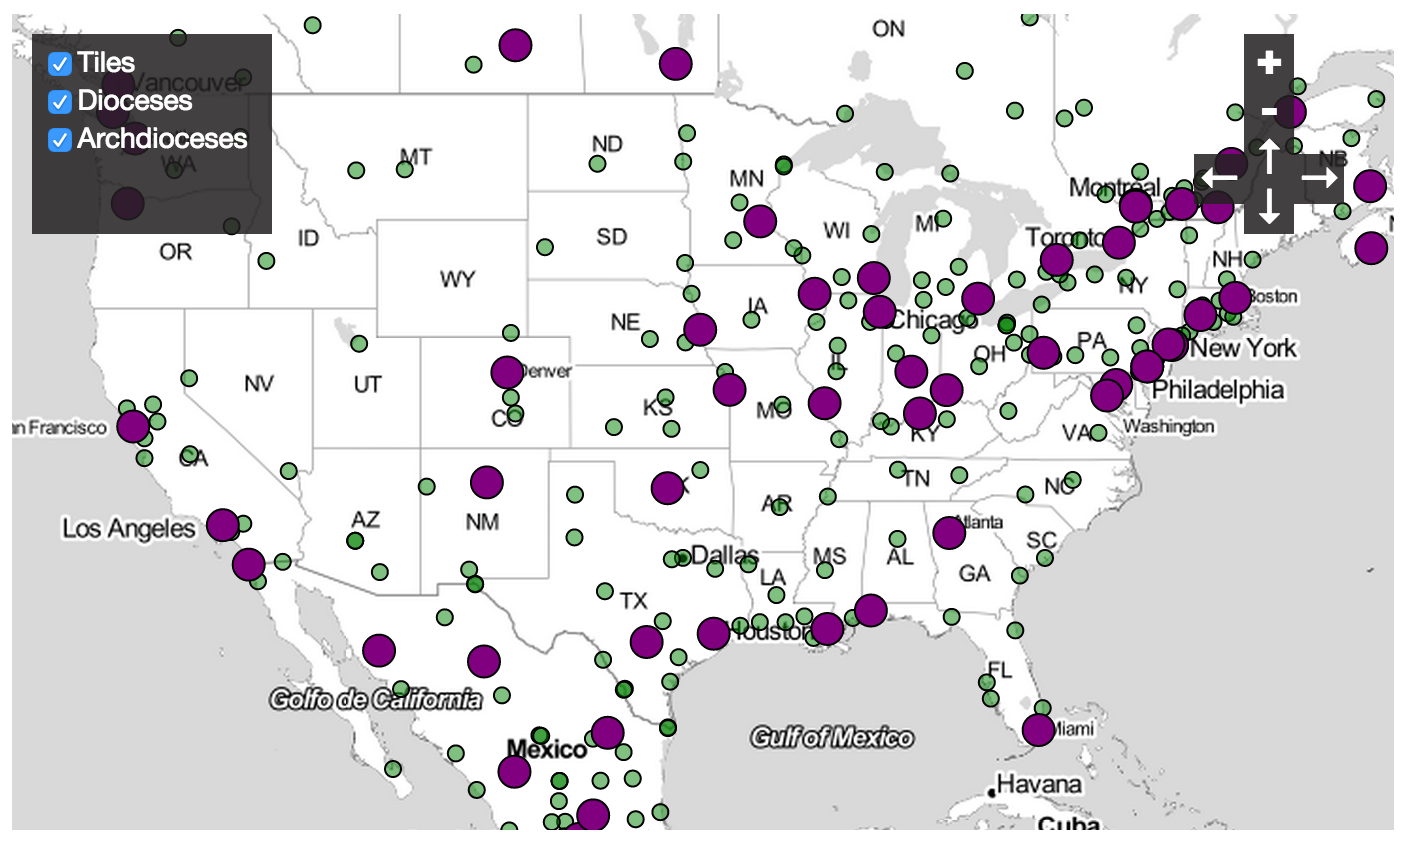
Cartographer maps are composed using a series of functions that add point, tile, or polygon layers and control map options like colors, sizes, and zoom. For more explanation, see the package vignette online or in R by running vignette("cartographer"). Below is the code for and a screenshot of a sample map.
cartographer(region = "united states") %>%
  tile_layer() %>%
  points_layer(data = dioceses, color = "green", size = 4,
                label = "Dioceses") %>%
  points_layer(data = archdioceses, color = "purple", size = 8, opacity = 1,
                label = "Archdioceses")
This code is released under the MIT License. The included JavaScript libraries are used under the terms of their own licenses. See the directories in inst/htmlwidgets/lib/ for their licenses.
