Script to check AWS Lambda functions for over-provisioned memory
Provisioning the exact RAM allocation for AWS Lambda functions is often a trial and error procedure and, it has happened to us that we set a huge catch-all value for development which sometimes forgets been tuned for production and other more usage intensive environments, where inadequate RAM setting might lead to wasted and unnecessary costs.
Using Cloudwatch Log Insights and their provided Sample Query to Determine the amount of overprovisioned memory, I've built a bash script (tested on OSX only, which actually leads to issues on date handling on other OS) which analyzes or your Lambda related CloudWatch logs (last 7 days by default, based on start_time variable) to scan for usage statistics and report possible allocation overhead.
NOTE 1: the reported overprovisioning does NOT necessarily mean that you should lower your setting by that exact amount but, experiment on lowering accordingly.
NOTE 2: lowering RAM setting has a direct correlation with assigned CPU resources, so you Lambdas may take longer to execute thus, less RAM does not always mean less cost.
NOTE 3: script runs according to your configured environment (account, credentials, profile, and region), so you can tweak what you actually want to scan via env vars (AWS_PROFILE, AWS_DEFAULT_REGION, AWS_ACCESS_KEY_ID, AWS_SECRET_ACCESS_KEY)
- Download lambda-overprovision.sh file
- Customize your script to set both your desired Cloudwatch Namespace and Metric name
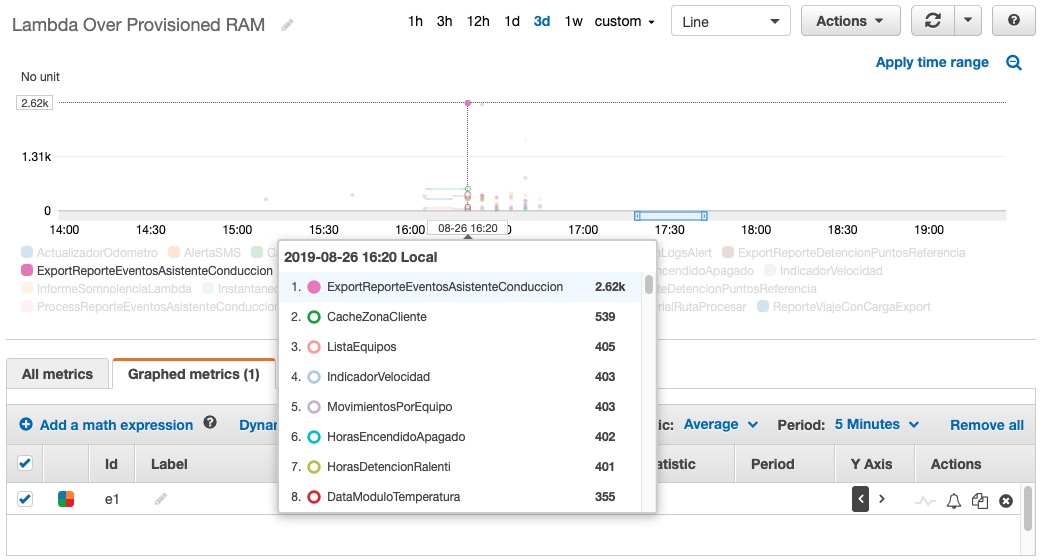
- Check the metrics created by graphing them. The highest the value, the most likely you can lower your RAM setting.
- AWS CLI (tested on aws-cli/1.11.190 Python/2.7.10 Darwin/18.7.0 botocore/1.12.64)
- jq (tested on jq-1.6)
In the following image, the Lambda Function is ExportReporteEventosAsistenteConduccion is reporting an over-provisioning of about 2 GB:
