Please note: this repository is based on the repository made by Ignacio Fite called DNA Telemetry Dashboard. We have added a few undocumented DNA Center API calls. Please note: using undocumented DNA Center API calls is at your own risk. In case there are any changes, then the API calls might stop working and this will not be communicated in the API change log. No formal support will be provided.
Cisco DNA Center has a great dashboard that shows a snapshot of your netwerk and device health. The history of the health and telemetry goes up to two weeks, but in some instances, we would like to have a longer history in order to understand the trend. This repository shows how to create dashboard in Grafana that shows the health and telemetry history. The data is stored in InfluxDB.
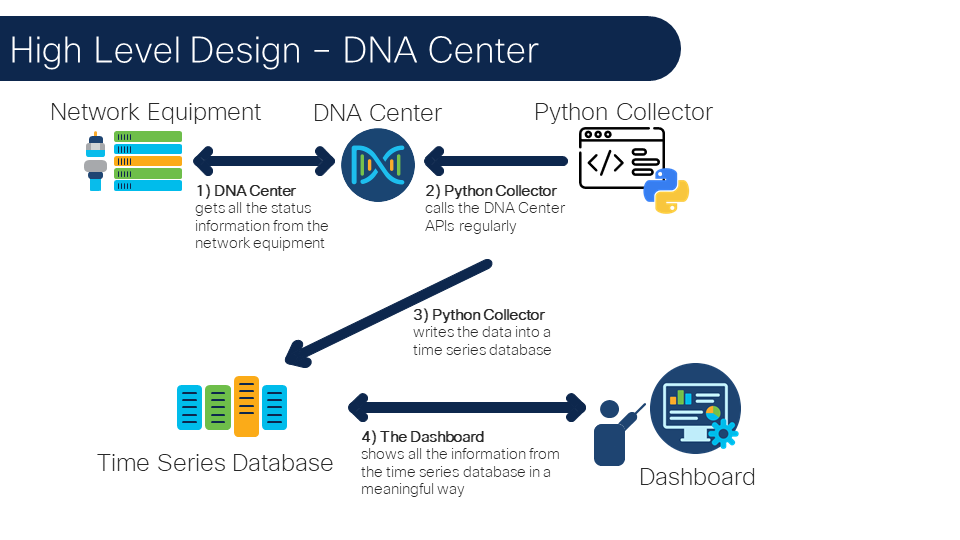
The following image illustrates the architecture:
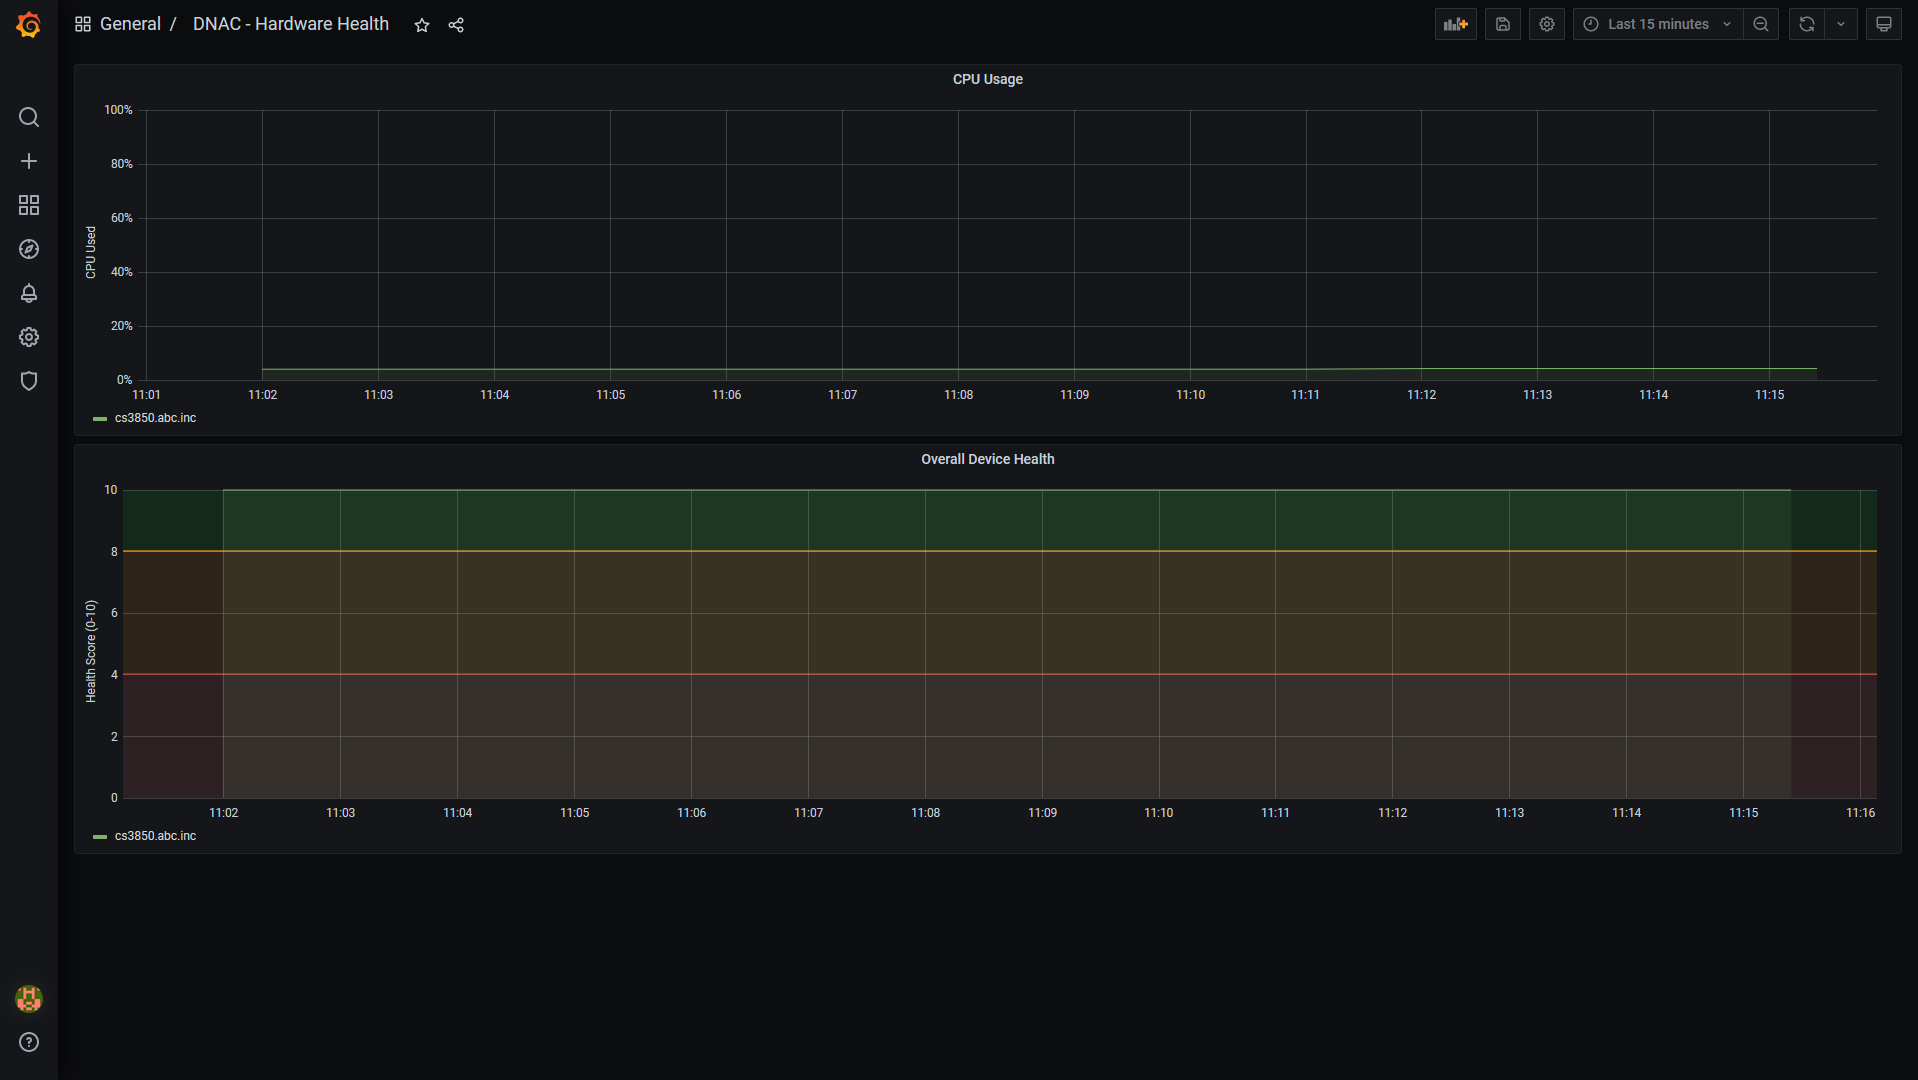
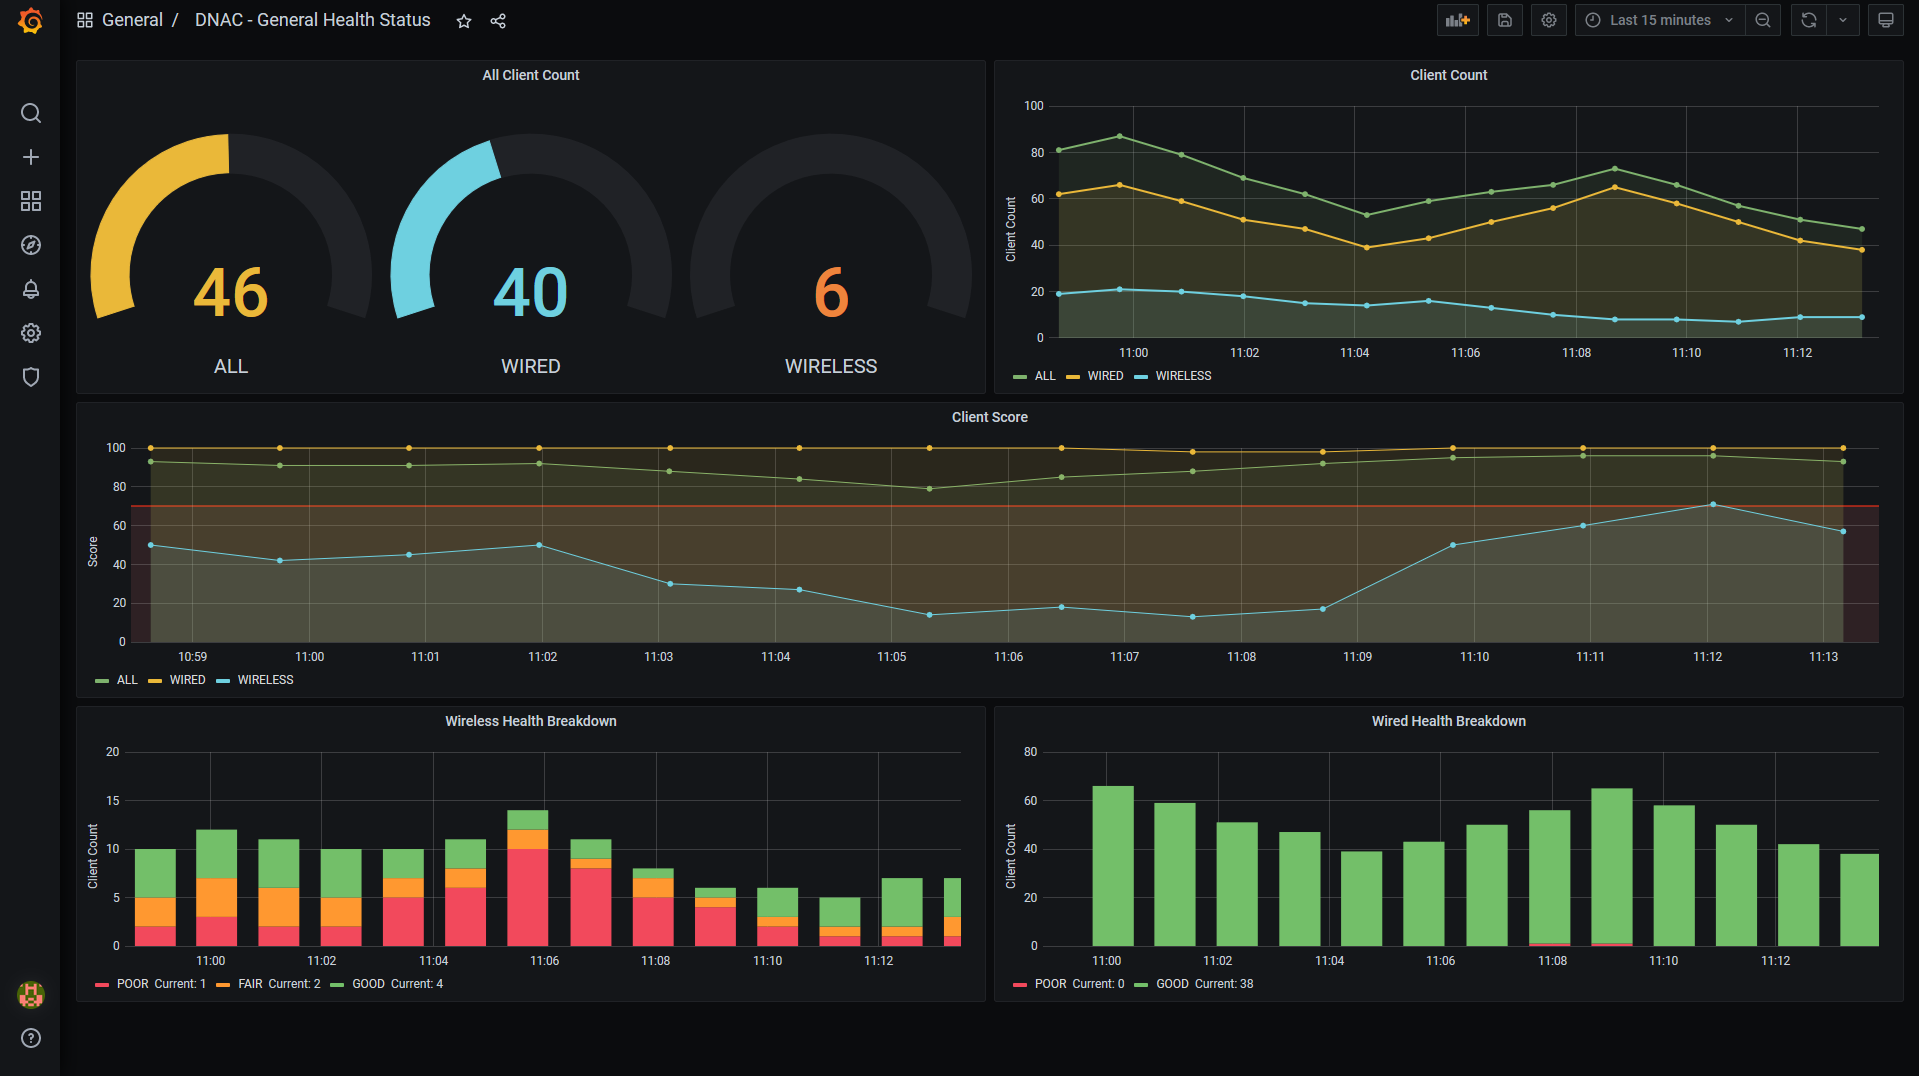
Screenshots of the dashboard:
- Stien Vanderhallen (stienvan@cisco.com)
- Simon Fang (sifang@cisco.com)
- Kim Gouweleeuw (kgouwele@cisco.com)
- Python 3
- DNA Center
- Grafana
- InfluxDB
For Grafana, we recommend using Homebrew. Follow the instructions below to install Grafana using brew:
-
Open a terminal and enter:
$ brew update $ brew install grafana -
Start Grafana using the command:
$ brew services start grafana -
Go to the following url in your browser:
http://localhost:3000 -
Create an account and save the username and password. You will need to add these credentials to your
.envfile.
Similarly to Grafana, we recommend that you install InfluxDB using the Homebrew package manager. Follow the instructions below to install InfluxDB:
-
Open a terminal and enter:
$ brew update $ brew install influxdb -
Start InfluxDB by entering the following command in the terminal:
$ influxd -
Go to the following url in your browser:
http://localhost:8086 -
Create an account and save the username and password. You will need to add these credentials to your
.envfile. -
Moreover, we also need to create an API token. Head to
Data > API Tokensand clickGenerate API Token > Read/Write API Token. -
Provide a name for the token and select the correct scopes and buckets and click
save. -
Click on the newly created token and copy the token to your clipboard. you will need to add the token to your
.envfile.
The following commands are executed in the terminal.
-
Create and activate a virtual environment for the project:
 #WINDOWS:
 $ py -3 -m venv [add_name_of_virtual_environment_here]
 $ [add_name_of_virtual_environment_here]/Scripts/activate.bat
 #MAC:
 $ python3 -m venv [add_name_of_virtual_environment_here]
 $ source [add_name_of_virtual_environment_here]/bin/activate
For more information about virtual environments, please click here
-
Access the created virtual environment folder
$ cd [add_name_of_virtual_environment_here] -
Clone this repository
$ git clone [add_link_to_repository_here] -
Access the folder
gve_devnet_dnac_telemetry_dashboard$ cd gve_devnet_dnac_telemetry_dashboard -
Install the dependencies:
$ pip install -r requirements.txt -
Open the
.envfile and add the username and password for your Grafana, InfluxDB and DNAC instances. In addition, you need to add the DNA Center URL. Please consult the previous section on how to obtain this information.# General Config TZ=Europe/Amsterdam # Influx Config INFLUX_HOST=http://localhost INFLUX_PORT=8086 INFLUX_ORG=Cisco INFLUX_DNACBUCKET=dnac INFLUX_TOKEN=<INSERT_INFLUX_TOKEN> INFLUX_USERNAME=<INSERT_INFLUX_USERNAME> INFLUX_PASSWORD=<INSERT_INFLUX_PASSWORD> # Grafana Config GRAFANA_HOST=http://localhost GRAFANA_PORT=3000 GRAFANA_USERNAME=<INSERT_GRAFANA_USERNAME> GRAFANA_PASSWORD=<INSERT_GRAFANA_PASSWORD> # Sleep Interval SLEEP_INTERVAL=60 # DNA Centers Configs DNACENTER_SANDBOX_URL=<INSERT_DNAC_URL> DNACENTER_SANDBOX_USER=<INSERT_DNAC_USERNAME> DNACENTER_SANDBOX_PASSWORD=<INSERT_DNAC_PASSWORD>
Now it is time to run your script. Before you do so, make sure that your Grafana, InfluxDB and DNAC instances are running:
-
Start your local InfluxDB instance with the following command in the terminal:
$ influxd -
Start your local Grafana instance with the following command in the terminal:
$ brew services start grafana -
Run your script by typing in the following the command in the terminal:
$ python main.py
-
Install Docker Desktop here
-
Install Docker Compose
$ pip install docker-compose
- Clone this repository
$ git clone https://www.github.cisco.com/gve-sw/gve_devnet_dna_center_telemetry_dashboard_tig/
- Navigate to the code directory
$ cd gve_devnet_dna_center_telemetry_dashboard_tig
-
Fill out and rename
app-code/.env_dockerto.envwith the information obtained above -
Build application
$ docker-compose down
$ docker-compose build
$ docker-compose up -d
- In a browser, navigate to
localhost:3000to access the Grafana dashboard
Provided under Cisco Sample Code License, for details see LICENSE
Our code of conduct is available here
See our contributing guidelines here
Please note: This script is meant for demo purposes only. All tools/ scripts in this repo are released for use "AS IS" without any warranties of any kind, including, but not limited to their installation, use, or performance. Any use of these scripts and tools is at your own risk. There is no guarantee that they have been through thorough testing in a comparable environment and we are not responsible for any damage or data loss incurred with their use. You are responsible for reviewing and testing any scripts you run thoroughly before use in any non-testing environment.


