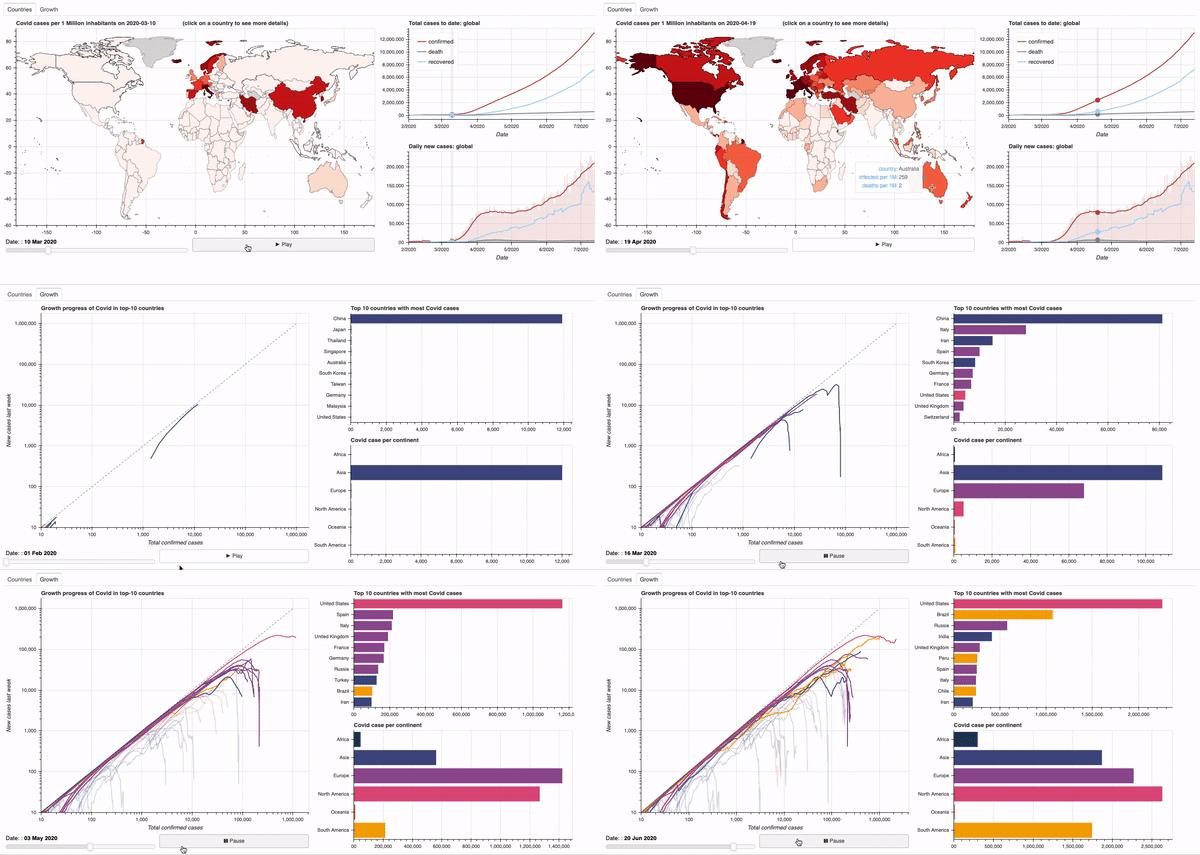
Objective: Dashboard to visualise the global spread of the Covid-19 virus.
General process: To generate the dashboard, data is gathered from Johns Hopkins Univerity, supplemented with demographic and geographic data. This data is cleaned, stored in a SQLite database after which we extract it and apply pre-processing for it to be displayed in a Bokeh dashboard in an efficient manner.
To run the dashboard, run bokeh serve main_dashboard.py. The underlying Covid data is automatically updated.
See below for a quick overview of the current dashboard.
To get the best experience viewing the jupyter notebooks, we advice to use jupyterlabs, with the table-of-contents (toc) extension.
A demo of the dashboard in action can be seen below.
├── README.md          <- The top-level README for developers using this project.
├── data
│   ├── processed      <- The final, canonical data sets for modeling.
│   └── raw            <- The original, immutable data dump.
│
├── notebooks
│   ├── data           <- notebooks to process data (gather, clean, store)
│   └── plots          <- notebooks to perform EDA and developt plots for the dashboard
│
├── requirements.txt   <- The requirements file for reproducing the analysis environment, e.g.
│                         generated with `pip freeze > requirements.txt`
│
├── src                <- Source code for use in this project.
│   ├── __init__.py    <- Makes src a Python module
│   │
│   ├── data           <- Scripts to download or wrangle
│   │
│   └── visualization  <- Scripts to create visualizations
│
└── main_dashboard.py  <- dashboard, run with `bokeh serve dashboard.py`
